
Share your thoughts
placeholder
Article
#Gate事件合约晒单挑战
PONS IS MAKING NOISE
Pons is suddenly one of the most watched launchpad stories on Robinhood Chain. The latest GateNews data shows Pons generated $1.84M in 24-hour revenue, surpassing Pump.fun’s $1.18M. That is a major signal because revenue reflects actual activity flowing through the platform rather than price movement alone.
THE NUMBERS MATTER
Pons generated roughly $660K more revenue than Pump.fun during the reported 24-hour period, meaning Pons was ahead by about 56% on that comparison. This puts the focus directly on activity, users and transaction flow around Robinhood Ch
post-image
PONS+27.66%
  • 2
JUST IN: Artificial Analysis revamps its Intelligence Index to v4.2, boosting private testing weight to 40% and adding AA-Briefcase and GDP.pdf modules to stress-test real-world tasks. No direct market catalyst implied.
post-image
i boil six eggs. five are perfect and one annoyingly turns out like this
wtf. skill issue perhaps
post-image
USDC’s revenue on Hyperliquid will provide 180 million annually for HYPE buybacks, around 500k per day. This is what a stablecoin should look like: sharing profits with the ecosystem rather than draining it.
post-image
USDC-0.02%
HYPE-0.17%
gm☕️happy wknd
post-image
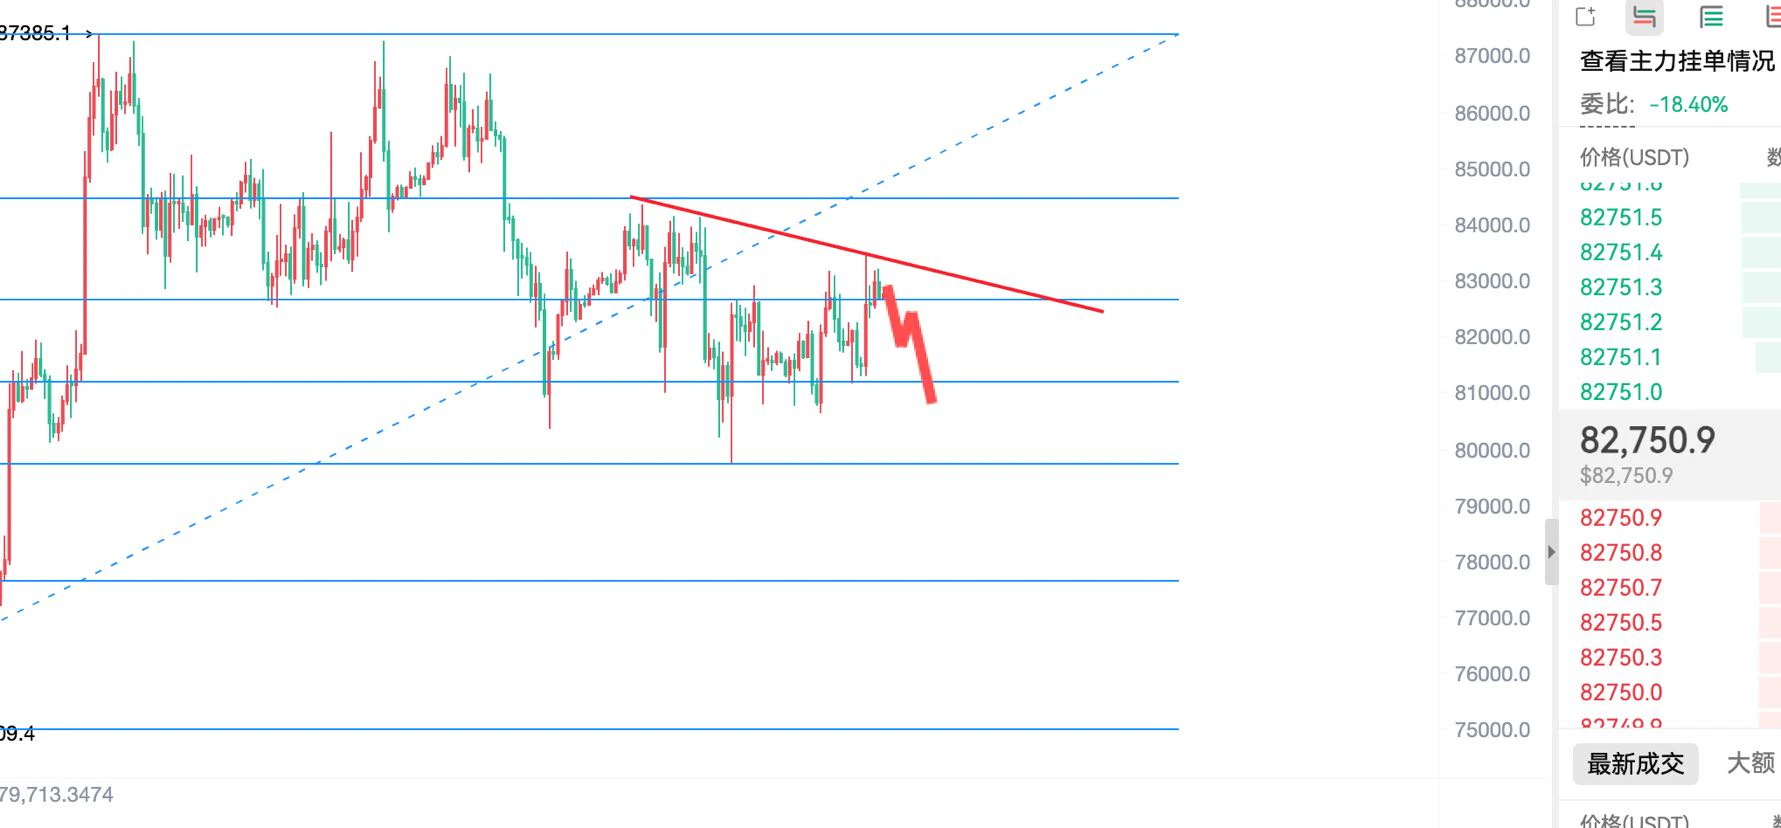
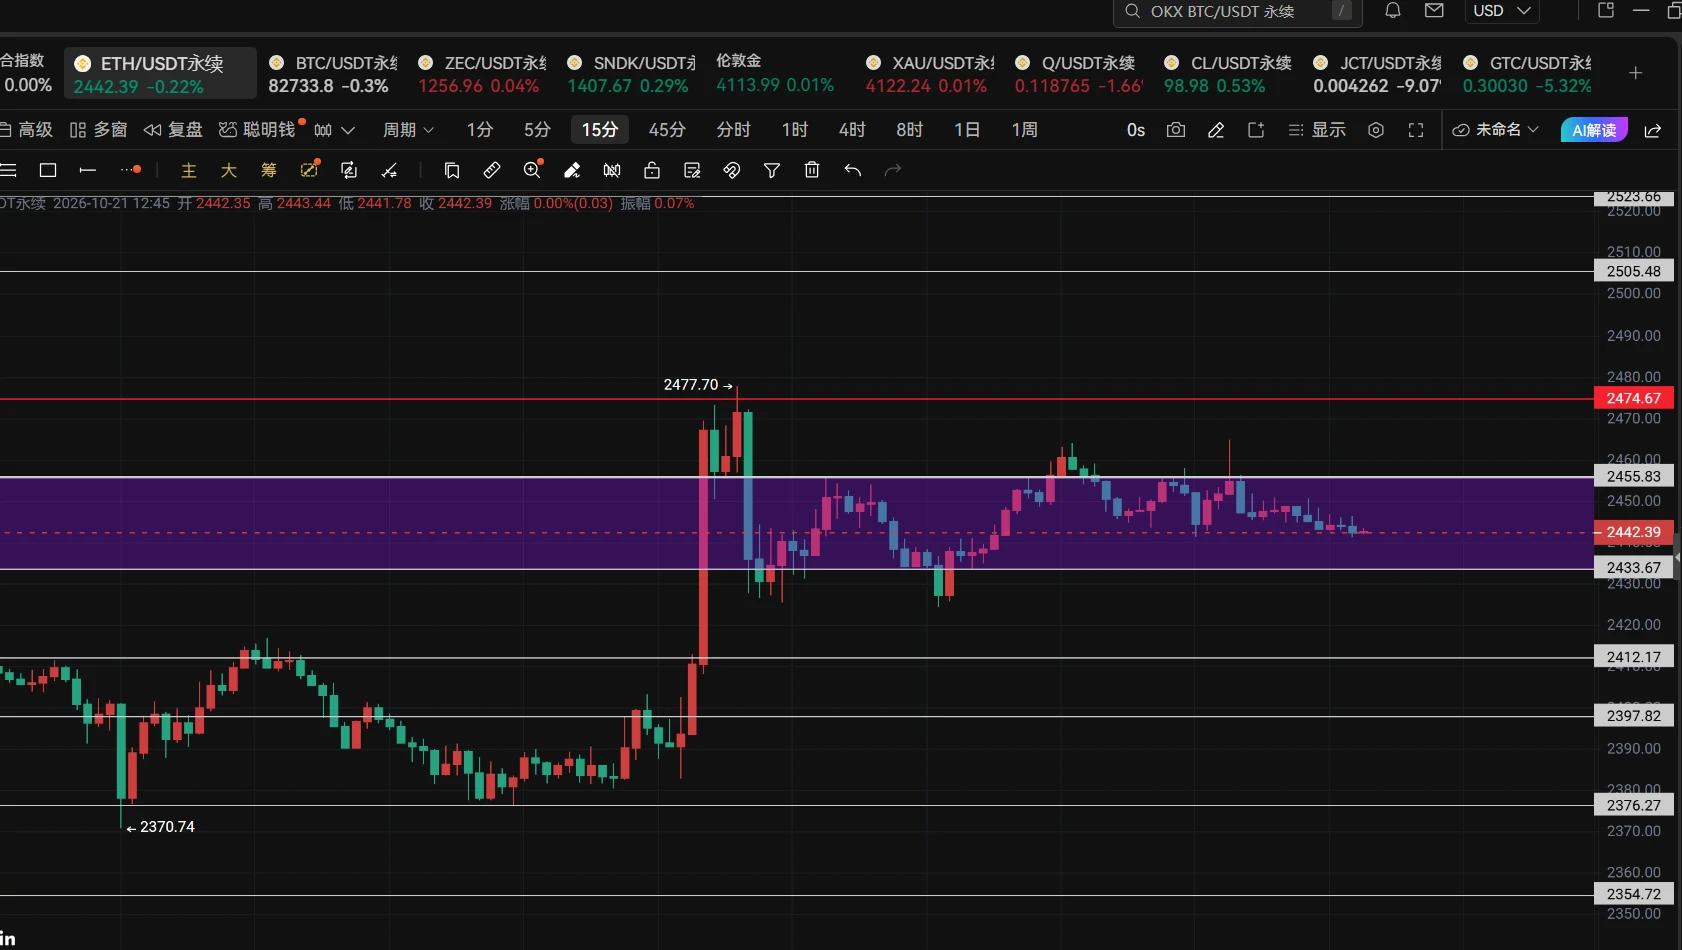
The weekend market is quiet, with little to analyze, and overall the focus is on range-bound recovery. Last night’s nonfarm payrolls data triggered sharp market volatility. It is recommended to stay on the sidelines over the weekend and patiently wait for possible reversal opportunities on Monday.
Technically, the hourly chart is still repeatedly battling within the range. Yesterday’s two large bearish candles precisely retested the support below, and the long wicks were not caused by heavy bearish volume, instead leaving room for a subsequent rebound by the bulls. As long as the low is not br
post-image
BTC+0.06%
ETH+0.05%
🏎️ Red Bull Trading Tour · Phase 6 is now live
Trade to climb the rankings and split the 60,000 GT prize pool! Win F1 race tickets
Complete multiple types of tasks and claim GT airdrops with no threshold!
VIP users get special acceleration—complete the upgrade to instantly receive generous mileage!
Enter now and accelerate to victory!
👉https://www.gate.com/competition/f1rb/s11
#RedBull #GateRedBullRacingTour #F1 Grand Prix.
post-image
GT+8.29%
$VEX seems good to run if we get a shift toward decentralized AI onchain under the attention umbrella of RH and virtuals. The chart looks great, see this moving toward 300M this month.
post-image
RH+0.98%
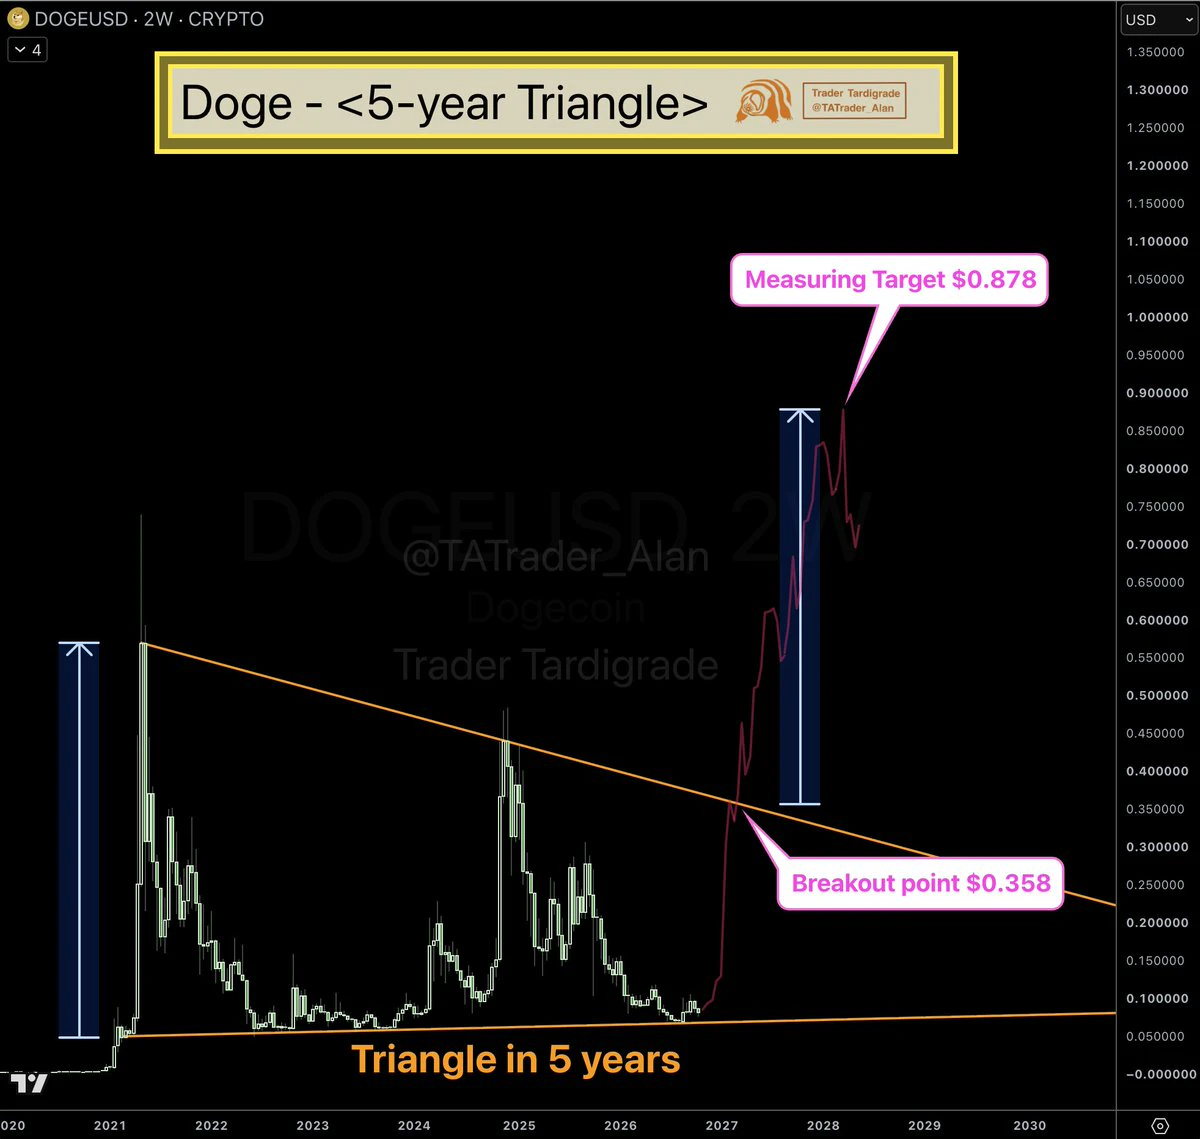
Layout for Bitcoin, Ethereum, and Dogecoin
live-cover
LIVE2,262
  • 1
$CELO
deviation played out. reclaimed its level and is looking ready to move back into the top.
post-image
CELO+4.77%
Subscribers, please note: Weekend market volatility is too low, and liquidity is lacking. Follow the trading strategy outlined in this morning’s analysis. If there are any other major changes, we’ll notify you separately!
post-image
NFA and DYOR
BUT
I think $PRINTER looks good here
If this goes higher, it’s an easy 3-4x
RH machines
post-image
$NOM Down ~99.9% From ATH: Is This The HTF Accumulation Zone For A 10x–30x Move?
#NOM Just Pumped ~120% In A Single Weekly Candle And Then Retraced Back To The Same HTF Accumulation Zone.
This Is Why I’m More Interested In The Current Support Than Chasing The Pump.
Technical Structure
✅ ATH: $2.30 | Macro Drawdown: ~99.9%
✅ HTF Accumulation: $0.0018–$0.0013
✅ Resistance/Targets: $0.00700/$0.03829/$0.49715
🛑 Invalidation: HTF Close Below $0.00125
Pattern Psychology
⚠️ 120% Weekly Pump Shows Extreme Volatility.
⚠️ The Real Confirmation Is Whether Buyers Can Hold This HTF Support.
⚠️ Losing $0.0
post-image
NOM+18.87%
$TSLA is testing an important area after a sharp 4H pullback.
Price is around $353.91, down nearly 6%, and has fallen back toward the MA30 near $353 after rejection from the $375–$380 region.
📊 Key levels I’m watching: • Support: $351–$353
• Next major support: $323–$330
• Resistance: $362–$365
• Major resistance: $376–$384
Momentum has weakened, with price now below the MA5 and MA10 while MACD is showing short-term bearish pressure.
If buyers defend $351–$353, TSLA could attempt a recovery toward $365. Losing this zone would make a deeper correction more likely.
For me, $353 is the decision
TSLA-2.22%
  • 5
Everyone's watching SUI bounce—nobody's clocking the 4h ceiling that just got cheaper to fade.

$SUI /USDT - SHORT

Trade Plan:
Entry: 0.7812 – 0.7858
SL: 0.8054
TP1: 0.7670
TP2: 0.7561
TP3: 0.7396

Why this setup?
Why now?
- 1D trend is *range*, not breakout—so 0.7835 is the rejection zone, not the launchpad.
- RSI 15m at 56 shows weak momentum: bulls can't push past the midpoint.
- ATR 1h (0.0091) says volatility is tight—when it snaps, it snaps toward the path of least resistance: DOWN to TP1 0.7670, then TP2 0.7561.
- Confidence 55.4 isn't screaming, but the risk/reward from 0.7
SUI+6.28%
[New Streamer] Whales Move in Sync!
live-cover
LIVE1,954
$SOL SOL/USDT — Professional Technical Analysis
SOL/USDT — Professional Technical Analysis
Timeframe: 2H
Current Price: ~102.36
Market Structure
SOL is currently trading inside a bearish descending channel, with price consolidating around the 102–104 area. The broader structure remains cautious until the channel resistance is broken.
Key Support Zones
100.00–98.20 → Important demand/support zone
96.20–97.20 → Strong Order Block
91.65 → Major structural support
Key Resistance
104–106 → Channel resistance / selling area
110.53 → Major resistance
Bullish Scenario
If SOL breaks and closes a
post-image
SOL+1.23%
#Gate60MillionUsers
60 MILLION USERS.
But behind that number are 60 million different stories.
Some people joined Gate to trade.
Some came looking for opportunities.
Some wanted to discover new assets.
Some became creators.
Some found a community.
And for many, their first trade probably became a story they still remember.
My story started in August 2025.
At that time, my main focus was Futures trading. I wanted to understand the market better, study price action, identify stronger setups, and become more disciplined with my decisions.
But I quickly realized that my journey on Gate was becom
post-image
BTC+0.06%
  • 1
No trades, no analysis, just sheer luck—this performance is embarrassing even to talk about. Just kidding. 😂 Right after I saw the bearish news, $APT pulled back up to around 0.9133, and quite a few people thought a reversal was coming. But I took a glance at the trading volume: the rebound was pitifully weak, with sell orders piling up layer after layer—a textbook fake move. When it failed to push higher again, I entered directly, without the slightest hesitation.
The market has now slid to 0.6036, with a paper gain of +2406.1%, and the account is partying on its own. The position management
post-image
APT+4.59%
SOL+1.23%
ZEC+2.36%
Everyone’s staring at DOGE at 0.0861—but the 4h chart just whispered a secret most retail missed.

$DOGE /USDT - SHORT

Trade Plan:
Entry: 0.0859 – 0.0863
SL: 0.0876
TP1: 0.0850
TP2: 0.0843
TP3: 0.0832

Why this setup?
- 1D trend is *range*, not breakout—so bulls are renting, not owning.
- RSI on 15m at 57.6 is cooling off a local pump, giving sellers a clean re-entry window.
- ATR (0.000608) says volatility is compressed—when that snaps, it snaps fast.
- Short bias at 55% conviction means the path of least resistance is down to TP1 (0.0850) before TP2 (0.0843).
- Why now? The 4h st
DOGE+2.24%
Load More

Join 40 M users in our growing community

⚡️ Join 40 M users in the crypto craze discussion

💬 Engage with your favorite top creators

👍 See what interests you

View More