

Share your thoughts
placeholder
Article
[$BTC Signal] Long + 1H moving average cluster providing support
$BTC Order book buy/sell ratio 1.97, depth imbalance 32.57%, 1H EMA20/50 converging at 76450-76467. The current price of 76654 is above both lines, while the 1H Bollinger upper band at 76801 is providing resistance.
🎯 Direction: Long
⚡ Entry/pending order: 76424.337 - 76654.300
🛑 Stop-loss: 75887.757
🚀 Target 1: 77804.115
🚀 Target 2: 78379.022
🛡️Trade management:
- Execution strategy: After reaching Target 1, reduce the position by 50% and move the stop-loss up to breakeven. If the price falls back to the entry level, exit
post-image
BTC+1.03%
ETH+2.03%
SOL+2.78%
JUST IN: SEC Chair signals on-chain trading of tokenized stocks via an "innovation exemption" as CLARITY Act stalls. If this path holds, on-chain access could expand beyond traditional equities. $BTC $ETH (no explicit stock ticker needed; but include TIC if relevant)
post-image
BTC+0.99%
ETH+2.03%
Earlier we covered Arc's first days, the drop figures from ARGUS to COOL, the liquidity math and the institutional narrative. Now the hardest part: what am I doing?
The short answer: no panic selling, but no FOMO buying. These are the five questions I ask myself when deciding.
One: Is this drop a broken story, or just the first-day spike being given back? The second looks dominant here; prices had risen to their highs on new-listing excitement.
Two: Is chain usage growing, or is only the token price being discussed? What needs to be measured on Arc is durable liquidity and real transaction cou
post-image
xxx40xxx
Who Is Arc Built For? The Gap Between the Institutional Story and Meme Culture
In the first three parts we examined the sharp selloff in the Arc ecosystem, the numbers and the liquidity structure. Now let's step back and ask: who was this chain designed for?
Arc is a Layer-1 signed by Circle and focused on stablecoin-based financial applications. In other words, it aims to compete with its rivals not through meme tokens but through payments infrastructure. The presence of institutional names such as BlackRock and Visa on the validator list makes the target audience obvious: payment flows, institutional foreign exchange and tokenisation. The fact that gas fees on the network can be paid in USDC is part of the same story — a design that does not require users to hold a separate native gas asset. In short, Arc claims to be financial infrastructure, not an "entertainment chain".
One of the clearest voices on this was DeFi researcher Ignas. Ignas wrote that trading meme tokens on Arc gave him no FOMO at all, that the network is positioned around institutional FX and payments, and that it shows no clear support for retail traders and degen culture. As a comparison he cited Robinhood Chain; in his view, that structure is more open to crypto-native users and developers.
His second point was the ARC token distribution: 60% of the tokens are planned for the ecosystem, but this is expected to flow to payments, FX and tokenisation partners as subsidies rather than as direct incentives to meme traders. That also explains why first-day risks were priced so quickly: there is a serious mismatch between the narrative and the buyer base. In the final part I will share my own decision framework.
Note: This content is not investment advice.
$ARC
#Gate广场中秋团圆局 #Arc生态热门代币波动加剧 #ArcEcosystemHotTokensSeeIncreasedVolatility
#GateSquareMidAutumnReunion
repost-content-media
ARC-4.42%
Say he’s uncivilized? He’s actually pretty civilized—he knows to poop in the trash can.
Say he’s civilized? He’s actually pretty uncivilized—he poops in the street💩.
post-image
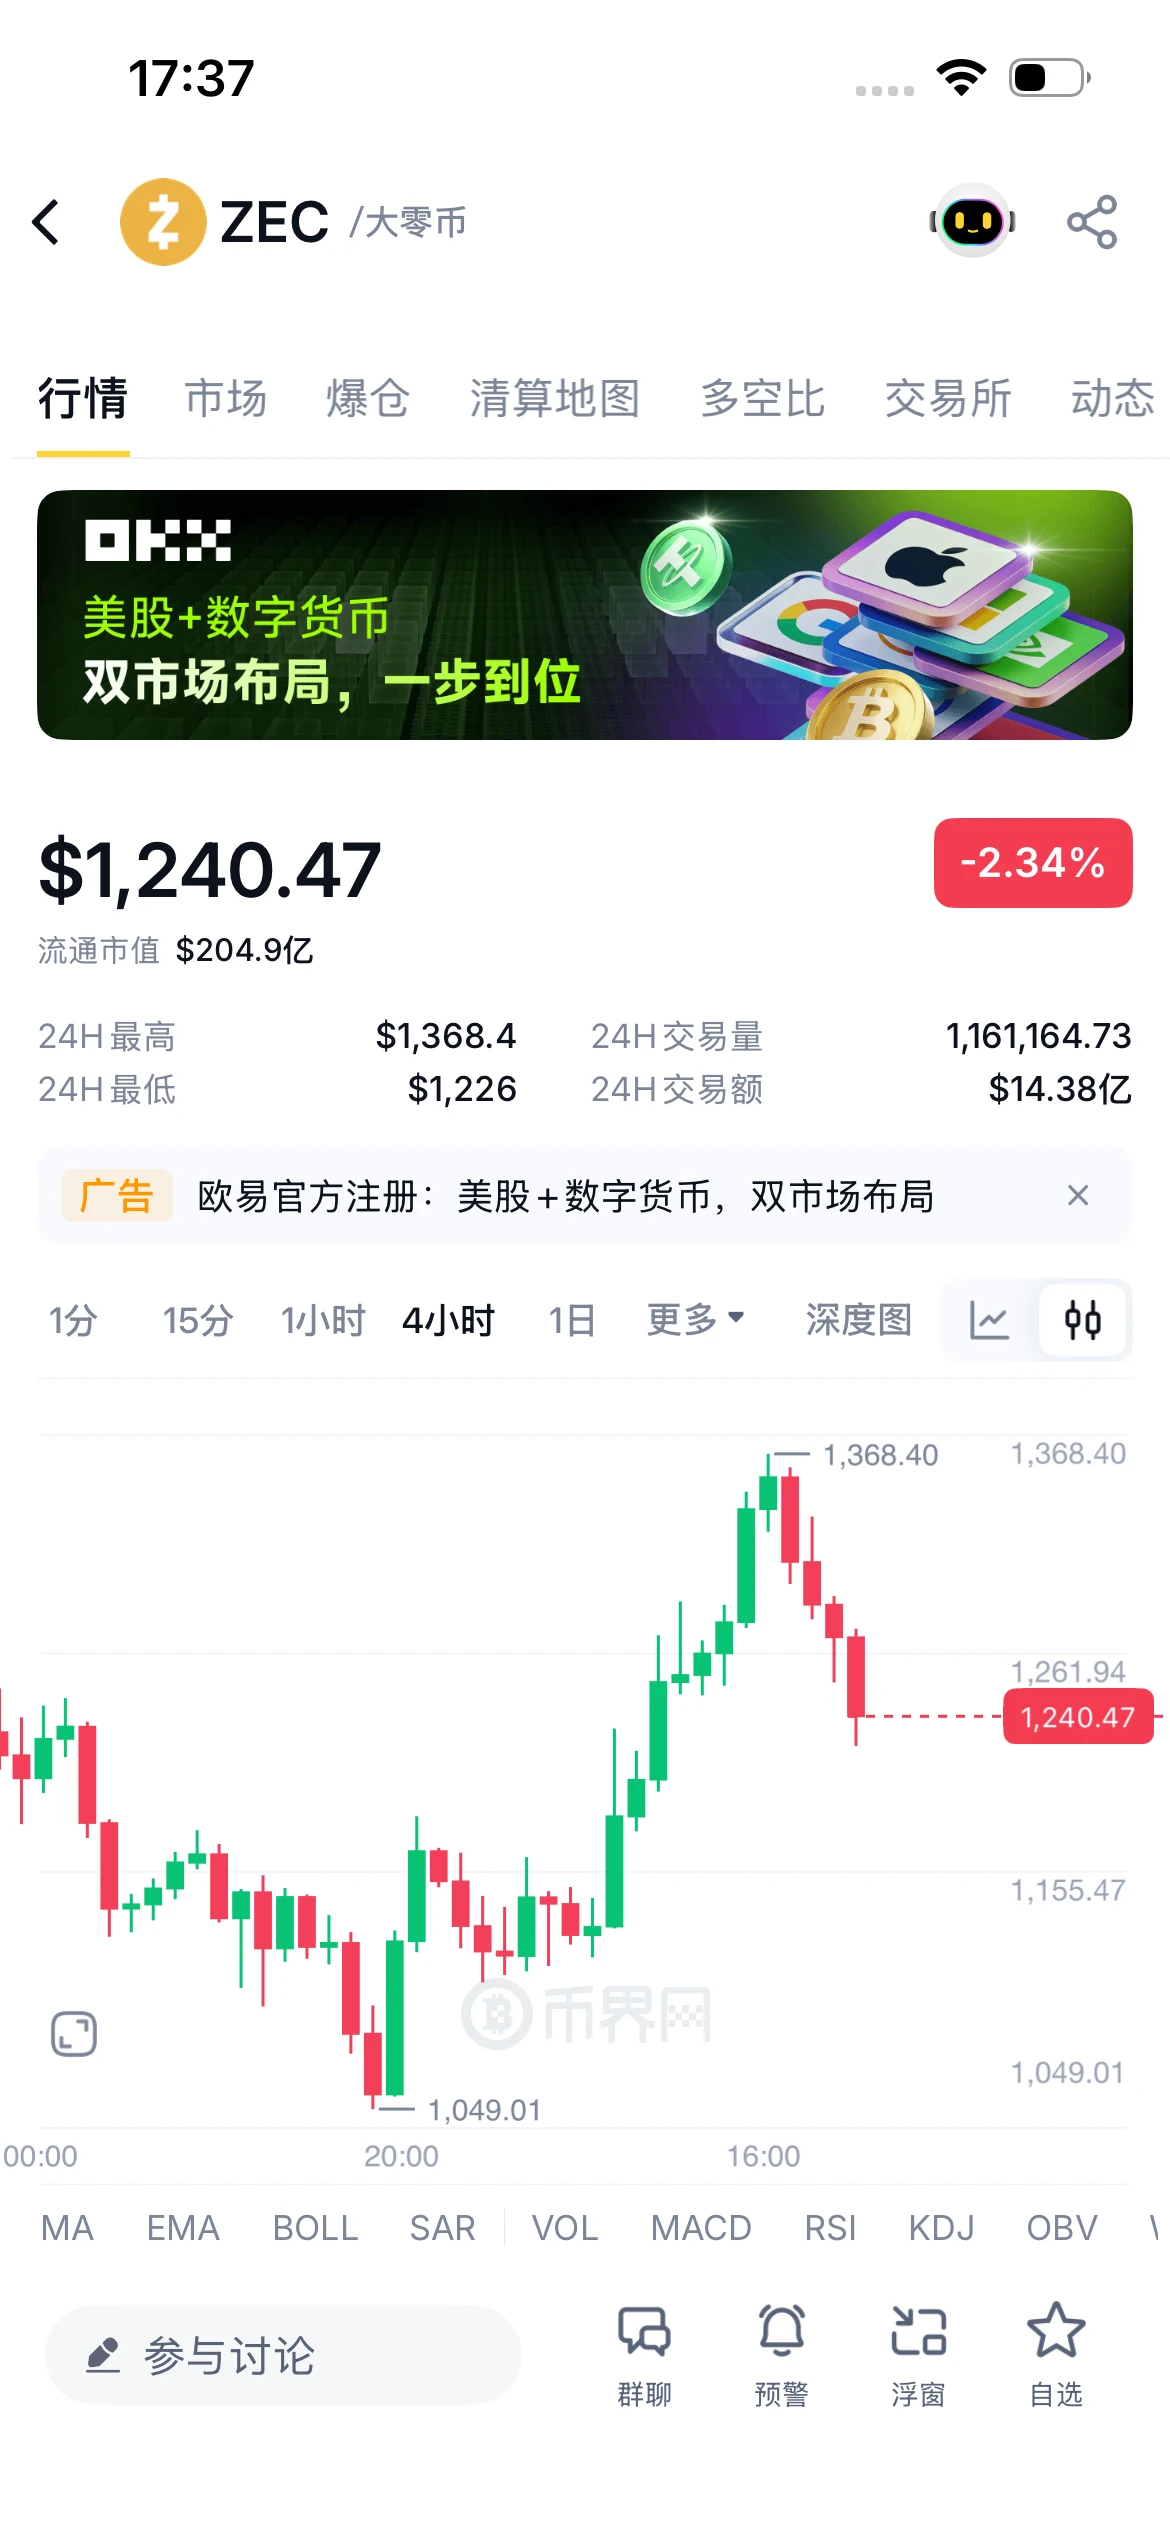
Since August 18, 2026, liquidations from this ZEC rally have exceeded those in the previous wave. If you’re wondering why it rose, just look at the futures trading volume: since 2021, futures have dominated spot trading. Since 2023, it has been rare to see such a heavily market-maker-controlled coin. This coin consolidates at high levels instead of moving sideways—the control is truly impressive. The key is that it is moving against BTC’s trend, so even more people are shorting it.😀
post-image
ZEC+9.17%
BTC+0.99%
I was in a pretty bad mood today, but felt a bit better after opening my account—at least staying up wasn't for nothing. A few days ago, the last thing I saw before bed, $APR every push upward fell just short. The bullish signal was already crystal clear, with strong bull-trap vibes and insufficient buying support.

From 0.19525 to 0.16094, +429.52% secured. That was a satisfying bite.

Close 80% first, and protect the remaining 20% at the entry price. Lock in profits when it's time.

Having no position isn't a sin; opening positions recklessly is.

At this level, chasing the trade makes
post-image
APR+3.93%
XRP+0.50%
LAB+5.94%
The most unusual detail in today’s market is: $0G gained 11.46% over 24h, but its current price of 0.2043 is still below MA5 (0.2044), while the funding rate has turned positive at +0.0050%. The price is running close to the Bollinger upper band at 0.212715, but RSI is only 60.1 and has not entered the overbought zone—this is not a healthy breakout pattern, but a passive rise driven by short covering, offering poor risk-reward for chasing. The 30-candle amplitude is 18.16%, with volatility clearly higher than FET’s 12.97% and KORUB’s 14.2%; the same stop-loss distance is more likely to be swe
post-image
0G+10.12%
FET+10.62%
#WhereToParkStablecoinsWhileWaiting WHERE TO PARK STABLECOINS WHILE WAITING?
For me, this is one of the most important questions for every trader and investor who is holding USDT or USDC while waiting for the right market entry. Holding stablecoins is not simply about staying out of BTC or ETH. The real question is what should we do with that capital during the waiting period so it remains available, productive and properly managed without taking unnecessary risk.
My approach is simple: if I am waiting for a better BTC entry, I do not want to force a trade just because my capital is sitting i
post-image
Live trading - Analysis crypto market
live-cover
LIVE1,940
A whale sold about $27.45M in HYPE spot while keeping a $30.23M short, realizing a ~$5.82M loss over 30 days. If this signals risk-off or hedging activity, it could weigh on near-term HYPE moves. $HYPE
post-image
HYPE+4.12%
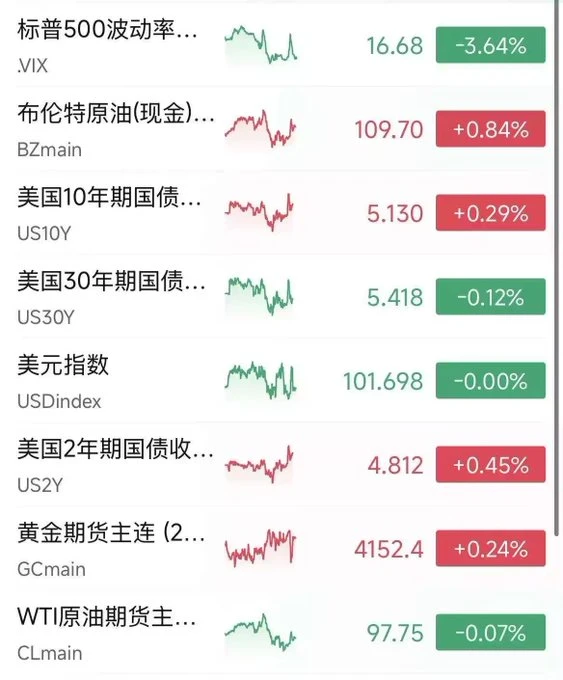
#BrentCrudeDrops3% 🚨 — Oil Just Delivered a Major Signal to Global Markets
Brent crude is falling nearly 3%.
The international benchmark dropped to around $102–$103 per barrel, reaching its lowest level in roughly a week as immediate concerns about Middle East supply disruptions began to ease. Reports of additional Saudi crude cargoes moving through Oman, combined with expectations that disrupted infrastructure could be restored, helped reduce fears of an acute supply shortage.
But this is not simply another red candle in the oil market.
The move matters because crude oil sits at the center o
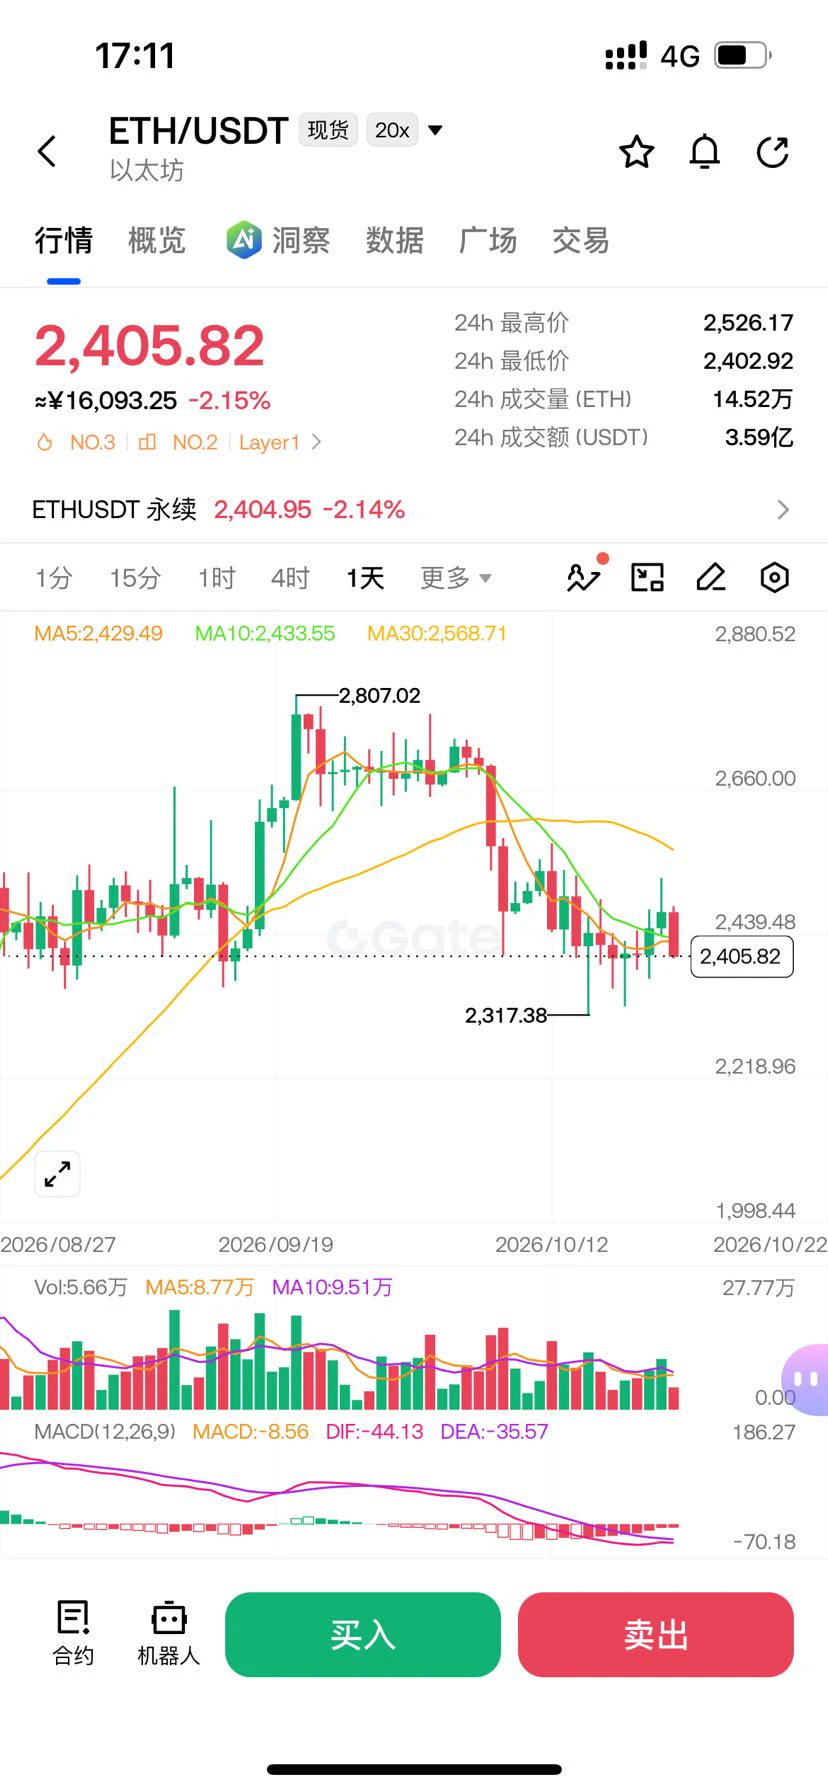
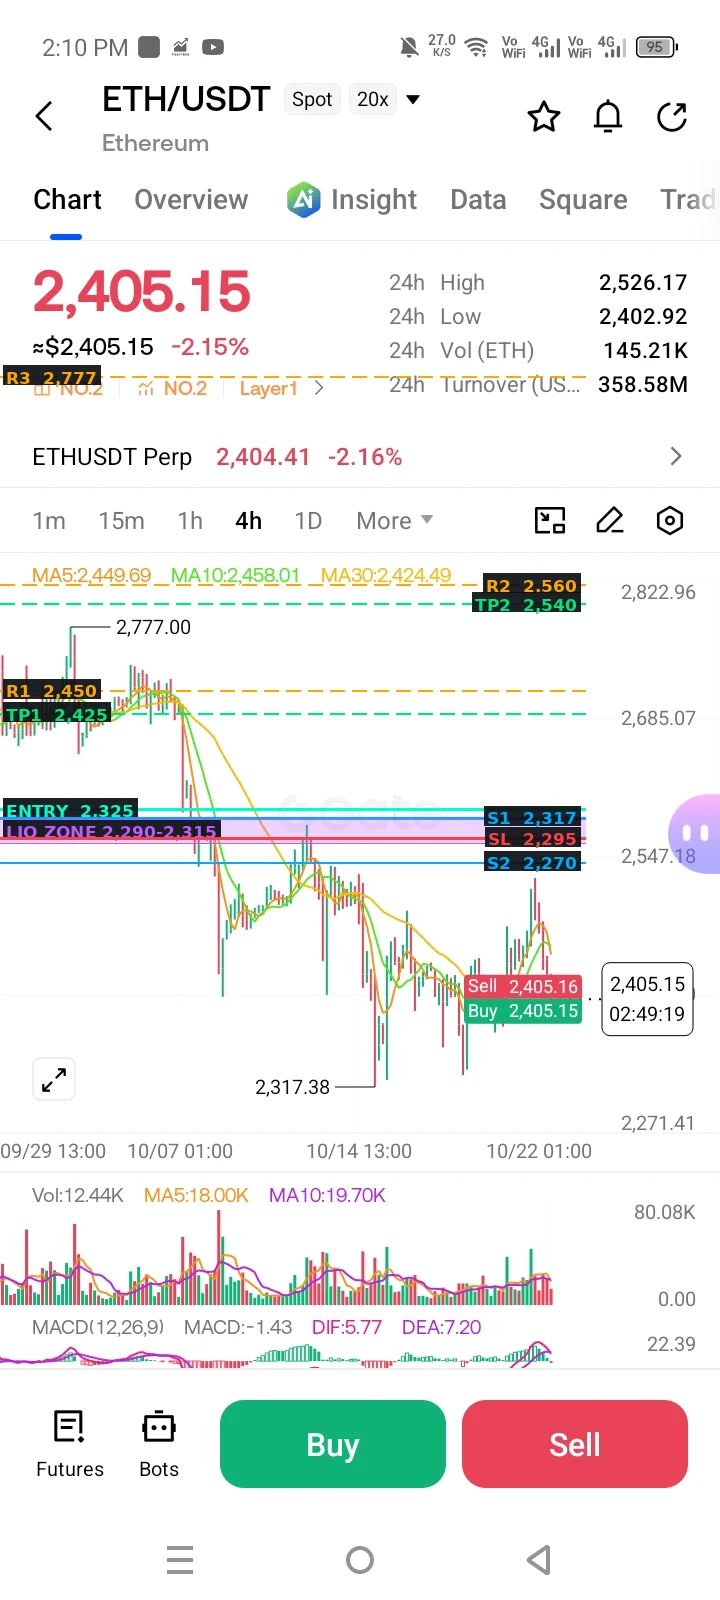
Intraday, Ethereum rebounded from a low of 2368, came under pressure and pulled back after rising to around 2482, and is currently fluctuating around 2470.

From the current market structure: On the 4-hour chart, the price rebounded from the lows but encountered resistance near the upper Bollinger Band. Short-term rebound momentum is beginning to slow, the resistance zone above is clear, and the room for a rebound is limited.
On the hourly chart, after a continuous rebound, the price surged and closed with a pressure candle, while bullish momentum weakened. The 2480 area is strong short-term
post-image
ETH+2.07%
After $LIT surged to 4.724, I instead took 70% off first. It’s not that I’m bearish; this level is right at the key prior-high resistance, so chasing further offers a worse risk-reward ratio. The move up from 4.361 formed a breakout-pullback-breakout structure, with each pullback holding at a higher key level and volume expanding on the breakouts.

The key levels are clear now: the prior high is the first key level. If, after the breakout, price pulls back on lower volume and holds the upper boundary, that would be the new entry setup; if it only pushes up and then falls back, it could be a f
post-image
LIT+2.49%
BTC+1.03%
ETH+2.07%
Many people blindly chase longs when they see a bullish moving-average alignment, ignoring that the indicator has already entered overbought territory—this is the most typical mistake of chasing highs with the trend. Take $SOXLB
as an example: the current price is 114.88, MA5=114.876 has crossed above MA20=110.689, and the medium-term structure is indeed bullish; however, RSI=71.8 has entered overbought territory, while the price is also approaching the Bollinger upper band at 117.691, so the risk-reward of chasing longs in the short term is not attractive. The MACD histogram at +0.3849 still
post-image
PEPE+7.24%
HEI-7.53%
September AI Multi-Front Surge: 3 Trillion Parameters Shake Up the Scene, While Coding and Agent Capabilities Take Center Stage
In mid-September, the AI industry entered a rare period of “multi-front surges.” The previously orderly pace of model iteration was disrupted, replaced by major players unveiling their capabilities in rapid succession across parameter scale, context length, and agent capabilities. The core of this round of competition is no longer merely a breakthrough in any single performance metric, but a broad push into complex scenarios such as long-horizon tasks, code generati
There you go @wolfswapwolfies 😄
post-image
BTC ETH and Altcoins
live-cover
LIVE1,161
$XRP
Bouncing from 1.2480, now coiling under 1.4920. Price is holding above all three MAs—momentum shifting bullishly after a sharp recovery. Break above 1.3202 triggers continuation; rejection retests 1.2934. Watching for a clean close to confirm the push.
Entry Zone: 1.300 – 1.305
TP1: 1.320
TP2: 1.370
TP3: 1.492
Stop-Loss: 1.270
#XRP #ShareWeekly #GateTopsStockPerpetualCoverage #GateTrenchesExclusive0GasTrading #ArcEcosystemAndMemeCoinsPlunge
post-image
XRP+0.45%
  • 3
  • 1
To be honest, I’m surprised this trade has survived until now. Luck played a significant part.
A few days ago, the afternoon session had yet to start, $HOLO fell just short every time it pushed higher, and volume failed to follow through, so I flagged a bullish view and opened a short around 0.06137. The structure was good enough.
I just checked the market: 0.05647, +376.66%. It was truly sluggish at first, but the result feels great.
The market is waited out, and profits are held onto. Staying out of the market isn’t a sin; opening positions recklessly is the mistake.
Close 80% first, and pr
post-image
HOLO+4.08%
ZEC+9.17%
BNB+1.76%
Gate First Launch: $BONER
🔹 Trading Pair: $BONER / $USDT
🔹 Trading Time: September 16, 20:30 (UTC+8)
🔹 0-Fee Instant Swap Start Time: September 16, 21:30 (UTC+8)
Trade Now: https://www.gate.com/zh/trade/BONER_USDT
Go to Instant Swap: https://www.gate.com/zh/convert/USDT/BONER
Learn More: https://www.gate.com/announcements/article/101783
post-image
BONER+35.89%
Load More

Join 40 M users in our growing community

⚡️ Join 40 M users in the crypto craze discussion

💬 Engage with your favorite top creators

👍 See what interests you

Trending Topics

GateTopsStockPerpetualCoverage

36.07k Views1.82k Discussing

According to the latest DefiLlama report, Gate has listed 385 stock-related perpetual contracts, ranking first in coverage; average daily volume is about $1.15B and average open interest about $738M, both ranking third in the industry; liquidity depth for its five highest-volume contracts — SNDK, SKHYNIX, SPCX, SOXL, and MU — ranks first across the board. How do you view Gate leading in both coverage breadth and liquidity depth? [👉 Full Report](ttps://defillama.com/research/spotlight/deep-enough-trade-gate-case-tokens-stocks)

GateTrenchesExclusive0GasTrading

46.23k Views845 Discussing

FedHikes25bpsForFirstTimeIn3Years

32.5k Views8.32k Discussing

View More