Share crypto content and earn up to 60% commissions through content mining.
placeholder
gatefun
2:00
The auction finished faster than the job it sold.
TATKAL. Only on Monad.
Shipping today at @monad Blitz New Delhi V4, Noida.
@geeky_kartikey @monad_dev
AUCTION-1.78%
MON1.65%
post-image
  • Reward
  • Comment
  • Repost
  • Share
GM friends, the crypto market is ready for a massive move💥🚀🌛!
What #100x #Altcoin 💎 is a must buy these days?
Shill me yours below 👇👇
post-image
  • Reward
  • Comment
  • Repost
  • Share
#ENASurgesOver15%InADay
ENA continues to hold the gains that followed the tokenomics overhaul. The Ethena Foundation ended monthly VC unlocks and proposed that 95 percent of protocol revenue be directed to buybacks. The market responded with a more than 15 percent rally that took price to the 0.17 area, and the daily chart is now consolidating those gains.
Price is currently sitting at 0.15994 after a mild 1.45 percent pullback. The 9-period MA rests at 0.15526 and the 50-period MA is much lower at 0.09862. Bollinger Bands stretch from 0.05022 on the downside to 0.18730 on the upside, with th
ENA-3.01%
post-image
post-image
post-image
  • Reward
  • Comment
  • Repost
  • Share
Life is truly hard.
When you’re young, you wake up early to study.
When you grow up, you wake up early to work.
After getting married, you wake up early to take care of the kids.
When you’re old, you wake up early to collect recyclables.
View Original
post-image
  • Reward
  • Comment
  • Repost
  • Share
#Gate7DayNetInflowsTop3
Gate’s 7-Day Net Inflows: A Capital-Flow Signal Worth Watching
Gate is currently ranked among the Top 3 centralized exchanges by seven-day net inflows, putting the platform in focus as crypto-market liquidity continues to shift.
The important point is not simply the ranking. Net inflow measures the amount of capital entering an exchange relative to capital leaving it, making the metric useful for tracking where trading liquidity is concentrating.
A Top-3 position therefore suggests that Gate has attracted substantial net capital during the measured seven-day period. Fo
BTC-2.65%
post-image
Falcon_Official
$BTC $ETH #Gate7DayNetInflowsTop3
$201M+ in Seven-Day Inflows: What Is Gate’s Rising Trading Activity Saying About the Market?
Capital flow is becoming one of the more interesting signals in the current crypto recovery. Gate recorded more than $201 million in net inflows over the past seven days, placing it among the top three centralized exchanges globally by the cited flow data. At the same time, Gate’s spot and futures activity reached global top-three rankings across several BTC and ETH trading metrics during the recent rally. This matters because exchange inflows are not simply a popularity statistic: sustained capital movement toward a trading venue can indicate that participants are preparing for more active positioning, hedging and rotation as volatility expands.
The timing is particularly interesting because Bitcoin is now trading around $79,929, while Ethereum is around $2,494 based on the levels provided. Independent market data also shows BTC holding close to the $80,000 area, with major exchanges recording elevated spot activity. Recent data placed Gate’s BTC spot volume above $1.1 billion over 24 hours, highlighting how quickly trading activity can expand when the market approaches major psychological levels.
For BTC, the $80,000 level is the immediate battlefield. Bitcoin recently pushed above $80,000 for the first time since May, supported by a combination of improving liquidity expectations, softer-dollar dynamics and renewed demand for digital assets. At approximately $79,929, BTC is sitting almost directly beneath that psychological threshold. A decisive breakout above $80,000 followed by sustained volume would strengthen the argument that the recent recovery is developing into a broader trend rather than simply another short-term bounce.
The opposite scenario deserves equal attention. If BTC repeatedly fails around $80,000 and trading volume begins to fade, short-term traders could lock in profits. In that situation, the $78,000–$79,000 region becomes an important area to defend, followed by the broader $75,000–$76,000 zone. The key is not simply whether Bitcoin touches $80,000, but whether buyers can maintain control after the breakout.
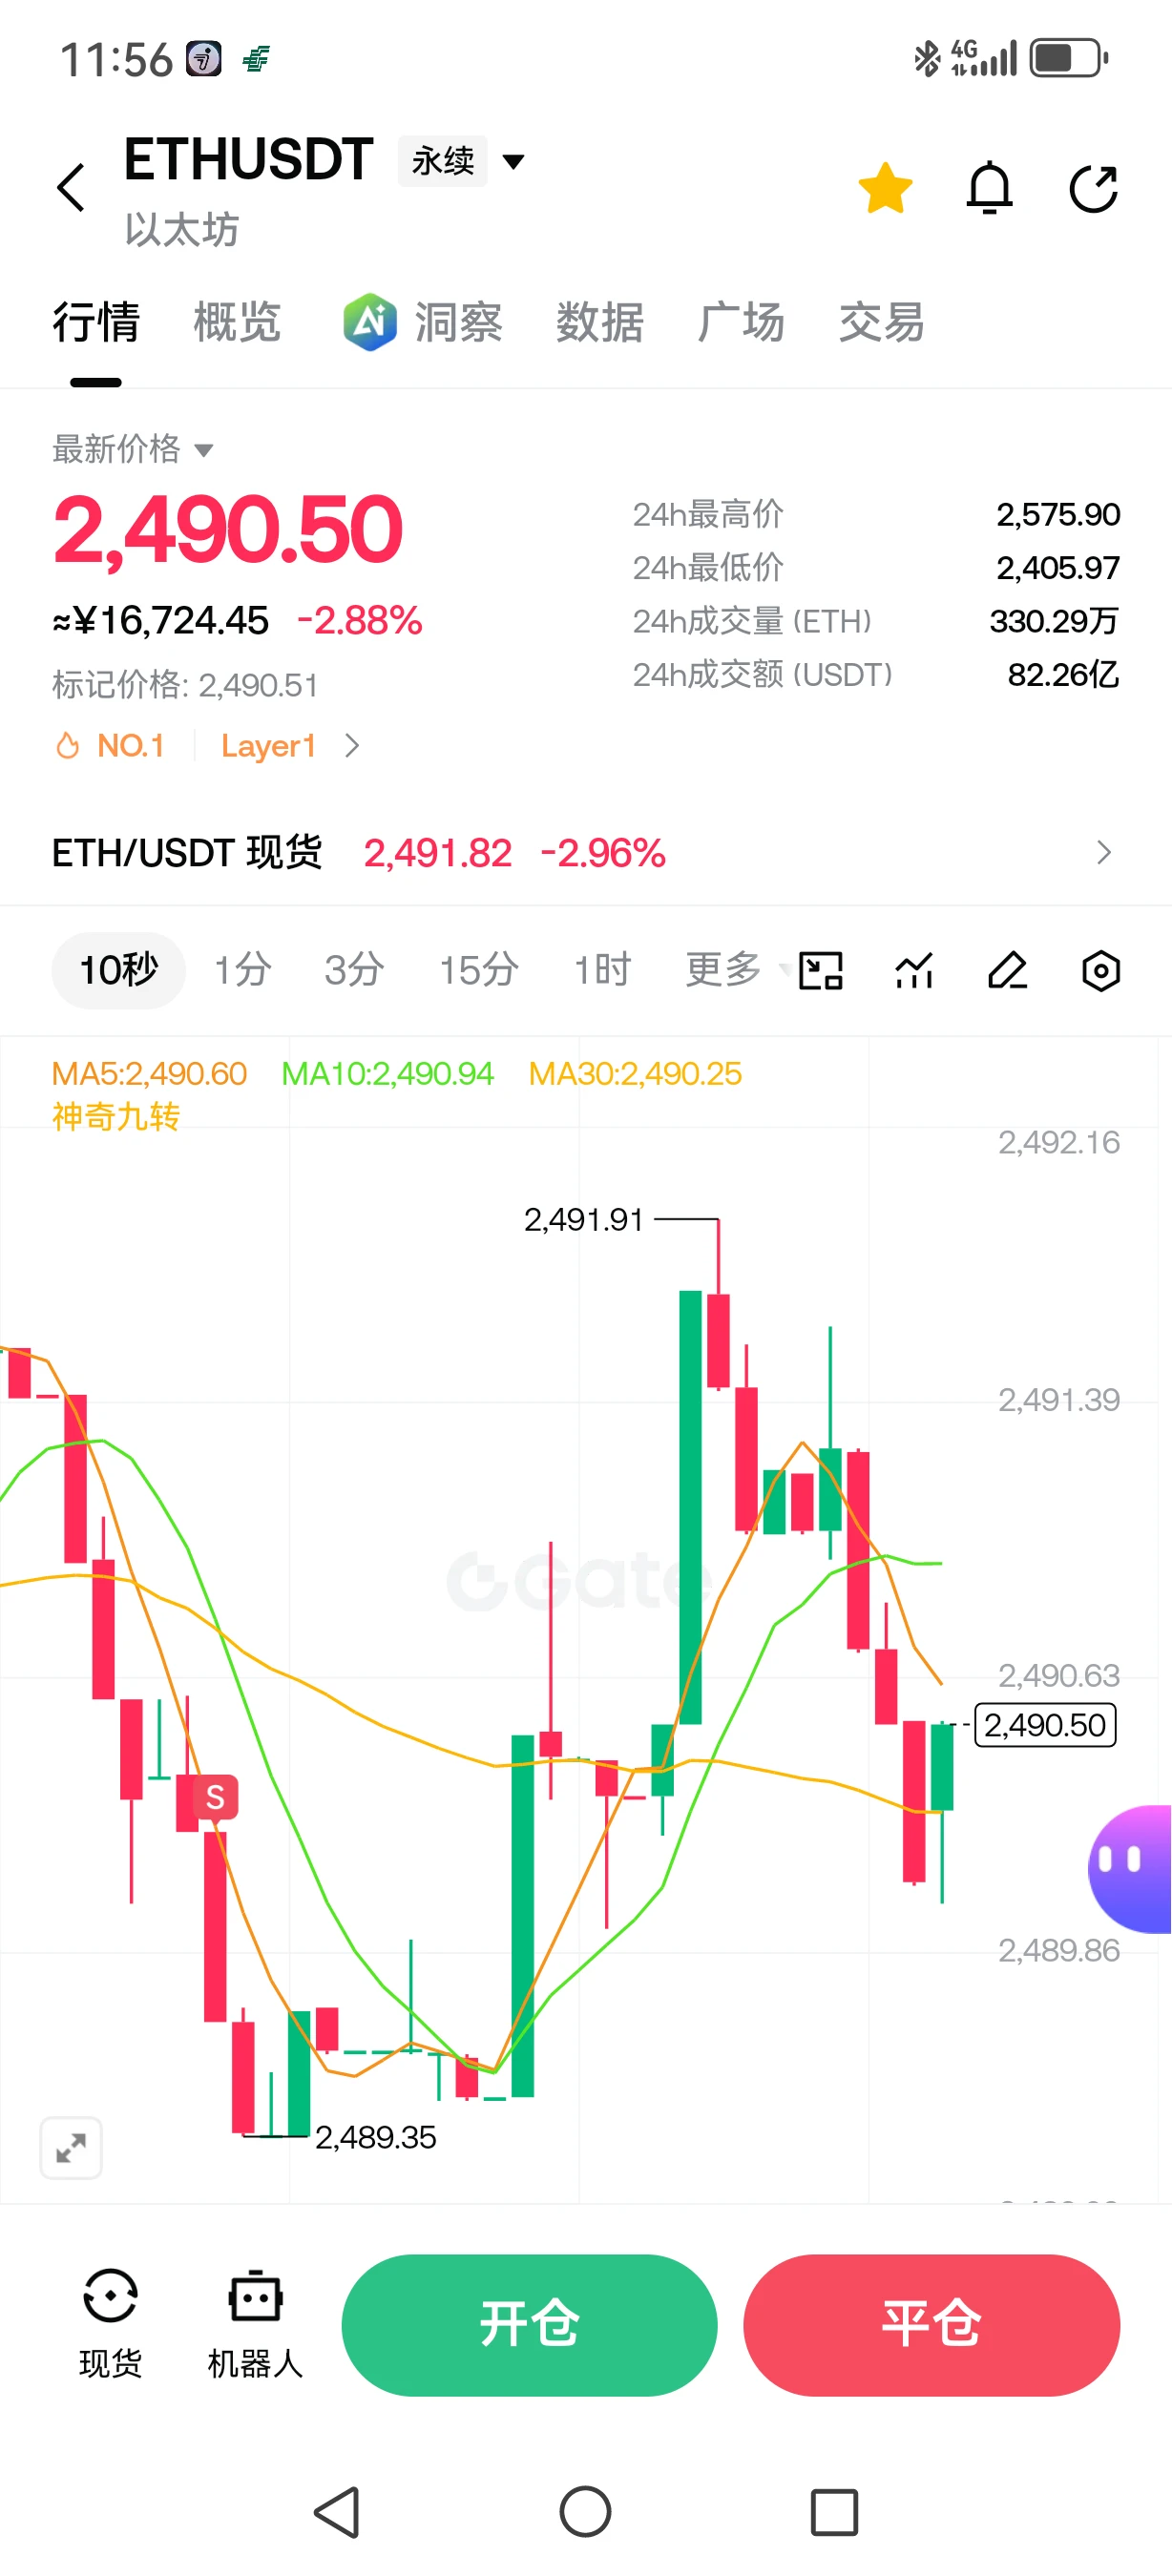
Ethereum presents a slightly different setup. At approximately $2,494, ETH is testing the psychologically important $2,500 area. Recent market data shows Ethereum participating strongly in the broader recovery, with ETH spot activity remaining substantial and seven-day performance still significantly positive. A sustained move above $2,500 could improve momentum and bring the next psychological zones into focus, while rejection could send ETH back toward the $2,400–$2,450 area.
This is where Gate’s reported inflows become more interesting.
When BTC approaches $80,000 and ETH approaches $2,500 at the same time that an exchange is seeing more than $201 million in seven-day net inflows, the market is effectively entering a higher-participation phase. Traders are not necessarily making the same bet; some may be buying spot, others may be using futures to hedge, and others may simply be positioning around the next volatility expansion. That distinction matters because higher trading activity can amplify moves in both directions.
The recent volume data reinforces that point. Bitcoin spot trading across major centralized exchanges recently reached approximately $8.7 billion in 24-hour volume, while Ethereum spot volume was around $6.2 billion. Gate accounted for a meaningful share of that activity, with BTC spot volume above $1 billion in the cited data.
So I would not interpret the $201M+ net inflow figure as an automatic bullish signal for BTC or ETH. The more useful interpretation is that liquidity and participation are increasing at a time when both assets are testing important technical levels.
The market structure can be simplified into four checkpoints:
BTC $80,000: breakout confirmation zone.
BTC $78,000–$79,000: first support area if the breakout fails.
ETH $2,500: immediate psychological resistance.
ETH $2,400–$2,450: key short-term support region.
If BTC holds above $80,000 with expanding volume while ETH establishes $2,500 as support, the combination of stronger exchange activity and improving market liquidity could provide a constructive backdrop for the next leg higher. If both assets reject those levels and volume contracts, the market may simply be digesting the recent rally.
My takeaway is therefore less about “where is the money going?” and more about “what is that money preparing for?”
More than $201 million of seven-day net inflows, top-three exchange activity and rising BTC/ETH participation suggest that traders are becoming more active. But capital flow becomes truly meaningful when it is confirmed by price, volume and sustained breakouts.
Right now, BTC around $79,929 and ETH around $2,494 are both sitting directly beside major psychological levels. That makes the next move more important than the last one.
The liquidity is arriving.
Now the market has to prove whether that liquidity is preparing for a breakout or simply preparing for bigger volatility. @Gate_Square
#GateStockInsightsChallenge
repost-content-media
  • Reward
  • Comment
  • Repost
  • Share
🐋 WHALE WATCH : The ultimate plot twist taxing the exact hardware powering the AI boom. Per Politico the administration is considering sweeping semiconductor tariffs extending beyond chips to servers laptops and gaming consoles.
We already have a 25% duty on certain AI chips with 100% floats on the table. You cant run an AI arms race if you double the price of the servers. Something has to give.
post-image
  • Reward
  • Comment
  • Repost
  • Share
#HYPEContinuesToHitAll-TimeHighs 🚨 HYPE Momentum Check: Buyers Still Watching Closely
$HYPE remains one of the strongest narratives in the market, but the latest move is showing both strength and caution.
📊 Market Snapshot
• Price: ~$81–82
• Recent ATH: ~$86.7
• Market Cap: ~$18B+
• 24H Volume: ~$1.3B
• Short-term trend: Bullish, but volatility elevated
The bigger picture is interesting: HYPE recently pushed into record territory while trading activity and open interest remained strong.
At the same time, today’s scheduled token unlock creates an additional supply-side variable. Around 14.2M
HYPE-2.34%
post-image
  • Reward
  • Comment
  • Repost
  • Share
I haven’t posted much over the past two weeks, and X gave me 88u. That’s a very auspicious number and has motivated me to start posting again!
View Original
post-image
  • Reward
  • Comment
  • Repost
  • Share
Market prediction
gate liveLIVE
1,576
  • Reward
  • Comment
  • Repost
  • Share
I originally wanted to cut my losses to sacrifice to the heavens, but the sacrifice never happened—the meat cooked itself 🍖
A few days ago, the afternoon session saw a low-volume rebound, with pitifully little trading volume. I stared at the candlestick chart for two hours, and the more I looked, the more something felt off. This kind of volume simply couldn't support the price; it reeked of a bull trap, with clear resistance above, and every upward push fell just short. I concluded then that this wasn't a place to chase longs, so I placed a short order at 0.004915. Some people even laughed a
ETH-2.41%
SNDK2.48%
View Original
post-image
  • Reward
  • Comment
  • Repost
  • Share
JUST IN: Serenity questions AI lab valuations, arguing a $2T Anthropic IPO could imply a 10% market cap of $200B—enough to acquire multiple established consumer brands. If true, this speaks to a potential mispricing vs real-world assets. $ANTHROPIC (ticker if relevant)
post-image
  • Reward
  • Comment
  • Repost
  • Share
Crypto Market Sentiment: Bulls vs Bears
gate liveLIVE
756
live-coin
  • Reward
  • Comment
  • Repost
  • Share
A few days ago I was still calculating whether I had enough money for instant noodles this month; this morning I was already wondering whether to add sausage. 🍜 The orders I placed before bed a few days ago were still sitting there while the chart was entirely red. My only judgment at the time was that volume hadn’t followed through, the rebound lacked strength, and any move up would just be giving the main players more fuel. 💸 Now at 4467.26, sliding steadily down from 4510.00, with 80% banked—feels great, brothers, this round wasn’t endured in vain. 🤤 Position management: close 70% first,
SOL-2.77%
ZEC0.60%
View Original
post-image
  • Reward
  • Comment
  • Repost
  • Share
This is how to start the day
post-image
  • Reward
  • Comment
  • Repost
  • Share
US federal debt as a share of GDP is at its highest since January 2021, at 122.6%.
That is 5 years.
Source: Federal Reserve Economic Data.
  • Reward
  • Comment
  • Repost
  • Share
Fresh demand stepped in aggressively for creditcoin-2:native after the recent dip, producing a convincing rebound. Buyers are back in control, momentum is rebuilding, and the setup looks increasingly ready for another push. Perpetual-sector strength from dydx-chain:native could provide an important signal as traders return to higher-beta opportunities.
CTC-0.98%
DYDX-3.40%
post-image
  • Reward
  • Comment
  • Repost
  • Share
The downside liquidity does not seem to have been fully cleared, and the rebound is relatively weak. No demand surge has been seen for now, so the price may move lower. Give up on bottom-fishing for now and wait on the sidelines until new demand emerges.
Support: 76500-77000. Once this support breaks, the price could fall directly to 73500 or even lower.
The strong support above remains at 81000.
View Original
post-image
  • Reward
  • Comment
  • Repost
  • Share
Current game progress: Bottom of the 3rd inning, the score remains 0‑0, with neither side having scored.
The two win probability curves were highly intertwined and volatile in the early stages, with the market’s pregame expectations for both sides very close, indicating an evenly matched game.
Near the current moment, the curves have clearly diverged upward, with the Cardinals’ win probability pulling ahead as market funds begin to favor the home team.
View Original
post-image
  • Reward
  • Comment
  • Repost
  • Share
I plan on buying more JASMY in the next few days to weeks.
Why ? Because bitcoin has come back to its 50 weekly moving average that has always provided a bit of resistance, with that in mind i would also see JASMY pull back a little without setting a new low.
When i say pullback on bitcoin I’m thinking between $73k - $66k . When this happens I’m sure everyone will be calling the recent rally “a bull trap”
JASMY-8.52%
BTC-2.65%
post-image
post-image
  • Reward
  • Comment
  • Repost
  • Share
🔥Free Saturday daytime strategy levels👇
🔥Long entry levels (see the pinned subscription post for the second entry levels, short entry levels, and take-profit levels; both long- and short-term spot setups are also in the pinned post)
===========
76800 long, 76500 long, stop loss 75200
2410 long, 2390 long, stop loss 2340
#Gate7天净流入全球Top3
View Original
post-image
post-image
  • Reward
  • Comment
  • Repost
  • Share
Load More

Join 40 M users in our growing community

⚡️ Join 40 M users in the crypto craze discussion
💬 Engage with your favorite top creators
👍 See what interests you
  • Pinned