Share your thoughts
placeholder
Article
A few days ago, my hand trembled slightly when setting the stop-loss; this morning, I realized that filial piety was unnecessary. A few days ago, while everyone was still watching from the sidelines before bed, $TAO funds quietly entered the market and held firm on the pullback. I judged that the bottoming consolidation was nearing its end.

The guidance at the time was: as long as the key level holds, try going long with a light position, and only consider adding once the rhythm is right—don’t go all in from the start. After opening a long position, the price barely looked back. The market
post-image
TAO-5.25%
ADA-0.90%
BNB-0.80%
Gate Enters the CEX Top 4! How Much Weight Does Its 60 Million Users Carry?
If an exchange surpasses 60 million users and enters the mainstream CEX Top 4, how would you view it?
I believe this at least shows that Gate has gradually grown from a simple trading platform into an important asset and trading gateway for crypto users worldwide.
For CEXs, user scale is extremely important. The more users there are, the richer the trading demand, and the easier it is for product iteration to create a positive feedback loop. Of course, user numbers are not the only metric, but they can reflect a platfo
MEME-2.04%
RWA-1.78%
  • 39
Smart money is accumulating SYMBOL while the 1h RSI whispers oversold.

$WLD /USDT - LONG

Trade Plan:
Entry: 0.4015 – 0.4055
SL: 0.3782
TP1: 0.4225
TP2: 0.4351
TP3: 0.4541

Why this setup?
Why now? The 4h trend is range-bound, but the 15m RSI just hit 30.73, signaling a potential reversal from the daily range. The 1h ATR of 0.008108 shows volatility is compressed, which often precedes a sharp move. The entry zone sits between 0.4015 and 0.4055, offering a precise risk-defined opportunity. Targets are stacked at 0.4225 and 0.4351, but the line in the sand is 0.4101, and breaching it kills t
WLD-3.29%
A few days ago, I was still calculating whether I had enough money for this month’s instant noodles; this morning, I was already wondering whether to add a sausage. 🍜
During the repeated intraday swings, $ACE shrank in volume whenever it was pushed up—there was simply no one buying into the rise. At the time, I judged that selling pressure was strengthening, so I gave a tentative short entry around 0.1847. The stop-loss wasn’t set too far away: cut it if wrong, and let the profits run if right.

It just refreshed once again, and the price has reached 0.159, with +341.2% secured. This profit
post-image
ACE-0.63%
ZEC-8.36%
ADA-0.90%
Insiders are calling this the exact low before a run that could make SYMBOL unstoppable.

$BTC /USDT - LONG

Trade Plan:
Entry: 77145.8 – 77388.4
SL: 76102.6
TP1: 78140.4
TP2: 78722.7
TP3: 79596.0

Why this setup?
Why now? The daily trend is bullish, and the 1h price sits at 77267.1 inside the entry zone between 77145.8 and 77388.4, giving us a defined risk. The 15m RSI at 39.66 shows the dip is still holding, while the 1h ATR of 485.189226 tells us the next leg is likely to be large. TP1 at 78140.4 is the first target, TP2 at 78722.7 is the extension goal, and the invalidation level of 783
BTC-1.07%
I had just switched the software to the background when it suddenly plunged—are you playing hide-and-seek with me? The last time I checked a few days ago, $CYS was at 0.4520, facing heavy resistance above, with clearly insufficient buying support.

My message at the time was simple: bullish, but the rebound was weak—don't become exit liquidity. Those who listened should understand.

Now at 0.1399, with +1358.25% secured, getting the timing right is really that simple. Time to enjoy a good meal.

Take 70% off the table first, and move the protective stop on the remaining 30% to the entry pri
post-image
CYS-3.12%
XRP-2.78%
ZEC-8.36%
Why is $UNI /USDT quietly ignoring a 4h setup that says otherwise?

$UNI /USDT - LONG

Trade Plan:
Entry: 6.019 – 6.077
SL: 5.680
TP1: 6.324
TP2: 6.508
TP3: 6.784

Why this setup?
Why now? The daily trend is bullish, but the 1h ATR of 0.117976 shows volatility is compressed enough for a clean breakout. The 15m RSI at 44.48 signals room to run before overbought, while the entry zone between 6.019 and 6.077 offers a precise risk-defined long. The first target of 6.324 and the second of 6.508 both sit well above that zone, but the invalidation level at 6.240 is the hard line that protects the
UNI-3.18%
Gold is currently in a period of consolidation after the decline, with the market awaiting Friday’s CPI inflation data. The data will directly affect expectations for Federal Reserve policy, and the market will likely experience significant volatility.
From the candlestick structure, the support area below remains fairly resilient. As long as key support holds, there is room for a rebound and recovery, so the strategy is mainly to go long on pullbacks.
Once the price pulls back to the 4300-4320 support range and stabilizes, consider a short-term long position, targeting 4350-4380. If support a
post-image
XAUT-1.70%
Friendship should be like love to warm the heart, and love should be like friendship to be unbreakable.
Why is everyone suddenly quiet about $SOL /USDT right before a massive move?

$SOL /USDT - LONG

Trade Plan:
Entry: 99.03 – 99.53
SL: 96.11
TP1: 101.66
TP2: 103.25
TP3: 105.63

Why this setup?


Debate:
Are we about to blow past TP2 at 103.25 or is 101.95 the trapdoor?

⚠️ Personal market analysis only. NFA — manage risk and DYOR.
Educational content, not investment advice or a recommendation to buy, sell, deposit, or withdraw any asset. No paid promotion or referral/affiliate links.
post-image
SOL-1.45%
By the time I got back from a quick bathroom break, the candlestick chart had already wiped out my losses for me. A few days ago, I checked $JCT before bed. The rebound lacked volume, and every push upward fell just short—this wasn’t a breakout, but a bull trap. The level I gave was around 0.002429, and this was exactly the downward move I was waiting for.

The current price has already dropped to 0.001445, sending my unrealized profit straight to +990.36%. I’ve taken 80% profit off the table, moved the stop-loss on the remaining 20% to breakeven, and will keep holding if it continues to fall
post-image
JCT-1.09%
XRP-2.78%
BNB-0.80%
I only wanted to freeload a breakfast, but the market ended up making me dumplings for half a year. 😂 A few days ago, I was watching the market in the afternoon. $LIT was still moving sideways at the bottom, and since I saw no breakdown, I flagged a small long entry around 3.753, saying to wait for buying pressure to strengthen before following in. Keep the position light and stay calm.

When I checked the market after lunch, the price still hadn't fully taken off, and the pullback had held steady, while many people were still hesitating. Looking at it now, it has already been pushed to 4.5
post-image
LIT+1.33%
ADA-0.90%
DOGE-2.07%
Why is SYMBOL holding 0.4011 like a magnet while the daily trend screams range?

$WLD /USDT - LONG

Trade Plan:
Entry: 0.3991 – 0.4031
SL: 0.3758
TP1: 0.4201
TP2: 0.4327
TP3: 0.4517

Why this setup?
Why now? The 4h structure keeps the 1h price pinned at 0.4011 inside a tight entry zone between 0.3991 and 0.4031, and the 15m RSI at 34.04 shows the short-term sellers are exhausted but not yet capitulated. The 1h ATR of 0.008108 means a single hourly candle can cover the distance to the first target, which sits at 0.4201, while the second target at 0.4327 rewards a move that breaks the range s
WLD-3.29%
SNDK also weakened throughout the day, facing resistance near 1770 after an early rebound and pulling back all the way to around 1674. Our high-level short setup targeting 1690 hit accurately again, securing another 100-point move! It is currently trading in a low-level consolidation!
From the current chart structure, the daily level has entered a pullback after a round of gains, while the price remains above the Bollinger middle band, meaning the larger-cycle bullish structure has not been completely broken; upward momentum is weakening, and the market has entered a high-level pullback phase.
post-image
SNDK-4.00%
Nobody is talking about this quiet LONG setup forming right now.

$WLD /USDT - LONG

Trade Plan:
Entry: 0.4009 – 0.4059
SL: 0.3725
TP1: 0.4266
TP2: 0.4420
TP3: 0.4652

Why this setup?
Why now? The 1h price sits at 0.4034 inside a tight entry zone between 0.4009 and 0.4059, while the 15m RSI reads 25.32 showing extreme oversold pressure that often precedes reversals. The 1h ATR of 0.009905 confirms low volatility compression, which typically explodes into directional moves once the entry zone breaks. With the daily trend locked in range, this LONG bias targets TP1 at 0.4266 and TP2 at 0.4420
WLD-3.29%
$SPCX /USDT is quietly arming for a move most traders will miss.

$SPCX /USDT - SHORT

Trade Plan:
Entry: 147.68 – 148.66
SL: 152.85
TP1: 144.66
TP2: 142.32
TP3: 138.81

Why this setup?
Why now? The daily trend is range-bound, which often precedes a sharp directional break when volatility expands. The 1h price sits at 148.17, right at the entry reference where the setup is armed. The 15m RSI of 46.26 shows neither overbought nor oversold, leaving room for a clean slide toward the first target at 144.66. The 1h ATR of 1.949855 confirms enough hourly volatility to reach the second target at 1
post-image
SPCX+0.97%
Insiders are watching $ETH /USDT like a hawk right now

$ETH /USDT - LONG

Trade Plan:
Entry: 2453.98 – 2465.20
SL: 2405.75
TP1: 2499.97
TP2: 2526.89
TP3: 2567.27

Why this setup?
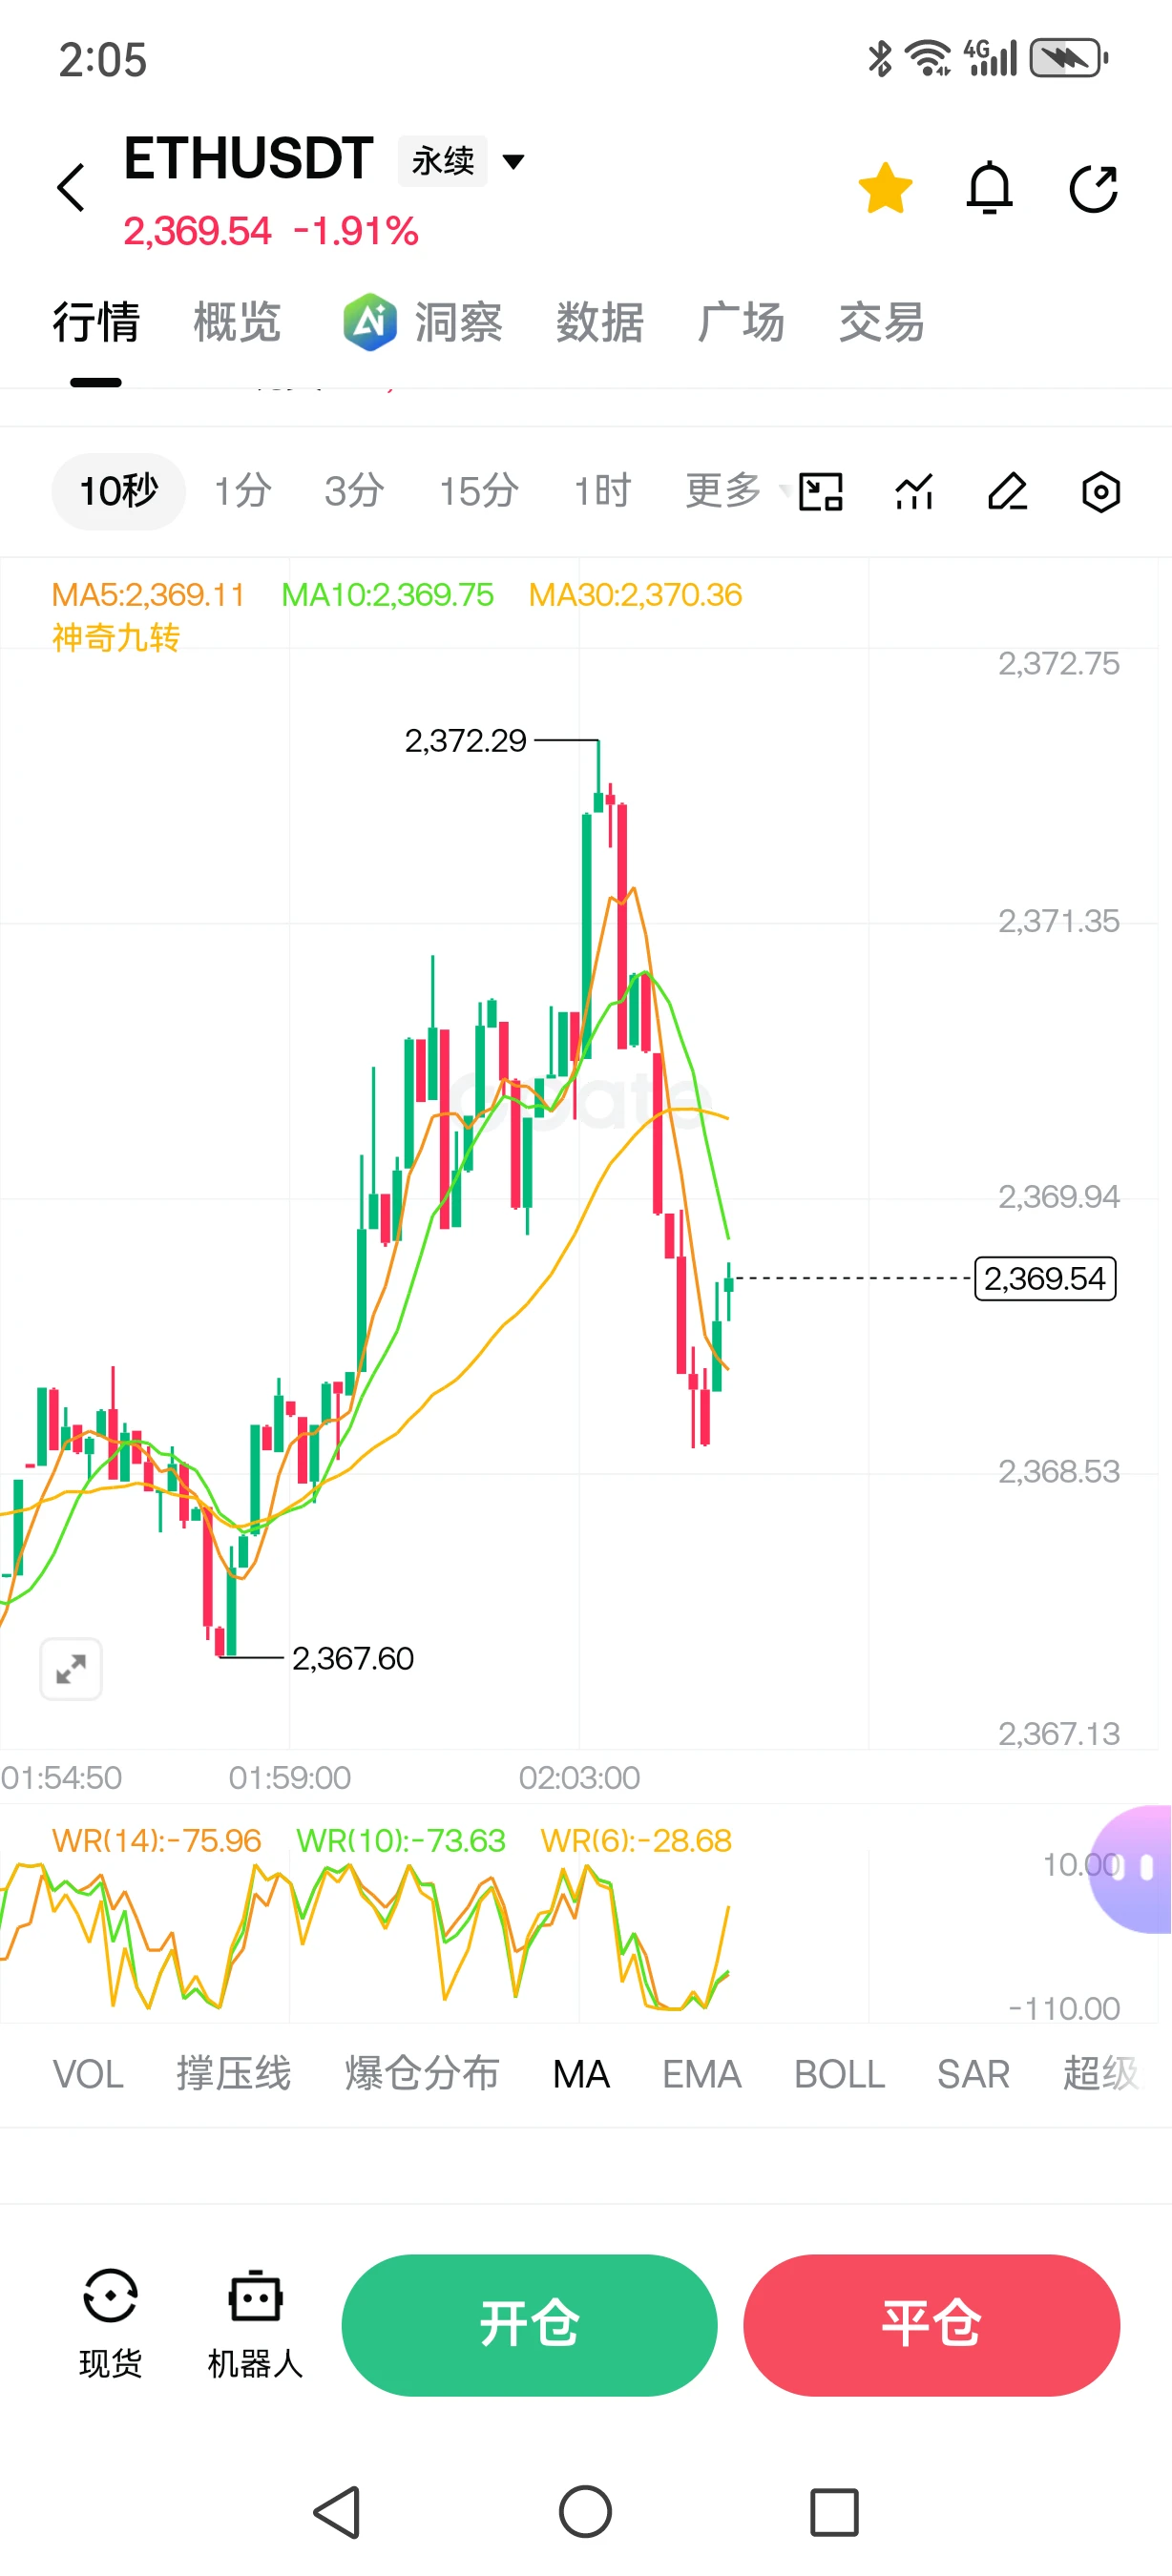
Why now? The daily trend is bullish and the 1h ATR of 22.43 signals explosive momentum is building. The 15m RSI at 45.04 shows room to run before overbought exhaustion. The entry zone sits between 2453.98 and 2465.20, giving precise risk control. TP1 at 2499.97 and TP2 at 2526.89 define the upside targets, while the invalidation level of 2454.93 acts as the hard line in the sand that protects the position.

Debat
ETH+0.19%
$$RVN erased a quarter of its market cap in one day. This isn't a crash; it's the market maker paying the shorts.
Look at the data: it fell 24.67% in 24 hours, with the price slammed from 0.0031 to 0.0022, now closing at 0.0023, while trading volume reached 21.9M. When retail traders see this big bearish candle, their first reaction is to cut losses and run. But let me tell you, for an old mining coin like RVN, a drop like this is when it is at its most attractive. Why? It has a large circulating supply, long-standing consensus, and no VC unlocks dumping on the market. A 24% drop has occurred
RVN-21.78%
Layout for Bitcoin, Ethereum, and Dogecoin
live-cover
LIVE1,432
Load More

Join 40 M users in our growing community

⚡️ Join 40 M users in the crypto craze discussion

💬 Engage with your favorite top creators

👍 See what interests you