Square
Following
Hot
News
Profile
Share your thoughts
placeholder
Article
Profit taking stays light against past cycles. Weekly Net Realized Profit/Loss, the net dollar gain locked in when coins change hands, runs well below the average week at the 2024 and 2025 tops. Its pace in this rally, the right-hand band on the chart, is close to the start of the last uptrend in late 2023, the left-hand band.
The sellers have changed, though. Long-term holders, who have held their coins for more than 155 days, nearly doubled their realized profit in the week to September 29 against the week of the breakout, and their share of all realized profit rose from 34% to 55%. Should w
post-image
  • 1
  • 2
crypto market update
live-cover
LIVE49
if you need someone to blame today, please direct your ire to @DejaBrewTrades and his devil magic pivots.
post-image
This isn't a rebound—it's CPR for my short-position account, isn't it? While everyone else was running, $ZEC pulled up once and then weakened, volume failed to follow, and the bull-trap flavor was strong. I shared the short thesis around 1441.41. Pressure at highs is still pressure at highs; every surge falls just short. If you don't short this structure, what are you waiting for?

The market slid from 1441.41 to 1183.89, putting +1268.91% straight in my pocket. Nailed it.

The market exists to cure all kinds of defiance, especially in those who think they're the smartest.

Close 80% first
post-image
ZEC-9.80%
DOGE-4.58%
BNB-4.48%
#CFTCProposesNew���CryptoAssetMarket”Category
CFTC’S NEW CRYPTO FRAMEWORK: THE REGULATORY SHIFT THAT COULD RESHAPE INSTITUTIONAL CRYPTO ADOPTION
The U.S. Commodity Futures Trading Commission (CFTC) is considering a new regulatory category known as the Crypto Asset Market (CAM). If implemented effectively, this proposal could represent another important step toward a more structured and institutionally accessible crypto market.
But the real question is not whether this headline will trigger an immediate Bitcoin rally. The bigger question is whether clearer rules can strengthen the foundations
BTC-1.74%
ETH-3.34%
Bitcoin's bottom range has been supported since the breakout on September 21, then failed again near 87k. Now let's see whether there is some relief... If this can hold, we will once again see some decent conditions. Is this a good rebound/recovery zone...? An accumulation range?? The best buying opportunity??$BT
post-image
BTC-1.74%
Bitcoin’s failed breakout reveals thin volume and easy profits
Bitcoin has dropped nearly 5% this week as weak trading volume and profit-taking undermined attempts to reclaim $85,000.
The largest cryptocurrency traded around $83,100 as of press time, extending a retreat that followed Sunday’s brief close above the key level. Bitcoin has since failed to sustain that breakout, slipping beneath newly placed sell orders before buyers around $85,000 also gave way.
⚠️ Personal market analysis only. NFA — manage risk and DYOR.
Educational content, not investment advice or a recommendation to buy, sel
post-image
BTC-1.74%
BREAKING 🚨Standard Chartered to debut digital‑asset custody service in Singapore for institutions 🏦.The platform will support major cryptocurrencies, stablecoins, and tokenized real‑world assets, targeting banks, hedge funds and asset managers ⚡. Launch slated for Q4 2024, positioning Singapore as a regional hub for regulated crypto services. The move signals growing institutional demand for secure custody solutions.Stay tuned for updates 📢.$OG , $RLC , $OGN
post-image
OG-3.65%
RLC+28.22%
OGN+113.04%
crypto market update
live-cover
LIVE87
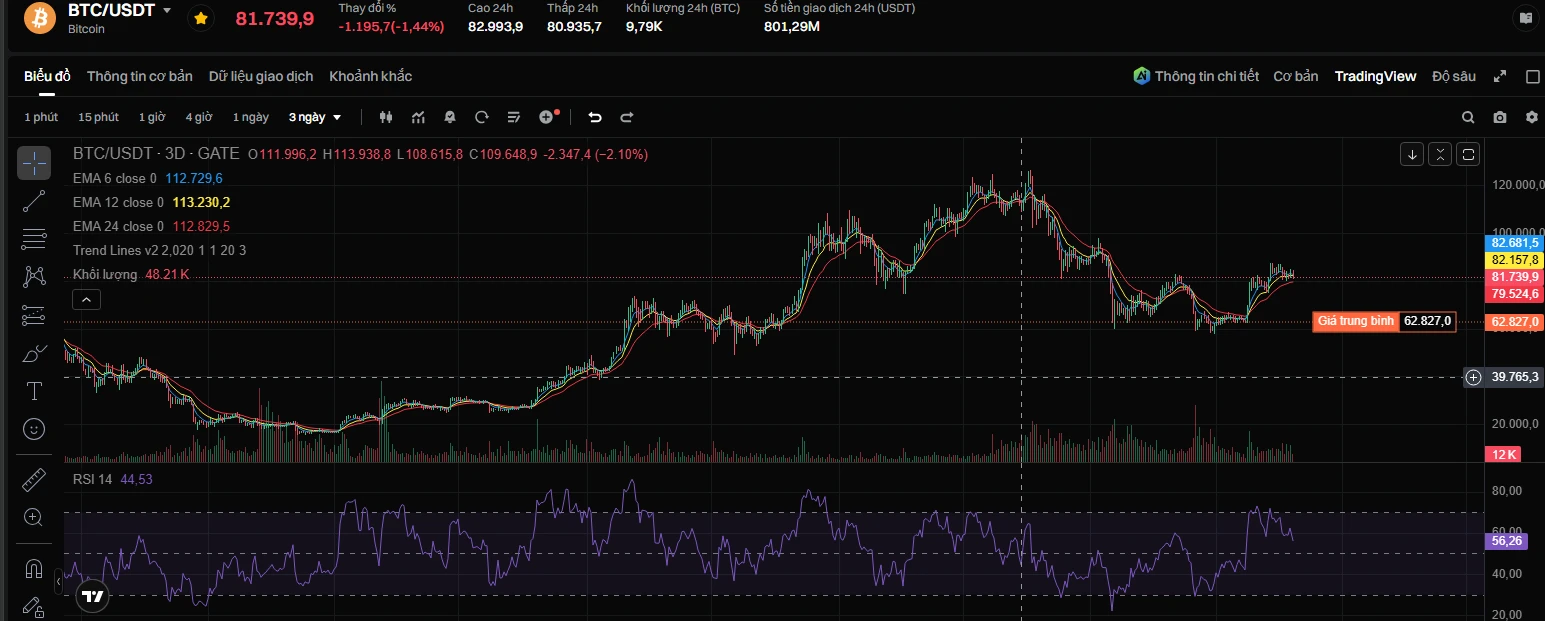
$BTC Where is the capital taking a side? The answer is: bears are applying pressure in plain sight, but the funding rate has exposed the overcrowding of short positions.
Current price: 81781.9, down 1.91% over 24h. MA5=81355.4 has crossed below MA20=82324, the MACD histogram at -29.11 remains bearish, and RSI=41.0 is weak but has not reached oversold territory. The lower Bollinger Band at 80836.6 is the first support level ahead. The key factor is the funding rate of -0.0001%—the price is falling while the rate is negative, meaning short positions need to pay longs, which is a typical signal
post-image
BTC-1.74%
TAO-6.18%
I had just switched the app to the background, and it suddenly shot up—are you playing hide-and-seek with me? When I checked the chart after lunch, $DOS was still pretending to be dead, but buying pressure was strengthening and the pullback couldn’t push it down. I judged that there was support underneath. Before the market fully took off, I suggested gradually adding to long positions—don’t wait until a big bullish candle appears to regret it. Now it has moved from 0.2278 to 0.229, +5.22%; it was truly sluggish at first, but the breakout feels really good.

Being out of the market isn’t a s
post-image
DOS+1.42%
ADA-7.69%
BNB-4.48%
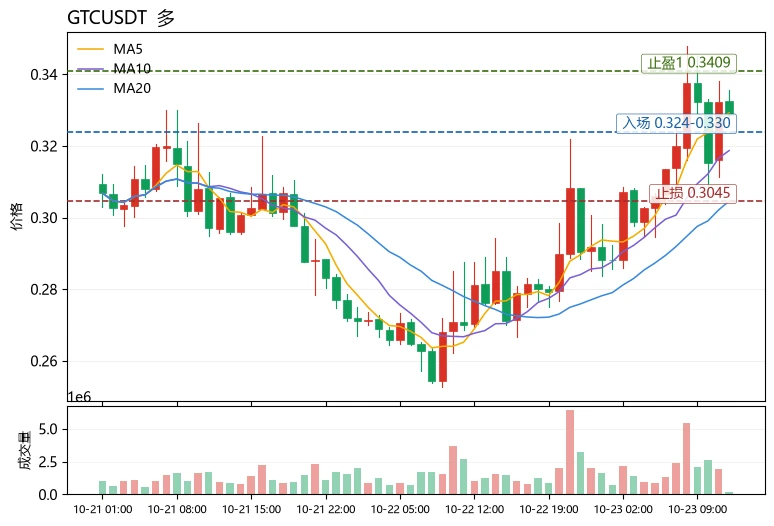
$SKL Current price: 0.00533. The first resistance above is the Bollinger upper band at 0.00547, while the first support below is MA5 at 0.00512; if that level is lost, watch MA20 at 0.00473.
The bias is bullish, but this is a trend-following trade in a high-volatility environment, not a bottom-fishing trade. Reasons: MA5>MA20 shows a bullish alignment, the MACD histogram is positive, RSI at 62.8 has not yet entered the overbought zone, and the trend structure remains intact; however, the amplitude over 30 candles is close to 29.6%, volatility is extremely high, and the Fear and Greed Index at
post-image
SKL+16.68%
ZEC-9.83%
ADA-7.61%
I didn’t do anything—just went to make a cup of tea, and when I came back, the candlestick chart had already done the work for me. The last thing I saw before bed was $MET , with the price still hovering around 0.4289 and moving sideways at the bottom. I saw buying pressure strengthening and funds quietly entering, so I placed a long order in advance. I didn’t make a huge fuss, just added one line: bullish—any pullback is an opportunity.

When I opened the market this morning, it had already touched 0.439, with +25.68% quietly sitting there. It was truly sluggish before, but the breakout feels
post-image
MET-3.87%
SOL-4.52%
XRP-2.47%
$WLD has already entered oversold territory, but “it’s due for a rebound” and “it has bottomed out” are completely different things.
This time, I’m not looking at the gainers and losers list—only the price levels. The current price is 0.4803, about 4.43% away from the 1-hour support at 0.459 and about 11.16% away from the resistance at 0.5339.
My criteria are simple: only a breakout above 0.5339 followed by continuation would count as follow-through higher; a break below 0.459 invalidates the previous view. The 1-hour and 4-hour trends are both weak, with RSI at 29 and 22, respectively.
The q
post-image
WLD-6.25%
A, b, c.
1, 2, 3.
Alts look ready to absolutely rip against BTC, and in a way that can spark another huge alt season.
The timeframe is IMMINENT!
Stay patient, looking like the last stretches here before the run 🏃‍♂️...
#Altcoins
post-image
BTC-1.74%
Bullish Cross for the TOTAL #Crypto cap!
post-image
The U.S. Treasury completed a $6 billion buyback of long-term government bonds on Thursday, accepting the maximum amount it had announced for the operation. The purchase covered securities with 20 to 30 years remaining to maturity, and the Treasury received approximately $14.9 billion in offers from dealers, more than double the amount it ultimately accepted. The operation was part of the Treasury's liquidity support buyback program, which was expanded in August to a maximum of $6 billion per operation, up from the previous $2 billion limit.
The mechanics of the program are straightforward. Th
post-image
MU-4.83%
NVDA-2.86%
SNDK-4.91%
AMD-3.88%
INTC-5.22%
  • 14
  • 4
Which AI cryptocurrency will lead the AI crypto narrative?‣ $TA
‣ $NEA
‣ $IC
‣ VVV‣ RENDER‣ FIL‣ INJ‣ FET
post-image
TA-3.70%
VVV-8.51%
RENDER-8.47%
FIL+3.74%
$OGN The more it rises, the more people fear missing out, but what is truly lacking at the top is not hype—it is support when the price pulls back.
This time, I’m not looking at the gainers and losers list, only the levels. The current price is 0.0501, about 55.23% above the 1-hour support at 0.02243 and about 5.53% below the resistance at 0.05287.
My criteria are simple: only a breakout above 0.05287 with continuation would count as a handoff to higher levels; a break below 0.02243 invalidates the previous view. The 1-hour and 4-hour trends are both strong, with RSI at 86 and 92, respectively
post-image
OGN+113.04%
$TIA Breakout imminent! Technical indicators have all formed golden crosses—are you on board? Where is the next target?#Gate.io 🔥🚀 #每周来晒
TIA+13.98%
Load More

Join 40 M users in our growing community

⚡️ Join 40 M users in the crypto craze discussion

💬 Engage with your favorite top creators

👍 See what interests you

Trending Topics

Gate Money Officially Launches

3.44k Views12.86k Discussing

Gate officially launches Gate Money, a global integrated financial services app that brings digital assets, fiat, stocks, ETFs, gold, bank accounts, and payments into one Gate App. Users can manage assets, invest, send and receive funds, convert currencies, and make payments — all from a single account. Which use case are you most excited about? [👉 Learn more](https://www.gate.com/announcements/article/102094)

Fed September Minutes Lean Hawkish

64.13k Views2.72k Discussing

Samsung Q3 Operating Profit Surges 782.5%

36.83k Views1.93k Discussing

View More