Share your thoughts
placeholder
Article
The Pitfalls I Encountered on Gate—A Newcomer’s Guide to Avoiding Traps
After one month, I’ve encountered enough pitfalls on Gate to write a book. Today, I’m sharing a few tips to help newcomers avoid them:
First, don’t jump straight into futures. My experience of being liquidated in 5 minutes is still fresh in my memory. Start with spot trading, and build a solid foundation of basic knowledge first.
Second, don’t go all in on one coin. Diversify your holdings—if one falls, the others can still provide support.
Third, don’t blindly follow the crowd. There’s a lot of information on the feed, so
NVDA+0.87%
【$BULL Signal】Negative funding rate short squeeze + 1H MACD bullish expansion
$BULL Funding rate -0.2048%, shorting costs remain high, yet the price is holding firmly above 0.0501. The bid depth ratio stands at 1.30, with thick bid support completely overwhelming selling pressure. The 1H MACD continues to expand, with no signs of momentum exhaustion, while the 4H Bollinger upper band has fully opened.
🎯Direction: Long
⚡Entry/limit order: 0.04997662 - 0.05012700
🛑Stop-loss: 0.04962573
🚀Target 1: 0.05087890
🚀Target 2: 0.05125486
🛡️Trade management:
Execution strategy: After reaching Target
post-image
BTC-1.95%
ETH-2.55%
SOL-2.06%
The hand that set the stop-loss a few days ago was trembling slightly; this morning I realized that was unnecessary filial piety. The order I placed before bed a few days ago was meant to just break even, but the market gave me the answer directly. With this kind of move, I didn't even need to think—the account was dancing on its own.

The logic was simple at the time: the key level held, and the pullback failed to make a new low—this is the most typical bullish signal. $INTC climbed all the way from 90.88 with some volatility and has now topped out at 95.46, with unrealized gains of +357.06
post-image
INTC+3.33%
SOL-2.07%
LAB+2.57%
#MU
MU Market Analysis — Can Micron Push Beyond $1,000 Again?
Micron Technology (MU) has delivered a powerful recovery and is once again trading around the psychologically important $1,000 level. Your reference price is $1,011, while the latest market data shows MU closing around $1,016.59 after a strong 6.03% daily move. The stock reached an intraday high near $1,018.06 after opening around $973.80, showing that buyers were willing to aggressively defend the lower levels and chase momentum higher.
The most important point right now is that MU has reclaimed the $1,000 psychological zone. Frid
post-image
  • 5
$FHE Signal】1H pullback support + short squeeze initiation
$FHE A reversal structure emerged after a slow 1H decline on shrinking volume, with buyers actively accumulating around 0.050 and selling pressure exhausted. The 4H Bollinger upper band continues to open upward, while the funding rate is -0.0348% and leveraged shorts have not exited.
🎯Direction: Long
⚡Entry/Limit order: 0.0501591 - 0.0503100
🛑Stop-loss: 0.0498069
🚀Target 1: 0.0510647
🚀Target 2: 0.0514420
🛡️Trade management:
- Execution strategy: Reduce the position by 50% after reaching Target 1 and move the stop-loss up to the b
post-image
FHE-3.19%
BTC-1.95%
ETH-2.55%
SOL-2.06%
Should I make a “U.S. stocks crashed today” post?
post-image
$BTC Signal】Lower-level buy support + 1H recovery long
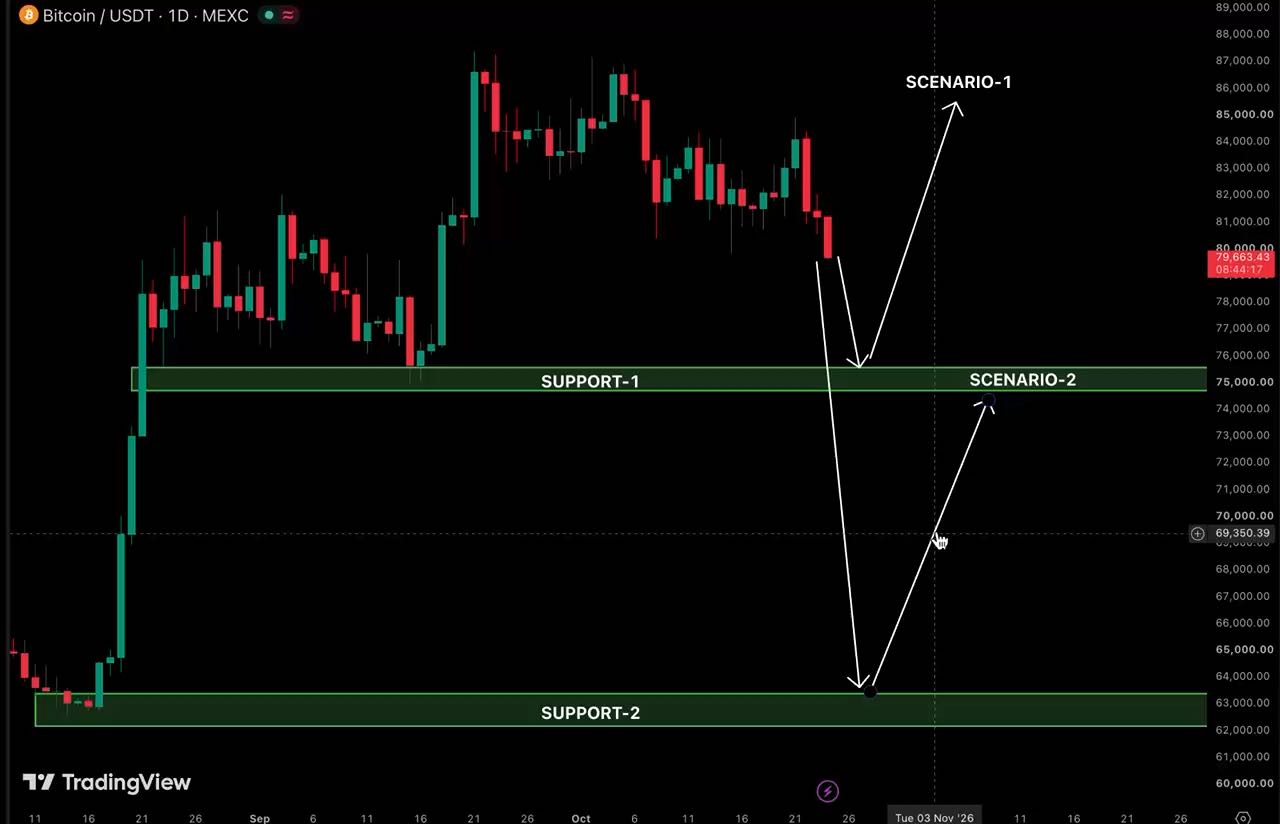
$BTC Order book buy/sell depth is 3.22, with substantial limit orders at lower levels. 1H RSI is 45.18, MACD's negative value is narrowing, volume is shrinking in the 79305-79544 range, OI is stable, and the funding rate is 0.0017%.
🎯Direction: Long
⚡Entry/limit order: 79305.966 - 79544.600
🛑Stop-loss: 77882.525
🚀Target 1: 82037.712
🚀Target 2: 83284.269
🛡️Trade management:
- Execution strategy: After reaching Target 1, reduce the position by 50% and move the stop-loss up to the breakeven level. If the price falls back to the entry le
post-image
BTC-1.96%
ETH-2.55%
SOL-2.06%
2026‑09‑05 ETH‑USDT Perpetual Contract Technical Analysis Strategy
Content is for technical analysis purposes only and does not constitute trading advice. Contract trading carries extremely high risk.
Key Levels
Resistance: 2510‑2540, 2570‑2600
Support: 2400‑2420, 2330‑2360
Market Overview
The medium- to long-term bullish structure on the daily chart remains intact. After the surge, the market has entered high-level consolidation, with the MACD red histogram contracting and upward momentum slowing. Price action remains highly correlated with BTC. The 4-hour chart is moving within a range, with
post-image
ETH-2.55%
Everyone’s staring at the 4h chart, but the 15m RSI just whispered a secret about $BTC /USDT that no one’s ready for.

$BTC /USDT - SHORT

Trade Plan:
Entry: 79443.1 – 79634.5
SL: 80457.6
TP1: 78849.7
TP2: 78390.3
TP3: 77701.1

Why this setup?
- Price is pinned at 79,538.8, but the 1D trend says “range” – that’s a trap for bulls.
- RSI (15m) at 43.97 is weak, not oversold – momentum is fading, not flipping.
- ATR (1h) at 382 means volatility is thin; the real move comes when 79,034 breaks.
- Why now? The short setup is “Armed” – entry zone 79,443–79,634, with TP1 at 78,849. If we lose
BTC-1.96%
$WXTM
【The decentralized communications narrative is heating up】
Gate spot WXTM is currently quoted at 0.0008629 USDT, up 54.94% in 24H, with 24-hour trading volume of approximately 90.1k USDT. The intraday high/low is 0.0008682 / 0.0005564. On the hourly chart, the price previously moved sideways around 0.00063–0.00064. At 00:00 today, a high-volume long bullish candle appeared, reaching as high as 0.000841, followed by a stepwise rise to around 0.000868. After the surge, it continued consolidating at high levels, indicating that short-term funds have not fully exited, while volatility has a
post-image
WXTM+42.88%
  • 1
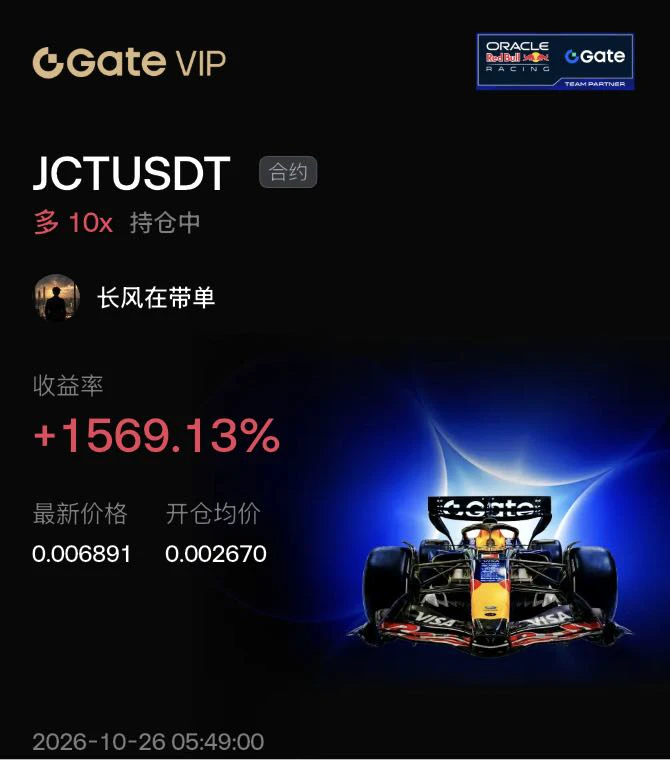
I originally wanted to cut losses and sacrifice it to the heavens, but the sacrifice never happened—the position cooked itself.
When I checked the chart just after lunch, I saw $TRUMP push upward again, but it started making me sleepy right after the surge. Volume kept declining—a typical weak rebound. I’ve seen this kind of movement too many times: when it can’t keep rising, it’s going to move down to find key levels. So without hesitation, I placed a short order at 2.566.
The market grew weaker throughout the afternoon, with the current price sliding to 2.33 and floating profit at +655.35%.
post-image
TRUMP-2.30%
DOGE-3.14%
SOL-2.07%
#Gate事件合约晒单挑战 Continue betting that the Fed will not hike rates in September.
Logic and reasons

Current situation: After Warsh's hawkish Jackson Hole speech on August 28, the probability of a September rate hike briefly surged to 65-68%; after Waller publicly questioned the hawkish tone on September 4, it fell back to 50%; today, August nonfarm payrolls came in at 162k, well above expectations of 55k, and the probability of a rate hike rose again to around 57%. So "betting on no hike" is currently a bet against the market direction—the market has tilted slightly toward a hike, but is far fr
post-image
Politics
Fed Decision in September?
25 bps increase
51%1.96x
No change
50%2.00x
$9.42M 24H+3 more
  • 3
$AKE It was still playing dead at 0.0127 ten minutes ago, and now it has shot straight up to 0.0202! With a 24-hour trading volume of 170M, something is clearly off with this coin’s volume, and speculative capital is obviously scrambling to accumulate. But I urge you to stay calm—this move looks exactly like that junk coin last week that surged 30% before getting cut in half. Don’t get carried away.
Here are three reasons to be bullish: First, the price broke through the previous high resistance at 0.0185, confirming a technical trend reversal. The MACD golden cross has just formed, and short-
AKE+26.42%
SOL-2.06%
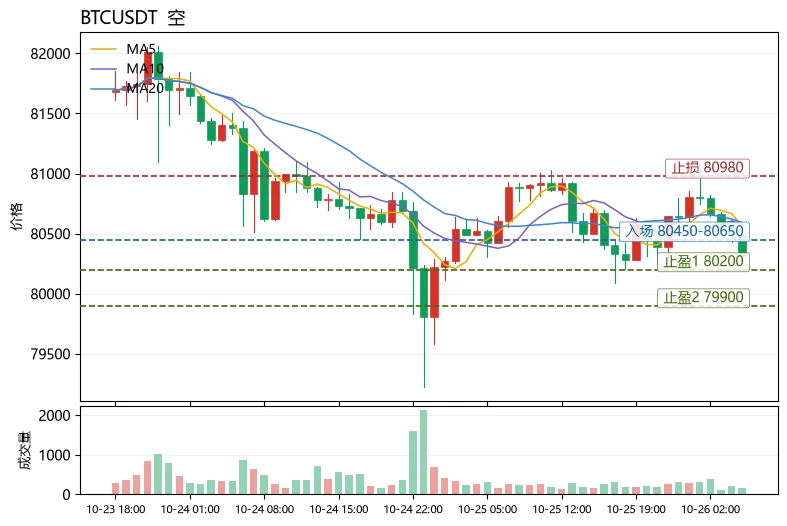
September 5 Bitcoin Trading Strategy Analysis
It's the weekend, and the weather is perfect for going outside, fishing, and catching shrimp! As for Bitcoin, it is also moving sideways within a range. Based on the current market structure, today's range is firmly set at 79815—79459. If you don't mind, go ahead and scalp it; it's like an old man masturbating—there are always a few drops left!
I. Right-Side Trading
Long Setup:
Condition: Bitcoin breaks above 79815 with volume; go long and set a stop-loss
Confirmation: Holds above 79968 on the hourly timeframe
Targets: 80538——81270
Short
post-image
BTC-1.96%
2026‑09‑05 BTC‑USDT Perpetual Contract Technical Analysis
Market conditions are for technical analysis only and do not constitute trading advice; contracts carry high risk
Key Levels
Resistance
First resistance: 80700‑81200
Strong resistance: 82100‑82400 (recent high, heavy trapped-holder selling pressure zone)
Support
First support: 78400‑78800
Strong support: 75400‑75800 (daily Bollinger middle band, key defense line for the bulls)
Market Conditions
The overall bullish structure on the daily chart remains intact. The price met resistance after surging above 82200, then came under pressure an
post-image
BTC-1.96%
Crypto Prediction and Trading Insights
live-cover
LIVE1,580
$AT I’m bearish on this structure. The whale-to-retail position ratio has been pushed down to 12.07x, with retail almost entirely on the opposite side, but OI is only $9M —such a small amount of open interest supporting such a skewed ratio simply means the market is too thin; whoever holds more tokens calls the shots. $HUMA 7.02x with $12M in OI, and $GPS 6.36x, show the same pattern. These tokens have no spot market to begin with, on-chain liquidity is pitifully thin, and token holdings are concentrated, so wherever whales lean, prices basically follow. Looking at the overall picture: among 2
post-image
AT+2.39%
HUMA-0.86%
GPS-0.68%
new update
live-cover
LIVE1,857
I was just about to go to the forum and start cursing, but then I saw my balance and thought, forget it—the market is always right. The chart did look ugly right after I saw the bearish news, but $SKR simply refused to break down around 0.012992, which was interesting. I felt it was a bear trap and bought directly at 0.012992. It has now risen to 0.021482, securing +1278.99%. The timing was perfect. This round of endurance wasn’t in vain—big gains are prepared for those willing to act. One-liner: Managing risk in advance is called rationality; cutting losses afterward is called making a heroic
post-image
SKR+6.80%
SNDK+11.73%
SOL-2.07%
$MARSCOIN Signal】1H pullback finds buying support, target long entry
$MARSCOIN Price 0.18077, 1H RSI 58.2, funding rate 0.0678%. Order book imbalance 18.06%, bid/ask depth ratio 1.44, with dense buy orders below. MACD histogram -0.0026, with negative values expanding. The 4H Bollinger Bands are widening, and volatility remains high. A candlestick that dipped to 0.17414 was quickly recovered, closing at 0.18092, with selling pressure fully absorbed.
🎯Direction: Long
⚡Entry/limit order: 0.1802277 - 0.1807700
🛑Stop loss: 0.1789623
🚀Target 1: 0.1834815
🚀Target 2: 0.1848373
🛡️Trade management
post-image
MARSCOIN+33.65%
BTC-1.95%
ETH-2.55%
SOL-2.06%
Load More

Join 40 M users in our growing community

⚡️ Join 40 M users in the crypto craze discussion

💬 Engage with your favorite top creators

👍 See what interests you

View More