








Share your thoughts
placeholder
Article
Most traders will fade this NEAR breakout—and lose their shorts.

$NEAR /USDT - LONG

Trade Plan:
Entry: 2.3818 – 2.4130
SL: 2.2473
TP1: 2.5100
TP2: 2.5850
TP3: 2.6976

Why this setup?
- 4h structure is *Armed* LONG with 95% confidence—not a guess.
- Daily trend is bullish, and the 1h pivot at 2.3974 is holding as a springboard.
- RSI 15m at 51 shows room to run before overheating—this isn’t a top.
- ATR (0.0625) says volatility is expanding; TP1 at 2.51 is the first magnet, TP3 at 2.6976 is the real prize.
- Why now? Entry zone 2.3818–2.4130 is the last cheap ticket before the dail
NEAR+7.84%
Everyone's watching UAI's 15m RSI at 73.8—but that's the exact moment smart money loads the truck.

$UAI /USDT - LONG

Trade Plan:
Entry: 0.59538 – 0.61528
SL: 0.50986
TP1: 0.67694
TP2: 0.72467
TP3: 0.79628

Why this setup?
- 95% confidence on a 4h LONG isn't a guess; it's a signal.
- 1D trend is bullish, and the 1h ATR (0.0397) shows volatility is compressing—breakouts feed on this.
- Entry zone 0.595–0.615 is a gift before TP1 at 0.677 (up ~12%).
- The 15m RSI overbought? That's a pause, not a reversal—momentum is shifting higher.

Debate:
Are you fading this 4h long because of a 1
UAI+17.59%
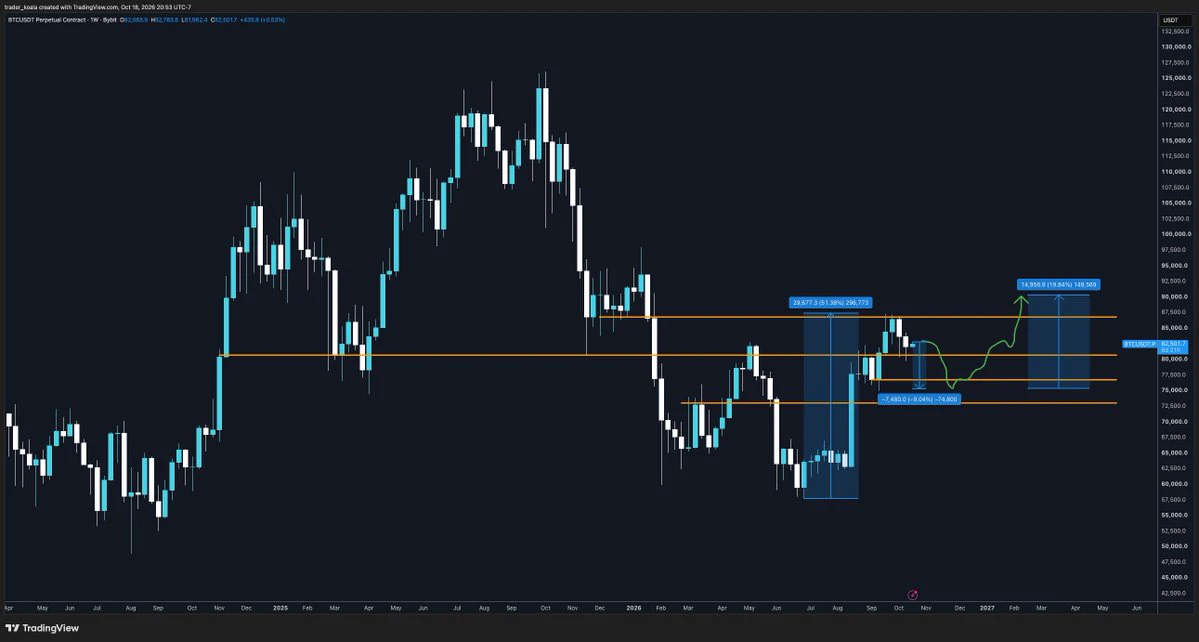
The weekly chart clearly shows the complete trajectory of Bitcoin in this cycle: multiple bottoms were tested to establish a solid floor, sideways consolidation completed the shift in positions, and the entry of bullish capital drove the market back above the $80,000 mark, with a mini bull-market structure emerging.
At this stage, the market is consolidating and repairing at high levels near the $80,000 mark. With the weekly candle nearing its close, even if an intraday surge is followed by a pullback, the market can still return to its trajectory. Both the lows and highs are rising in tandem,
post-image
BTC-0.04%
ETH+0.71%
SOL+2.00%
  • 1
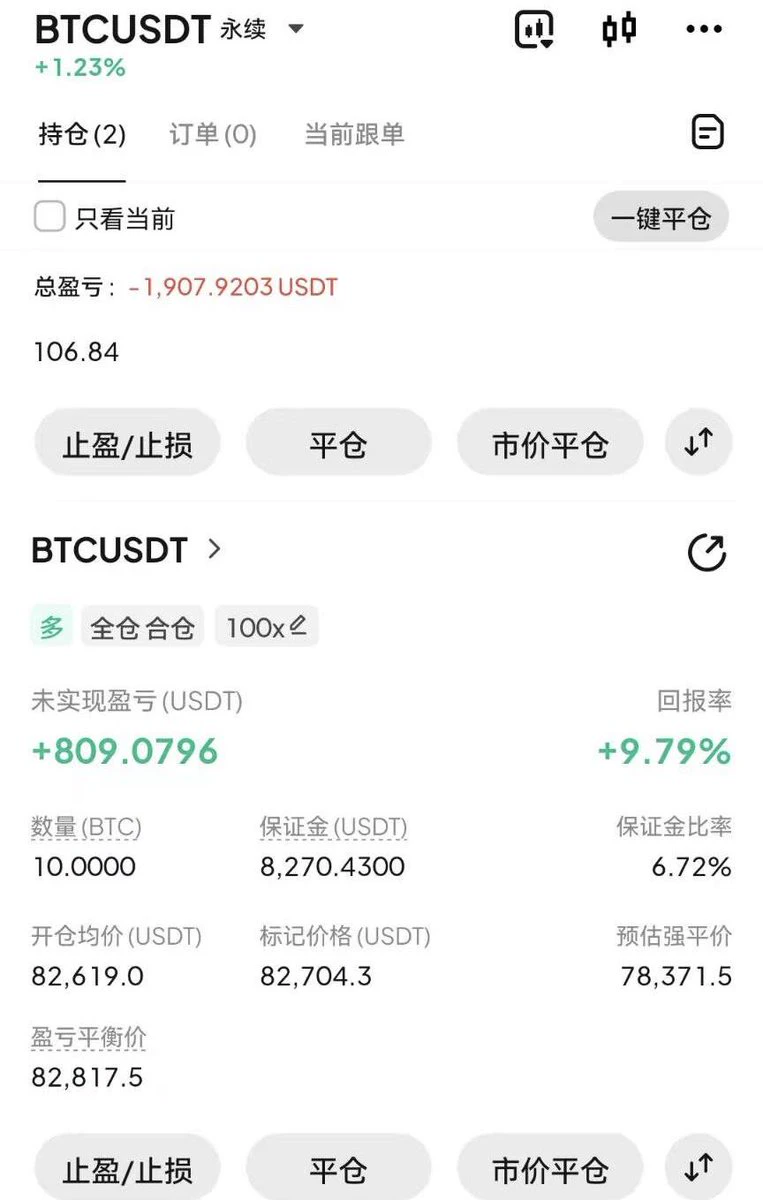
Liquidated another $1,000; I only had $15 left yesterday. I’m not depositing anymore. I’ll keep a daily record and see how many days I can last and how far I can go.
post-image
I only wanted to mooch a breakfast, but the market ended up keeping me trapped for half a year. I opened the charts this morning, and before my eyes were even fully open, I saw the price action bubbling up on its own. A few days ago, when I was watching the charts in the early hours, $VVV had been moving sideways at the bottom. Everyone was waiting and watching. I watched the order book for a while and saw that capital was entering lightly but steadily, with small orders continuously absorbing the selling at the bottom. At times like this, I don't hesitate—I stepped in and bought some around 1
post-image
VVV-1.24%
ADA-0.55%
DOGE-2.73%
Why is $SKHYNIX /USDT's 15m RSI at 41.93 while the 4h chart screams lower—most traders are already late.

$SKHYNIX /USDT - SHORT

Trade Plan:
Entry: 1278.91 – 1281.75
SL: 1293.92
TP1: 1270.14
TP2: 1263.34
TP3: 1253.15

Why this setup?
This isn't a breakout; it's a controlled descent. With 1D stuck in 'range' and ATR at 5.66, volatility is compressing before a snap. The short setup is armed: entry 1280.33, but the real meat is TP2 at 1263.34. Why now? The momentum divergence between the 15m (cooling off) and the 4h bias (SHORT) means smart money is distributing into that 1281.75 high. If we
SKHYNIX+0.64%
MARSCOIN’s 4h signal just flipped SHORT at 0.18439—but the daily range says otherwise. Who’s lying?

$MARSCOIN /USDT - SHORT

Trade Plan:
Entry: N/A – N/A
SL: N/A
TP1: N/A
TP2: N/A
TP3: N/A

Why this setup?
- RSI (15m) at 43.28: No oversold bounce yet—momentum is still leaking downward.
- Daily trend is “range,” not downtrend—so this is a scalp, not a swing.
- Confidence 55.4 is lukewarm: The edge is timing, not conviction.
- Why now? Price is mid-range with weak buying pressure—shorts get paid when range-bound traders panic.

Debate:
Is 0.18439 the fake breakdown before a squeeze, o
MARSCOIN-24.57%
Weekend Positioning Meets New Macro Data! Could BTC & ETH See Higher Volatility?
live-cover
LIVE385
A $$FLOCK 41% gain is a deadly trap; I bet it will crash back to 0.05 within 24 hours. The harder it pumps, the harder it dies—this coin is just market makers putting on a show. The drop from 0.082 to 0.0508 was massive turnover; 234M in volume is not something retail traders can pile up. The long-short battle has reached a boiling point, but after being pulled from 0.05 to 0.082 and then falling back to 0.073, this upper wick is longer than a retail trader's life.
Let me state the conclusion first: short it. Enter directly around 0.073, with a first target of 0.06; add to the position below t
FLOCK+14.85%
Everyone’s watching UNI’s 4H breakout, but the 95% confidence score is the quiet tell nobody sees yet.

$UNI /USDT - LONG

Trade Plan:
Entry: 7.114 – 7.192
SL: 6.778
TP1: 7.434
TP2: 7.621
TP3: 7.902

Why this setup?
- 1D trend is bullish, and price is holding above the 7.153 reference—this isn’t a random bounce.
- RSI 15m at 52.97 shows room to run before overheating, not exhaustion.
- ATR 1h at 0.156 gives clean volatility for a fast move toward TP1 7.434, then TP2 7.621.
- Why now? The setup is “Armed” with invalidation far below at 5.781—risk is defined, momentum is fresh.

Debate
UNI+2.15%
$UAI bounced after plunging 25%; my long position entered at 0.42 is still open, with an unrealized profit of 42%, but I didn’t exit at 0.69 just now and am kicking myself. This coin’s volatility is extreme: its 24-hour price range is 45%, and the $180 million trading volume shows that bulls and bears are aggressively rotating positions.
My view: short-term support is at 0.55; breaking it would mean a deep drop to 0.48. 0.62 is the key level above; if it fails to hold, I’ll short. I’m reducing my position by one-third to lock in profits, and moving the stop-loss on the remainder to 0.55.
If v
UAI+18.05%
Bitcoin’s long-term trend still looks bullish.
But $440K? That’s a massive move.
If adoption, liquidity, and institutional demand keep growing, could $BTC eventually get there? 👀
The real question is: how high can Bitcoin go this cycle?
post-image
BTC-0.05%
$GT ‌ ‌GateToken is the native exchange token of Gate.io ecosystem and Gate Chain gas asset.
• Utility Model: Fee discount up to 30%, VIP level multiplier, Launchpad and HODLer Airdrop eligibility, Gate Chain PoS staking and gas. Quarterly burn from exchange profit creates deflationary supply. • Market Position: Tagged NO.1 Exchanges and GT Eco. Exchange tokens are beta to BTC plus exchange volume alpha. GT at 9.24 trading +28.8% above Avg Price 7.17 indicates average position is in profit, reducing overhead selling pressure compared to August. • Relative Performance: 30d +39.79% vs BTC +∼12%
post-image
GT-2.66%
BTC-0.05%
Crypto Market Update
live-cover
LIVE418
#Web3SecurityGuide
WEB3 GIVES YOU CONTROL — AND RESPONSIBILITY
Web3 can make digital payments, ownership, and C2C trading more accessible. But with greater control comes greater responsibility for security.
Here are 5 simple rules every Web3 user should remember:
🔑 1. NEVER SHARE YOUR SEED PHRASE
No support team, platform, or person should ever need your seed phrase or private key.
🌐 2. VERIFY LINKS & DAPPS
Fake websites and phishing links can look almost identical to the real ones. Always check before connecting your wallet.
✍️ 3. READ BEFORE YOU SIGN
Don't blindly approve transactions or
No big-picture thinking, can't hold, the profits on this trade are paper-thin, but I love it.

I had just finished writing an analysis $BCH noting clear resistance overhead and a low-volume rise, but I didn't expect it to fake a drop and then take off again. While everyone else was exiting, I picked up some at 247.31. The market hadn't fully started moving yet, and it felt like picking up a bargain.

I was genuinely nervous during the repeated intraday swings, but when it reached 256.79, it felt incredible. The +272.18% return may not be much, but it's safe and locked in.

Take profits fir
post-image
BCH-0.45%
SOL+2.00%
ETH+0.71%
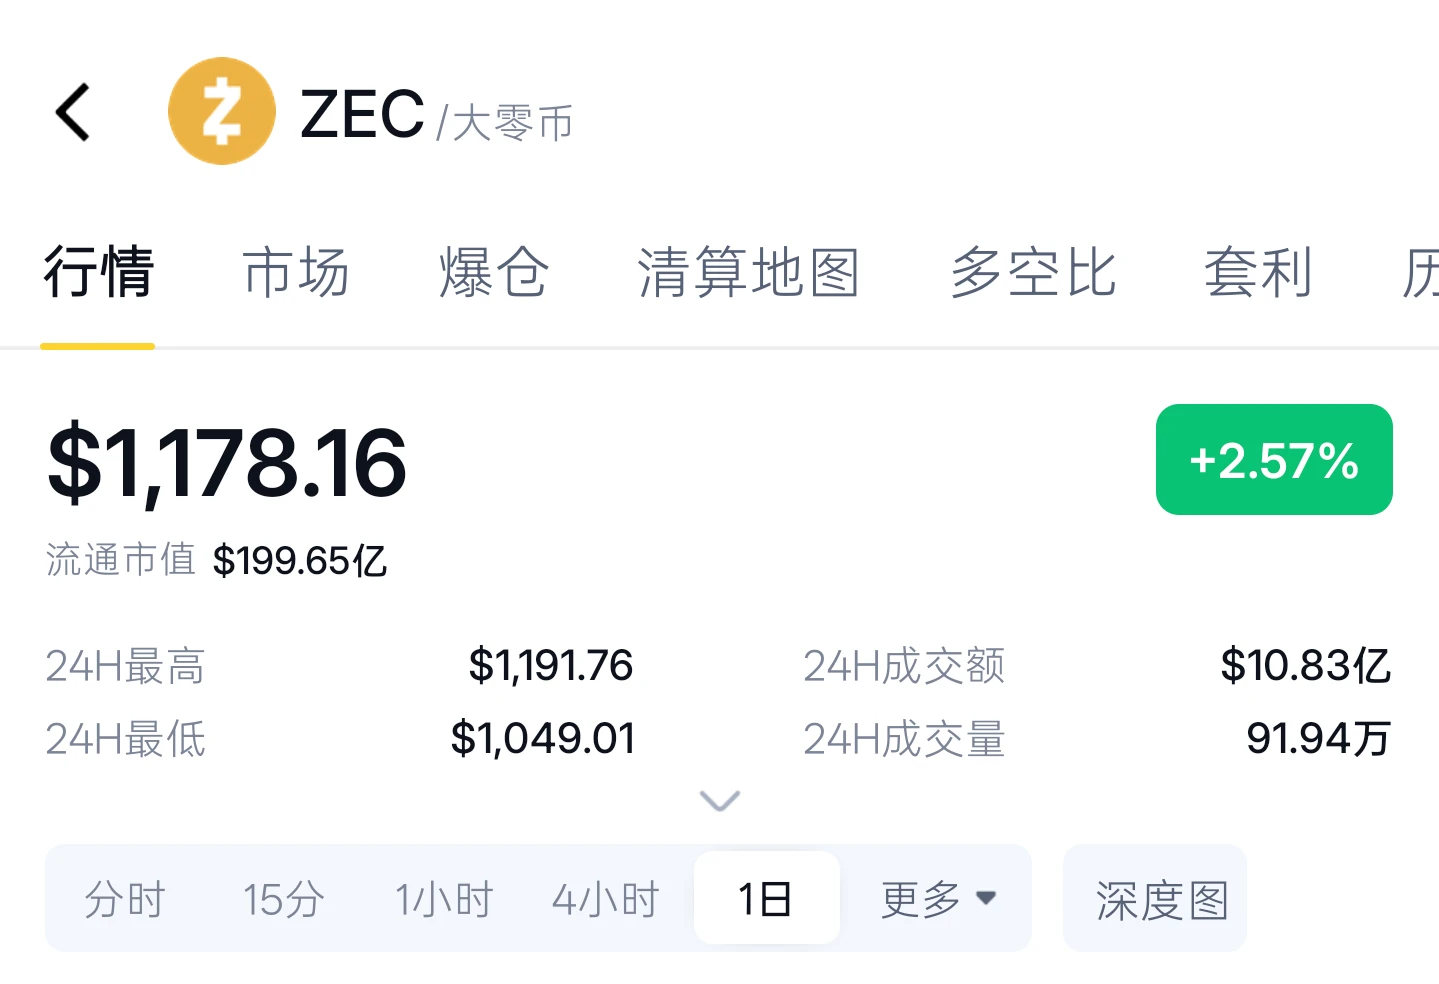
ZEC indeed broke above 1,200, wiping out shorts. Do you think it has topped out or will reach 1,500? $ZEC
post-image
What do you all think about ZEC?
It has topped out.
Keep flying.
2 Participants
Ends In 22 Hour
ZEC+20.01%
  • 1
Everyone’s staring at ADA’s 4H chart—but the range is a lie.

$ADA /USDT - SHORT

Trade Plan:
Entry: 0.2186 – 0.2198
SL: 0.2248
TP1: 0.2150
TP2: 0.2122
TP3: 0.2080

Why this setup?
Why now? The 1D trend says “range,” yet the 4H signal is SHORT with 55.4 confidence. RSI (15m) is neutral at 51, but ATR (1h) is thin—0.0023—meaning the breakout is coiling. Entry at 0.2192 (low 0.2186) targets 0.2150, then 0.2122. If 0.2130 breaks, the short thesis dies. This is a low-liquidity squeeze zone, not a trend.

Debate:
Is 0.2130 the fakeout floor, or are we about to see ADA dump to 0.2080 before the
ADA-0.55%
Markets will still be here tomorrow.
Gonna unplug a little for the next 24 hours and enjoy some much needed family time. ❤️
Hope everyone has a great Sunday.
post-image
This ADA long position felt quite comfortable. The reason for entering was that an impulsive bullish candle appeared on the hourly chart, directly breaking above the upper boundary of the previous consolidation range. I judged at the time that this was not just a wick but genuine capital entering the market, so I decisively followed up with a long position after the pullback confirmation.

After entry, the market did not put me through much sideways action and basically moved upward along the moving averages. I closed 70% of the position around +422.94%, while setting a protective level for t
post-image
ADA-0.55%
LAB-4.00%
ZEC+20.01%
Load More

Join 40 M users in our growing community

⚡️ Join 40 M users in the crypto craze discussion

💬 Engage with your favorite top creators

👍 See what interests you

View More