Share your thoughts
placeholder
Article
#ETH
In the face of market movements, we still need to maintain respect for the market. A profitable trade on Friday was held until it turned into a loss, and I got punished, hahaha. Stop-losses are not scary; what’s scary is holding onto losing trades. I’ve recovered from them countless times, but one time wiped out all my previous gains. So stop-losses are not scary—if you lose 20 points, just make back twice as much. I hit a stop-loss from 2568 to 2592 on Friday, but made it back that same day, and also captured a short position around 2655. Today, I captured a long position around 2575 on
ETH-0.92%
Everyone is missing the obvious trap forming in $FIL /USDT right now.

$FIL /USDT - SHORT

Trade Plan:
Entry: 0.9202 – 0.9314
SL: 0.9792
TP1: 0.8858
TP2: 0.8591
TP3: 0.8190

Why this setup?
Why now? The daily trend is range, which means the asset is coiling for a directional break that usually favors the short side when momentum fades. The 1h ATR of 0.022245 shows volatility is expanding just enough to fuel a move but not yet enough to trap the overextended longs. A 15m RSI at 34.55 confirms momentum is leaning bearish without being oversold, leaving room for further downside. The entry zon
FIL-12.62%
The 10-year U.S. Treasury yield has risen to a high of 5.01%, continuing to weigh on risk asset valuations, while the crypto market remains under overall pressure; the SEC’s innovative exemption for tokenized stocks has sparked divisions, bearish for BTC, while ETH lacks independent positive catalysts; whale-related data shows no clear buying support. Technically, short-term rebound potential is limited, and the risk of chasing higher prices is relatively high. A rebound into the 2610~2660 range is suitable for shorting; monitor changes in Treasury yields and regulatory news. For market analys
post-image
BTC-0.42%
ETH-0.92%
$ETH Ethereum Consolidates at the Highs — Resistance in Focus
Due to family commitments, this will be the last analysis until late tomorrow evening
Breakout Zone Holds
Ethereum has so far successfully retested the $2,400 breakout zone, with buyers stepping in on both recent pullbacks. Holding this area keeps the broader recovery firmly intact.
Consolidating Near the Highs
Rather than seeing a sharp rejection, ETH has been consolidating near the top of its recent range. Price has now pushed as high as $2,668, increasing the possibility of another move higher.
Major Resistance Being Tested
ETH i
post-image
ETH-0.88%
What are whales buying in Meme, according to on-chain data?
You can't trade Meme by looking only at the K-line; on-chain data is the real trump card. Recently, I've been watching several indicators: large transfers, changes in holder addresses, and exchange inflows and outflows.
Over the past week, PEPE saw 12 more addresses holding over $1 million, while net outflows from exchanges increased, suggesting whales are accumulating. At the same time, the number of small addresses holding less than $1,000 fell by over 3,000, showing that retail traders are cutting their losses.
WIF is the exact opp
TSLA-0.49%
$LUNA2 Something is off with this data. The 24h low is 0.0465, the current price is 0.0622, the price range is 41%, and the trading volume is only 27.1M—this kind of volume can hardly support a 29% rise, and the order book is paper-thin.
First, the conclusion: a typical short squeeze. There is not much to say about LUNA2's fundamentals. The story of rebuilding on the ruins of the Terra ecosystem has been told too many times. No substantial return of TVL can be seen on-chain, and DEX trading volume has not continued to expand. This surge looks more like shorts piled up after an overly long peri
Ugh, bro, it’s obviously a scam.
post-image
Everyone calling $CL /USDT a range is missing the 1h setup forming right now.

$CL /USDT - SHORT

Trade Plan:
Entry: 97.08 – 97.28
SL: 98.16
TP1: 96.45
TP2: 95.96
TP3: 95.23

Why this setup?
Why now? The 4h structure shows a range, but the 1h RSI at 44.19 signals bearish momentum building inside that range. The 1h ATR of 0.406468 confirms enough volatility to push from the entry zone of 97.18 down toward TP1 at 96.45 and then TP2 at 95.96. The daily trend being range-bound means this short has room to run before mean reversion hits. The invalidation level at 97.01 is the line in the sand th
post-image
CL+1.99%
My current Meme position allocation and why I set it up this way
Let me talk about my current Meme positions.
PEPE accounts for 30%, DOGE 20%, WIF 10%, and the remaining 40% is in USDT, waiting for opportunities.
Why this allocation? PEPE has both volume and a narrative, with healthy technicals, making it the asset with the best risk-reward ratio at present. DOGE is stable and less volatile, making it suitable as a core position. WIF has high upside but also high risk, so I keep a small position. The 40% in USDT is reserved for picking up tokens after a sharp crash.
Overall strategy: Hold more
WIF-5.48%
The AI strategy bot I made 🤖 is used for contract analysis and is quite accurate 😎$ETH .
ETH-0.88%
  • 4
It's Sunday
Enjoy and have fun
What did you eat today 👀😁
Never surrender, just keep dreaming!
post-image
Nobody is shorting SYMBOL right now and the RSI is screaming.

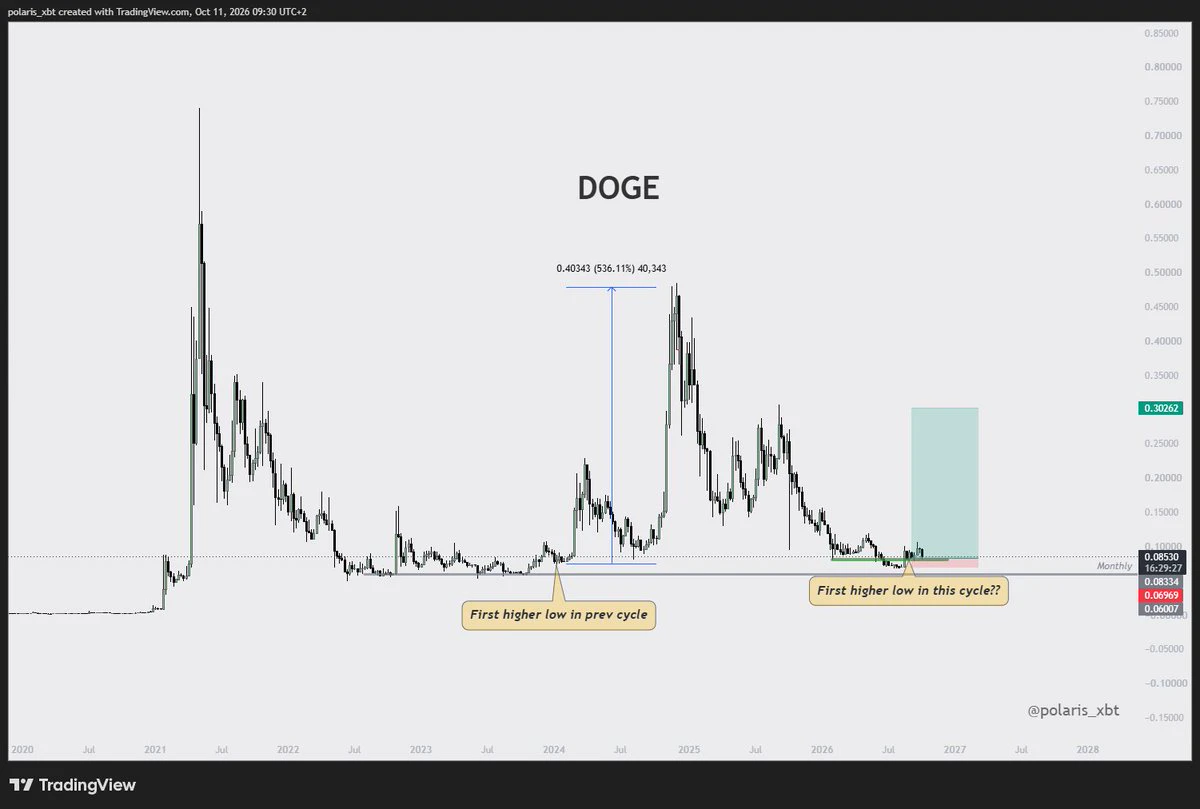
$DOGE /USDT - SHORT

Trade Plan:
Entry: 0.08659 – 0.08699
SL: 0.08876
TP1: 0.08532
TP2: 0.08433
TP3: 0.08286

Why this setup?
Why now? The 1h price sits at 0.08678 inside a tight entry zone between 0.08659 and 0.08699, while the 15m RSI reads 76.08, showing momentum is stretched against a range-bound daily trend. The 1h ATR of 0.000819 means a single bar can cover the distance to TP1 at 0.08532, and a second leg aims for TP2 at 0.08433. The invalidation level at 0.08568 is the line in the sand that protects the setup.

Debate:
DOGE-3.71%
#Bots I am trading with the Rebalancing Bot on Gate. Join me!
post-image
$ETH An engulfing pattern + double upper wicks have appeared, making a strong short-term rally more difficult.
The ETH chart has formed an engulfing candlestick pattern, and has repeatedly closed with upper wicks at 2669, with both upward attempts being suppressed and retreating.
This candlestick combination sends a clear signal: the difficulty of continuing a major upward breakout in the short term has increased significantly, and the market has entered a consolidation phase.
Technically: the market will most likely retrace to around 2450 to seek support. 2400 is the core defense level for t
ETH-0.88%
GM let’s Get Money
post-image
Perfect take-profit! No need to hold out for more upside! Once it hits the first take-profit level, I'm done! Those who continue going long afterward must make money too! $BTC
BTC-0.44%
SOL rises above $111! Spot ETF inflows exceed $28 million—is ins
live-cover
LIVE1,943
156%, excluding fees. Note this down.
post-image
Load More

Join 40 M users in our growing community

⚡️ Join 40 M users in the crypto craze discussion

💬 Engage with your favorite top creators

👍 See what interests you

Trending Topics

MSTRTopsNasdaq100

74.18k Views3.02k Discussing

Strategy (MSTR) has gained about 48% over the past month, making it the best-performing stock in the Nasdaq 100, while Bitcoin rose roughly 12% over the same period. The company holds 845,050 BTC with a cumulative cost basis of about $63.73B. MSTR is not a pure Bitcoin proxy — its price swings can be more extreme. Can this rally last?

Gate Tops 24H Net Inflows Among Exchanges

26.5k Views3.69k Discussing

BTCRetakes80K

57.29k Views60.64k Discussing

View More