
Square
Following
Hot
News
Profile
Share your thoughts
placeholder
Article
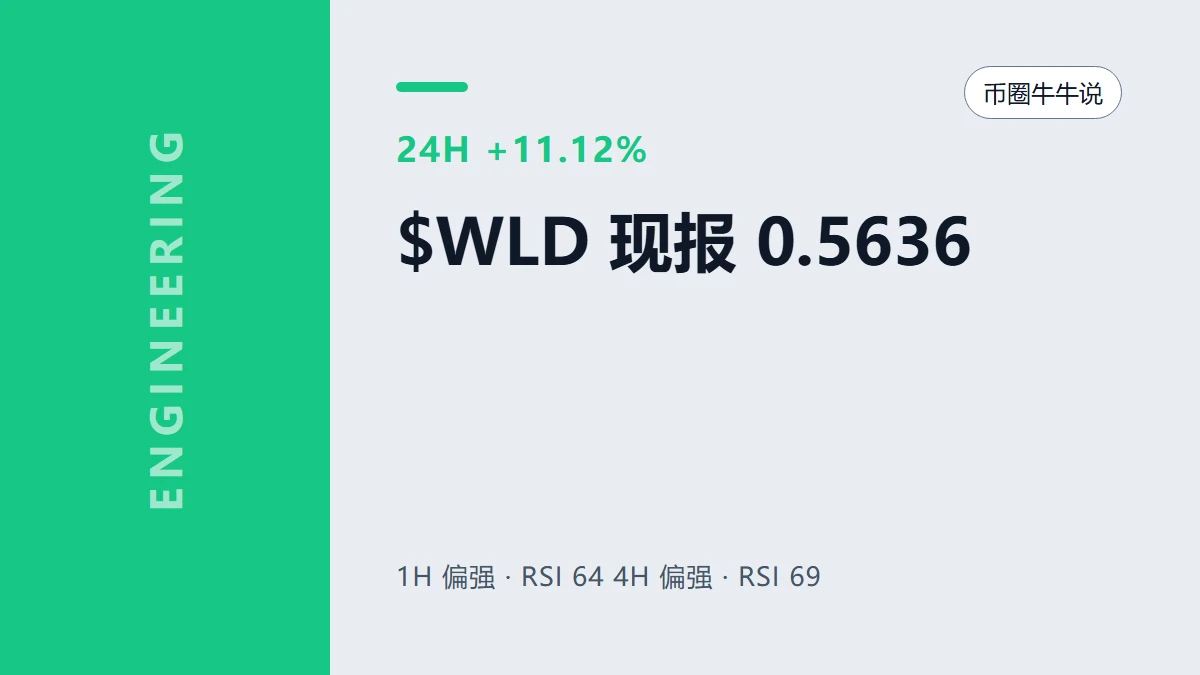
$WLD surged sharply over 24 hours and is currently priced at 0.5636 USDT, between the 1-hour support level of 0.5013 and resistance level of 0.5858. It is up 11.12% over 24 hours, but 1-hour trading participation is only 0.11x, which seems somewhat unusual. This makes me more inclined to believe this rise may be more of a technical rebound than a trend breakout. The current price is already close to 1-hour resistance; if it cannot break through decisively here, this rally may just be a temporary correction.
The opportunities truly worth watching are either holding above 0.5858 with continued b
post-image
WLD+10.54%
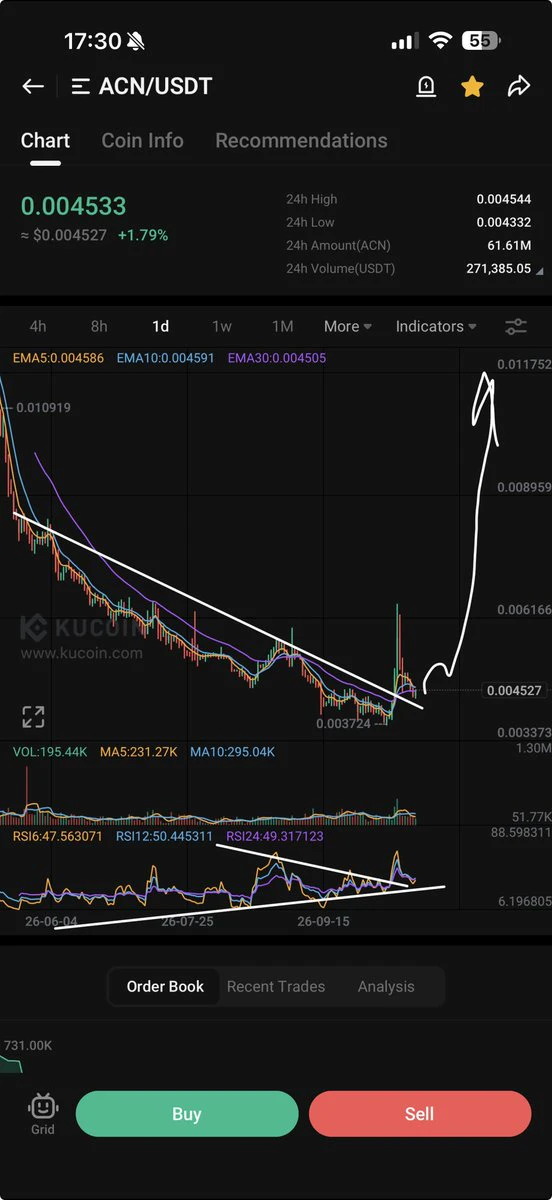
$ACN BIG SEND INCOMING
post-image
ACN+1.21%
Trenches
Pokémon
P
bade
b
Pokémon
D42T...Xvb1
Market Cap
$.
Change
.
24h Vol
$.
Holders
.
COLLECTOOOR
C
bade
b
COLLECTOOOR
ESnW...pump
Market Cap
$.
Change
.
24h Vol
$.
Holders
.
STONK
S
bade
b
STONK
6GmA...UNgx
Market Cap
$.
Change
.
24h Vol
$.
Holders
.
Dacity
D
bade
b
Dacity
nxPq...pump
Market Cap
$.
Change
.
24h Vol
$.
Holders
.
TORCH
T
bade
b
TORCH
0x00...1111
Market Cap
$.
Change
.
24h Vol
$.
Holders
.
$ZEC ’s direction looks clear, but volume hasn’t confirmed it
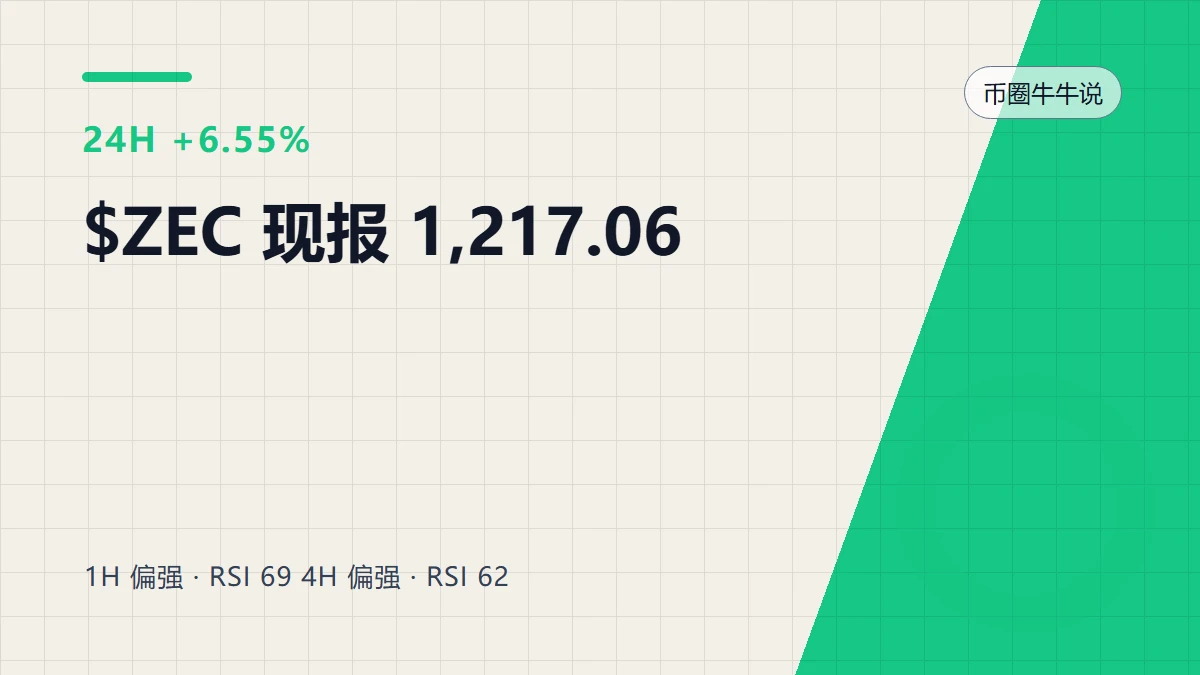
$ZEC There’s a very typical debate right now: one side cites the 24-hour gain of +6.55% as proof of direction, while the other pushes back by pointing to key levels. I’m not taking sides based on the price change just yet, because while $ZEC’s price has already moved, trading activity and volume haven’t kept up or provided a complete answer. The direction can be trusted for now, but not its continuation; a move without follow-through can be reversed at any time.
My view is that the direction is there for now, but low participation un
post-image
ZEC+6.93%
A 16.3% automotive gross margin is the floor; the real “second engine” is energy

Folks, when discussing Tesla’s earnings, don’t focus only on deliveries. Gross margin is the health check for this earnings report.

Q3 automotive gross margin (excluding credits) has fallen to 16.3%, its lowest level since the 2023 price war. The factors pressuring margins are concrete: a slight decline in sales weakening fixed-cost absorption, changes in the sales mix in Europe and Asia-Pacific, additional incentives in China, and rising prices for raw materials such as steel, aluminum, copper, and lithium. F
TSLA+1.82%
BlackRock Files for Its Third BTC ETF! Offering Upside Exposure With Downside Protection,
live-cover
LIVE1,854
Floki all time high hype ath go
post-image
FLOKI+6.58%
Build them up to break them down
H & S as noted by @TradingSailor
post-image
#MicronHostsTechnicalWebinar
Micron’s Technology Webinar: Building the Memory Foundation for the Next AI Revolution
The Future of Artificial Intelligence Will Depend Not Only on Powerful Processors, but Also on Faster, Smarter, and More Efficient Memory.
The technology industry is entering a new phase in which artificial intelligence, high-performance computing, cloud infrastructure, and advanced data centers are transforming the global digital economy. At the center of this transformation is a critical component that often receives less attention than processors and AI models: semiconductor
MU+0.63%
Layout: Bitcoin, Ethereum, Dogecoin
live-cover
LIVE1,652
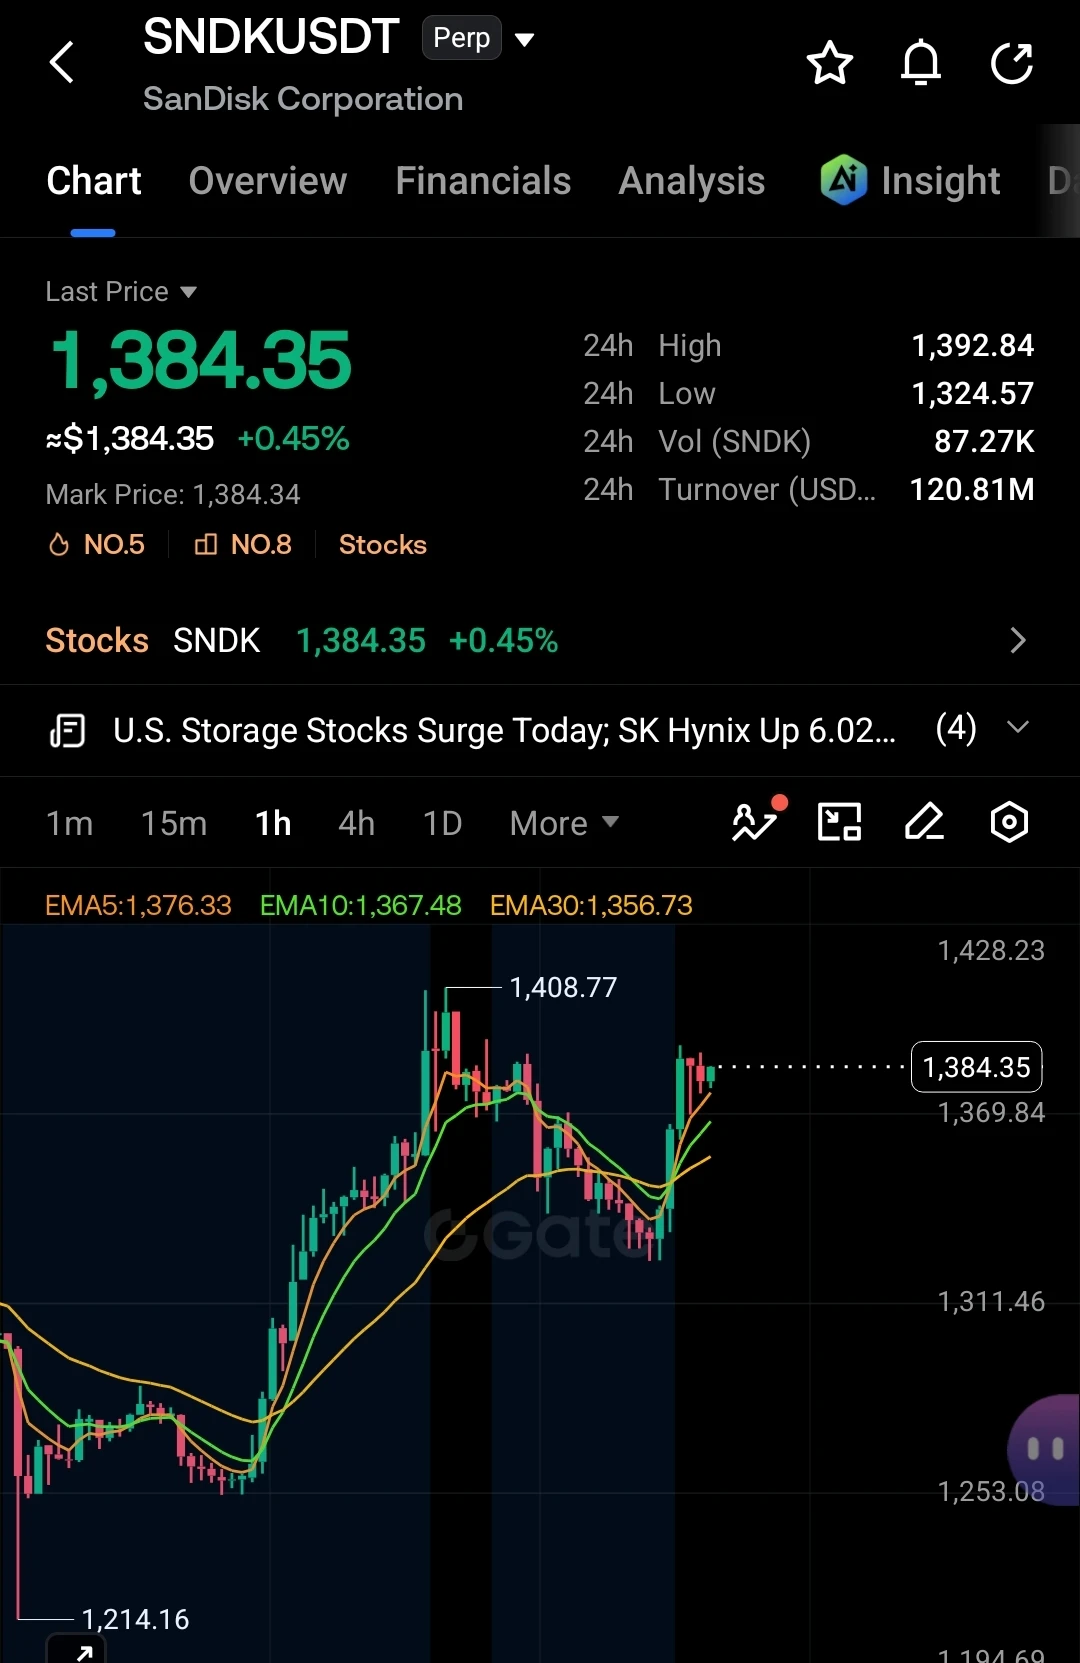
$SNDK is showing a classic relief bounce after a after major downside.
The chart shows price aggressively rejecting the $1,215 lows and reclaiming the $1,380 level, completely invalidating the recent downtrend structure. price is holding firm at the highs of this rebound, a breakout toward the $1,456 liquidity zone looks primed to trigger.
Trade Setup:
SNDK BUY NOW 1383
SL: 1356
TP1: 1425
TP2: 1460
Full TP: 1500
Trade $SNDK
post-image
SNDK+0.35%
#Gate30日净流入全球第二 2026.10.21
Daily chart entry point: 2440
Resistance levels above: 2450-2463-2480-2495-2500-2520-2530-2535
Support levels below: 2430-2420-2400-2490-2480-2470
If any support or resistance level holds, trade the rebound; if it breaks, follow the trend. If price holds above 2480-2500-2535, favor buying dips; if these levels fail to break, favor selling rallies. If price holds above 2450, favor buying dips; if it fails to hold 2450-2426, favor selling rallies. If 2410-2400 holds, take long positions on a rebound. On the downside, if 2380-2370 holds, favor buying dips; if it breaks,
1000SHIB | Long 🟢 | Bullish | 15-minute, 24-hour change: +1.48% | Volume: 26.9M USDT. Long rationale: Price is above EMA200; EMA20/50/200 are in bullish alignment; RSI14 is 61.7; MACD histogram is positive; ADX14 is 25.3; volume is 1.02x the average of the latest 20 candles; trend pullback/continuation. Entry: 0.005091 Stop-loss: 0.00498108 Take-profit 1: 0.00522841 | Take-profit 2: 0.00531085 | Take-profit 3: 0.00542077 Entry price is for reference only; do not chase the price. If the stop-loss level is reached, this trade setup is invalidated. Technical analysis setup only; not financial ad
post-image
Another day packed with gains$MU $NAS100
post-image
MU+0.63%
NAS100+0.08%
$APR Market cap: 8 million, trading volume: 80 million—volume is more than 10 times the market cap. This rebound rally has only just begun; keep adding to longs!⬇️⬇️
post-image
APR+29.68%
#ShareWeekly #WCTCS9
Netflix at $69.87: One earnings report, three tests growth, engagement and investor trust
Netflix enters its Q3 earnings event with a problem that cannot be solved by revenue growth alone. The business is still expected to expand, but the market wants evidence that viewers remain engaged, advertising can become a stronger revenue engine, and new programming can justify the cost of staying competitive.
With NFLX down approximately 26% in 2026, this report matters because expectations have changed. Investors are no longer asking only how much Netflix earns. They want to kno
NFLX-0.86%
DIS+1.71%
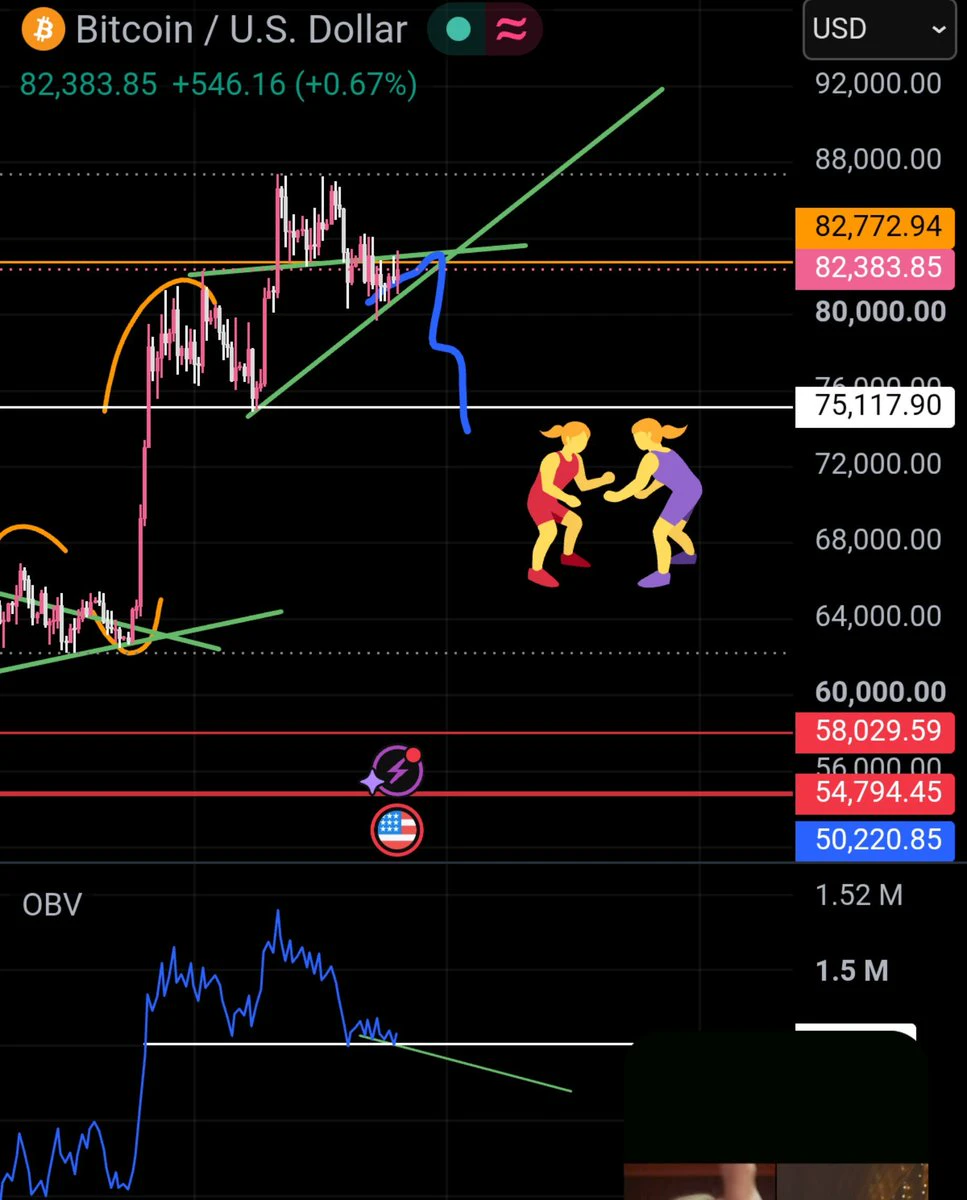
Nobody here understands liquidity
$BTC #CRYPTO
post-image
BTC+1.00%
2.1 billion tokens burned without a big bullish candle; I’m bullish on $ASTER
$ASTER Less than an hour ago, it announced a buyback and burn, but the price only moved from 0.7061 to 0.7031. More than 2.72 million tokens bought back and burned over two weeks, with over 210 million burned in total—fee-funded buybacks are turning into buying pressure. With data this strong, the price is only down -0.42%. I’m bullish—the muted response during a bottoming range looks more like a transfer of coins.

The volume ratio is only 0.519, with 24h turnover of 7029479 USDT, a typical drop in volume; daily R
ASTER+1.82%
$1000PEPE $PEPE
PEPE currently looks very strong. Don't miss the opportunity—it's time to go long! Long strategy. Entry: $0.0044 - $0.0045Take profit: $0.0047 - $0.005 - $0.006 - $0.008Stop loss: $0.00405
post-image
PEPE+12.18%
Load More

Join 40 M users in our growing community

⚡️ Join 40 M users in the crypto craze discussion

💬 Engage with your favorite top creators

👍 See what interests you

Trending Topics

GateRanks2ndIn30DayNetInflows

3.77k Views756 Discussing

According to DefiLlama, Gate recorded over $199 million in net inflow over the past 30 days, ranking second among global centralized exchanges. Capital keeps flowing in — what's your strategy? [👉 Read more](https://www.odaily.news/en/newsflash/525820)

GateIdleFundsSurpass$300M

4.87k Views1.45k Discussing

TeslaQ3EarningsPreview

2.39k Views190 Discussing
View More