Share your thoughts
placeholder
Article
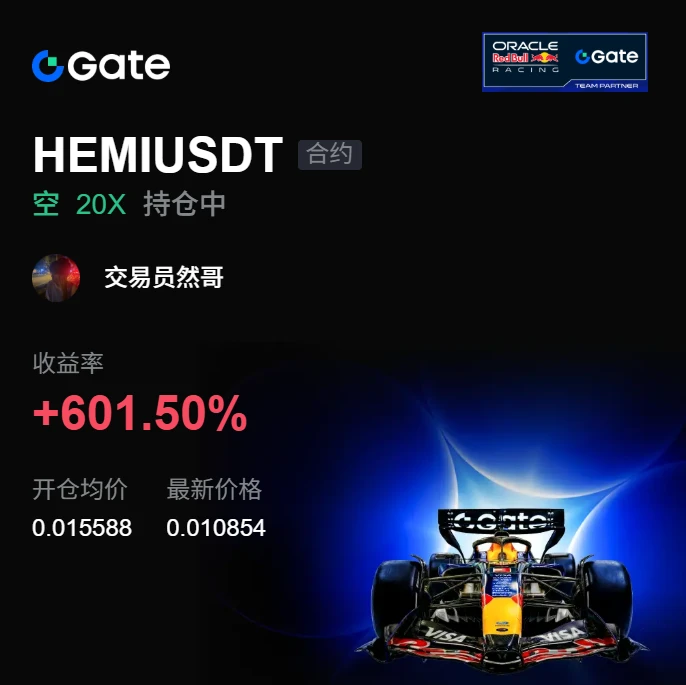
I don’t have the big-picture view and can’t hold on, but these profits are as thin as paper—and I love it. When I opened the chart this morning, the short position was still alive, and the price once again opened lower at a level that even surprised me a little.
Actually, entering this trade was quite straightforward: when the price rebounded to around 0.015588 a few days ago, there was no follow-through on the upside. It spent two hours grinding without breaking that high, while trading volume kept shrinking. This was an obvious key level; I would have been wasting the opportunity if I hadn’t
post-image
BTC+0.03%
ETH+1.02%
🚀 NVDA Tokenized Stock: The AI Super-Cycle Continues! Are We Gearing Up for a New ATH? 🚀
Nvidia (NVDA) is showing incredible resilience, and the charts are printing exactly what bulls want to see. Trading at $230.40 (+0.87%), NVDA has staged a massive recovery. Let’s dive into the technicals across multiple timeframes to see where this AI giant is heading next on Gate.io!
📈 1-Day Chart Analysis:
The Ultimate Bounce
The daily chart is a masterclass in trend recovery. After tapping the $190 support level in late July/early August, NVDA has executed a te
NVDA+0.87%
  • 5
  • 2
#美国8月非农超预期 $TSLA 62,000 nonfarm payrolls—is it too good to be true? Not so fast, this employment data may be “bloated”
The US added 162,000 nonfarm jobs in August, while the market had originally expected just over 50,000—nearly a threefold difference. The unemployment rate remained unchanged at 4.1%, while the labor force participation rate rose from 61.4% to 61.6%. Judging by the numbers alone, the US labor market looks like it suddenly took a “miracle pill.”
But the most interesting part of the data is precisely hidden in its industry composition.
Restaurants and bars added 59,000 jobs in A
TSLA-5.96%
  • 51
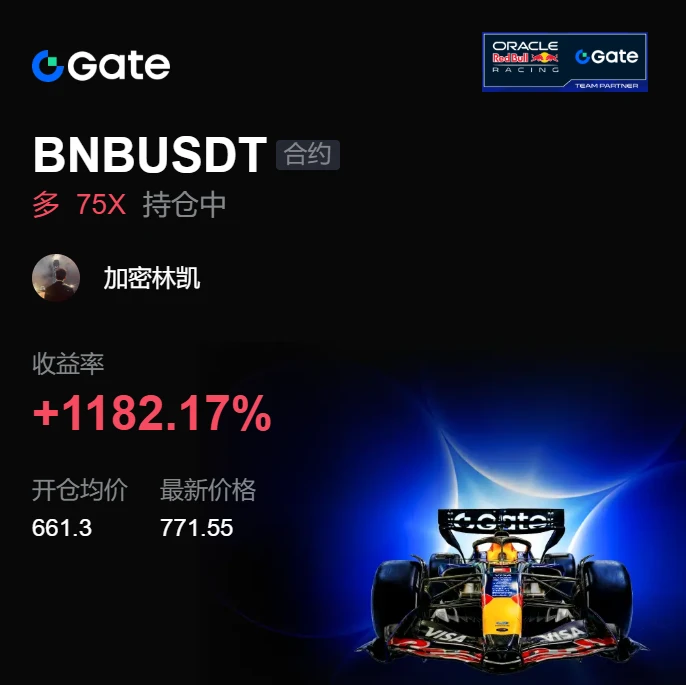
This was purely the market being in a good mood and casually tossing out some coins, which just happened to land on my head. A few days ago in the afternoon, while watching $BNB ’s order book, I noticed something was off: the price kept hovering around 661.30, but every time it was pushed down, buyers quickly absorbed it. Signs of strengthening buying pressure at the bottom can’t be faked. I added to my long position amid the repeated intraday swings and didn’t say much to anyone, posting only one line: “Hold after the pullback, let’s test the waters.” Before long, the trend started fulfilling
post-image
BNB+7.27%
ADA+3.15%
SNDK+1.88%
Choose your founder:
@VitalikButerin
@vladtenev
@cz_
@SBF_FTX
Everyone’s staring at 85.3—but the 95% conviction score says they’re wrong about HYPE.

$HYPE /USDT - LONG

Trade Plan:
Entry: 85.226 – 85.528
SL: 83.931
TP1: 86.461
TP2: 87.184
TP3: 88.269

Why this setup?
- 4h setup is *Armed*: entry 85.377, with TP1 at 86.461 and TP2 at 87.184—that’s a 2.1% move before you even breathe.
- 1D trend is bullish, and RSI (15m) at 52.31 shows room to run, not exhaustion.
- ATR (1h) at 0.602 means volatility is your friend—not your enemy—right now.
- Why now? The invalidation sits at 82.117, so risk is tight (SL 83.931) while reward stretches to 88.269.
HYPE+1.05%
#晒出我的持仓收益 You can enter first, or check yesterday’s post and wait for a wick to enter#BTC收复8万美元
post-image
BTC+0.05%
This move doesn't even require me to think—the account is dancing on its own. When the screen was all green, everyone was selling at a loss, but I didn't panic watching the market. It was bottoming without breaking support, while funds quietly entered—the signal worked better than any analysis.

$SNDK $LAB
post-image
SNDK+1.88%
LAB+2.32%
Everyone’s long CL/USDT while the 4h tape is quietly screaming lower highs.

CL/USDT - SHORT

Trade Plan:
Entry: 91.72 – 91.90
SL: 92.70
TP1: 91.14
TP2: 90.70
TP3: 90.03

Why this setup?
Why now?
- 1D range, but the 4h bias flips SHORT (Conf 55) – that’s the first crack in the bull story.
- RSI 15m at 56.76 suggests a dead-cat bounce, not a breakout.
- Entry 91.81 with TP1 91.14, TP2 90.70 – that’s a 1.2% drop just to first target, while SL sits tight at 92.70.
- ATR 1h at 0.37 means volatility is low – shorts get room to breathe before the trap springs.

Debate:
Are you fading thi
CL+0.88%
$SOL Signal】Long, 1H buy-side support
$SOL Buy-side support is clear: 1H MACD histogram at 0.135, depth ratio at 1.05, and funding rate at 0.0083%. At 12:00, increased volume pushed the price to 103.19, with buyers accounting for 0.63 of transactions; at 13:00, a long upper wick led to a pullback, followed by a rapid recovery to 102.8 at 14:00. The 4H MACD golden cross is continuing, and OI is stable. The price is approaching the 1H Bollinger upper band at 102.99, with dense orders around 102.5 below, while selling pressure has been continuously absorbed. The risk-reward ratio is within an ac
SOL+1.57%
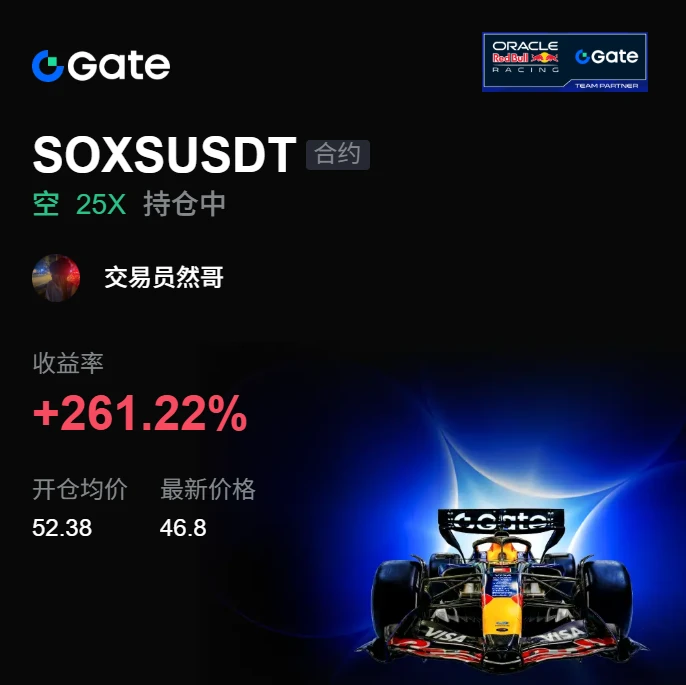
I originally wanted to cut my losses as a sacrifice to the heavens, but the ritual never happened—the meat cooked itself. Just when I thought this move was completely dead, I still had one short position left open. As soon as the early-session sell-off hit, it started working for me.

At the time, $SOXS was repeatedly ranging at the highs. Every push higher was just short of breaking through, the rebound was extremely weak, and volume had also shrunk significantly from before. I knew this kind of structure was most likely to deceive traders, so I opened the short around 52.38.

The market h
post-image
SOXS-0.49%
ETH+1.02%
ADA+3.15%
Everyone’s chasing longs on $SUI /USDT, but the 4h just armed a trap most will ignore.

$SUI /USDT - SHORT

Trade Plan:
Entry: 0.7980 – 0.8032
SL: 0.8252
TP1: 0.7821
TP2: 0.7698
TP3: 0.7513

Why this setup?
Why short now?
- 1D trend is *range*, not breakout—mean reversion is the edge.
- RSI 15m at 48.6 shows no momentum to push through 0.8032 supply.
- Entry ref 0.8006 with TP1 0.7821 is a clean 2.3% drop before any news.
- ATR 1h (0.0103) confirms volatility is low, so the slide will be quiet—perfect for stealth shorts.
- Confidence 55 isn’t max, but the risk/reward to SL (0.8252
SUI+5.45%
Ping Yeh, a software engineering manager at $GOOG Quantum AI, believes useful quantum computing is more than five years away
Hartmut Neven, who heads Google Quantum AI, has said recent results leave him confident that useful applications only quantum computers can handle will arrive within five years
“He is very confident,” Yeh said at the SEMICON forum. “I am a little skeptical. I want to be more conservative.”
post-image
GOOG-1.06%
GOOGL-1.12%
Layout for Bitcoin, Ethereum, and Dogecoin
live-cover
LIVE2,555
  • 1
ADA’s 4h chart is whispering a secret the 1D range refuses to scream—until now.

$ADA /USDT - SHORT

Trade Plan:
Entry: 0.2202 – 0.2214
SL: 0.2265
TP1: 0.2165
TP2: 0.2137
TP3: 0.2094

Why this setup?
Why now?
- RSI 15m at 65.33 shows a micro-pump into resistance—exhaustion fuel for shorts.
- Entry zone 0.2208 sits at range highs; ATR 0.0024 means tight stops, big payoff.
- Confidence 55 isn’t 90—it’s a scalp, not a marriage.
- TP1 0.2165 is a 2% drop; TP3 0.2094 is the real meat if the range breaks.
- If 0.2265 flips, alt targets say 0.2251+—but that’s a different trade.

Debate:
ADA+3.15%
Once Once, Bring out your money and chop life.
Life is good oo 😁😁😁😁
post-image
$MU ‌Micron Technology (MU), a leading player in the semiconductor and memory technologies sector, continues to attract attention in the stock market with the strong demand generated by its artificial intelligence infrastructure investments. The stock gained 5.89% during intraday trading, rising to $1,014.95 for a strong session close.
Corporate Financial Data and Market Indicators
The current market values and trading data for Micron Technology are as follows:
Current Share Price: $1,014.95 (Daily change: +$56.46 / +5.89%)
Market Cap: $1.146 trillion
Intraday Trading Range: Lowest $969.00,
MU+5.89%
NAS100+0.06%
  • 4
  • 1
SKYAI’s 95% short signal is screaming, but the 15m RSI just hit 65—who’s buying this fake bounce?

$SKYAI /USDT - SHORT

Trade Plan:
Entry: 0.06033 – 0.06095
SL: 0.06357
TP1: 0.05844
TP2: 0.05698
TP3: 0.05478

Why this setup?
Why now? The 4h timeframe is loading a bearish cannon, and the daily trend confirms the floor is giving way.
- Entry zone: 0.06064 (tight range 0.06033–0.06095) is your launchpad.
- Targets: TP1 at 0.05844, TP2 at 0.05698—that’s a 6% drop from here.
- Stop at 0.06357 is wide enough to breathe, but tight enough to punish dreamers.
- ATR (1h) at 0.001221 means vo
SKYAI+6.39%
U.S. August nonfarm payrolls “blockbuster”! Rate-cut expectations suddenly cooled?
The U.S. August nonfarm payrolls were indeed a bit “strong.” New jobs came in at 162k, directly blowing past market expectations of just over 50k, while the previous two months’ figures were revised up by a combined 55k. The unemployment rate held steady at 4.1%. On the headline figure alone, this is not a cooling labor market, but one that suddenly stepped on the gas.
The market’s most direct reaction was that the Federal Reserve’s rate-cut logic began conflicting again. Investors had previously bet on an econo
BTC+0.05%
NAS100+0.36%
  • 40
Load More

Join 40 M users in our growing community

⚡️ Join 40 M users in the crypto craze discussion

💬 Engage with your favorite top creators

👍 See what interests you

View More