
Share your thoughts
placeholder
Article
$DASH Signal】1H breaks above the upper Bollinger Band, bullish momentum continues
$DASH RSI 1H 81.36, with the price at 64.26 breaking above the upper Bollinger Band at 62.88. MACD momentum is expanding across both timeframes, with the 4H histogram at 1.84. Bid depth dominates the order book, with a Bid/Ask ratio of 1.73, and the funding rate at 0.01% shows no signs of overheating. OI is stable, with no signs of short-side resistance.
🎯Direction: Long
⚡Entry/limit order: 64.0672 - 64.2600
🛑Stop-loss: 63.6174
🚀Target 1: 65.2239
🚀Target 2: 65.7059
🛡️Trade management:
- Execution strategy:
post-image
DASH+41.07%
Does $BSV Bsv have a trend similar to ZEC? 🤦🤦🤦
BSV+0.59%
👀 I’m keeping $TRUMP /USDT on my radar here.
The chart looks like it’s trying to build momentum again after that sharp flush. Price has climbed back above the short-term moving averages, but I’m not chasing the move I want to see buyers prove they can hold the breakout area.
📍 Entry Zone: $2.30 – $2.34
🎯 TP1: $2.42
🎯 TP2: $2.50
🎯 TP3: $2.58
🛑 Stop Loss: $2.24
If $2.34 holds as support, the next push toward the previous resistance zone could get interesting. ⚡
My approach: patience on the entry, partial profits on the way up, and strict risk control if the setup breaks down.
⚠️ Disclaime
post-image
TRUMP-0.45%
Scumbag Watch Episode 4, 26.9.05, Beijing time 8:30
Figure 1: CRCL daily candlestick chart
U.S. stock closing price: 102.05; intraday high: 102.785; low: 97.10; down 1.14%
CRCL opened lower and moved higher yesterday. It still looks relatively strong for now. After filling the small gap around 104, another push toward 120 is not out of the question.
Figure 2: SOL daily candlestick chart
SOL closed above the 5-day moving average. Going forward, continue to monitor whether the 100 level will be decisively broken below again.
CryptoPlayerWithBadIntentions
Jerk Watch, Issue 4, 26.9.04 Beijing time 8:15
Figure 1: CRCL daily candlestick chart
U.S. stock market closing price: 103.23; intraday high: 103.28; low: 91.70; up 16.46%
As the jerk expected, crcl has no problem as long as it does not effectively break below the large bullish candlestick formed previously.
But today's performance did exceed the jerk's expectations, rising over 16% and nearly closing at the high. It completely made it impossible to get on board. So whether it can directly challenge the 150 level next, please wait and see patiently.
Figure 2: SOL daily candlestick chart
After sol found support at the upper boundary of the range, today's daily close provided strong confirmation. We will wait and see whether it will challenge the previous high again next.
Currently, crcl has also broken through the 100 mark. Of course, the SOL line was the one that reached the 100 mark.
The jerk is now launching a new prediction: which one will be the first to reach 150? Leave a comment and repost to participate.
Total prize pool: 200U
repost-content-media
CRCL-1.17%
SOL-1.61%
What is the curse of knowledge?
post-image
A few days ago, I was still calculating whether I had enough money for instant noodles this month. This morning, I was already wondering whether to add a sausage. Right after reading the bearish news, I noticed something was off with the market. $CFG bounced back, but the volume failed to follow, with insufficient support—a typical weak rally. I know this kind of market action all too well: any move up is just handing money to the bears.

I decisively entered a short at 0.30073, and it has now reached 0.10002, with a +661.94% return. What does comfort feel like? This is comfort.

As for the
post-image
CFG-5.62%
DOGE-2.72%
LAB+0.77%
near finished charging and launched! #Gate用户突破6000万
This move is so obvious, I don’t even need to think—the account is dancing on its own.

Right after lunch, when I checked the chart, it made another push upward, but the buying strength was clearly insufficient. The candlesticks looked like they were stepping on cotton, bouncing up and softening back down. A rebound without enough support can’t last long. I went short directly around 0.08695. The entry cost wasn’t high, and I had a stop-loss in place; the rest was left to time.

Now at 0.08222, +107.11%. This short-side move paid out cleanly and decisively—feels great.

Close 80% first and
post-image
SNDK+11.26%
BNB+0.06%
$MARSCOIN Who has made it in crypto! Those who truly profited probably had odds similar to winning the lottery! They started out making money, but eventually lost even their entire principal! They know it's a scam, yet everyone is still playing!
MARSCOIN+36.00%
Why has ZEC surged 70-fold so crazily? It previously fell from 860 to 15, and now it has risen from 15 to 1026.
post-image
ZEC+8.30%
After a rapid surge, heavy profit-taking has exited the market, releasing short-term selling pressure and sending the market into a pullback and consolidation phase.
The bulls’ upward momentum has clearly weakened, with risks accumulating at elevated levels. Chasing the rally to go long is not advisable at this time.
In the short term, the market will oscillate and pull back to digest gains. Even if there is a slight rebound, it will mostly be a brief technical recovery. A new rally will require time for a shakeout and for bullish momentum to build. Do not blindly chase highs at this stage; wa
post-image
BTC-1.63%
ETH-2.01%
[New stremer ]BTC
live-cover
LIVE549
🟢 $ONDO is quietly setting up and that’s exactly what caught my eye.
I’m not interested in the noise around this chart. The interesting part is the reclaim: price has pushed back above the short-term averages after defending the lower range. Now I’m watching whether buyers can turn this bounce into a proper continuation.
Trade Map 👇
🎯 Entry Zone: 0.3600 – 0.3650
🚀 TP1: 0.3720
🚀 TP2: 0.3800
🚀 TP3: 0.3900
⛔ Stop Loss: 0.3530
The 0.3720 area is the first real test. A clean break with volume could open the door toward the higher targets. If price loses the entry structure, I’d rather step as
ONDO+0.74%
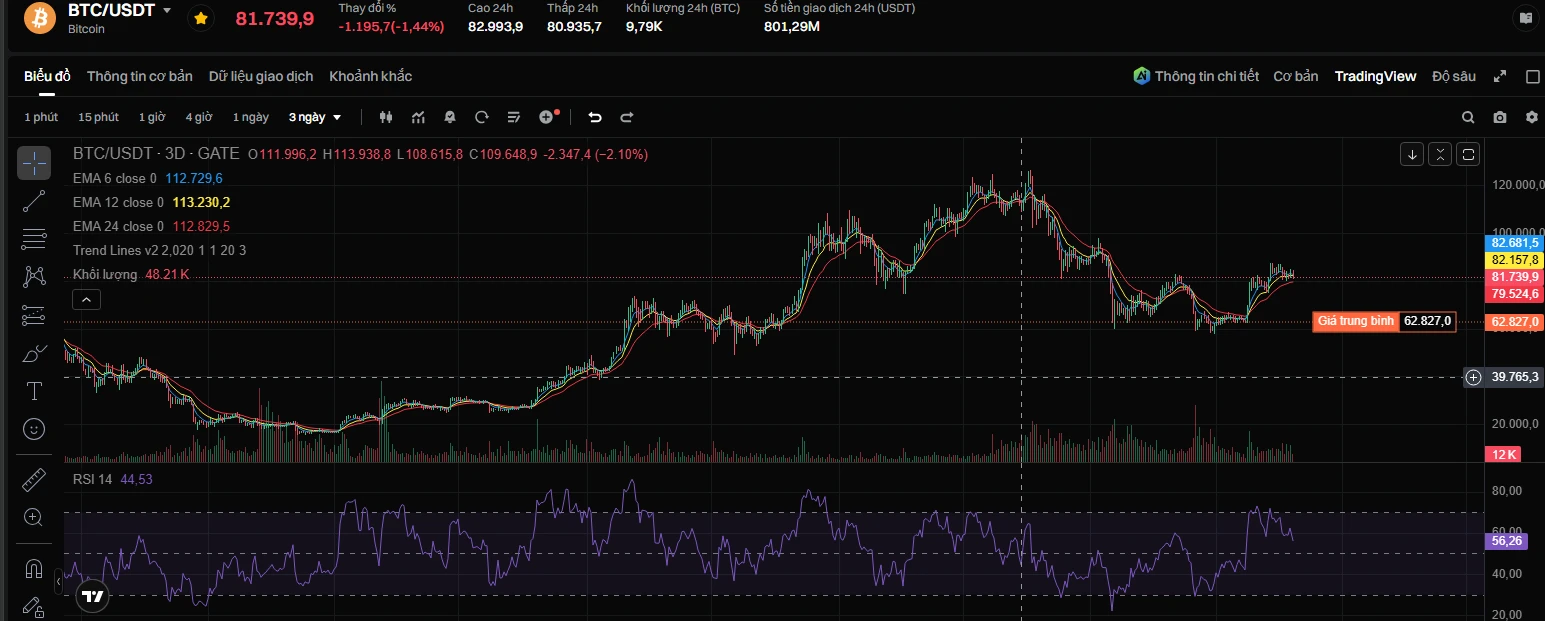
A Brief Analysis of BTC’s Short-Term Trend from Dow Theory, Chan Theory, Elliott Wave Theory, Volume-Price Relationships, Order Flow, and Price Action
I. Dow Theory
Primary trend (1-hour timeframe): The primary downtrend from the historical high of 82,814 on May 6 confirmed a trend reversal in mid-August. The price began a strong rebound from the August 14 low of 62,488. After forming a double bottom at 63,979 at 03:00 on August 18, the bulls launched an epic rally. The price surged from 63,979 to the August 28 high of 81,346.95, setting a new high for the current phase, for a cumulative gain
BTC-1.63%
The recent BTC surge has clearly livened up the group again😀😃
But now I’m actually a little afraid to chase.
It’s not that I think the rally is over, but after every rapid rise like this, people’s emotions change incredibly fast.
People who were asking yesterday, “Could it fall below $70k?” have started asking today, “When will it reach $100k?”
This shift is actually quite interesting.
Right now, I’m only watching one thing:
When BTC pulls back, is anyone willing to buy?
If it just keeps surging and everyone is chasing, I’d rather take it slower.
If it really pulls back, the market doesn’t p
post-image
GER40+0.07%
Everyone’s staring at $BTC /USDT’s range—but the 4h clock just started ticking for a trap.

$BTC /USDT - SHORT

Trade Plan:
Entry: 79474.9 – 79706.1
SL: 80699.9
TP1: 78758.5
TP2: 78203.8
TP3: 77371.8

Why this setup?
Why now? The 1D trend is sideways, yet the 4h MTF flips SHORT at 79,590 with only 55% conviction. RSI 15m sits at 47.8—no momentum, just drift. ATR 1h at 462 means we’re in a compression coil. Entry zone 79,474–79,706 is the line: break below 78,975 invalidates the short fast, but hold here and TP1 at 78,758 is a 1% scalp before the real drop to 77,371. This isn’t a trend trade
BTC-1.70%
Everyone’s staring at WLD’s 0.389 support—but what if that’s the exact spot the whales are waiting to fade?

$WLD /USDT - SHORT

Trade Plan:
Entry: 0.388 – 0.390
SL: 0.402
TP1: 0.379
TP2: 0.373
TP3: 0.364

Why this setup?
- 4H bias is SHORT with 55% confidence, but the 1D trend is *range*, not downtrend—so this is a scalp, not a saga.
- RSI on 15m is already overheated at 70.6—buyers are tired right as price kisses the range mid.
- ATR on 1h (0.0053) is tight—the breakout from 0.389 will be violent; don’t chase, wait for the rejection candle.
- Why now? Price is at the exact entry_ref
WLD-1.50%
$GT — This Level Could Decide The Next Move 👀🔥
GT is back around $8.50, and buyers are starting to show some strength.
But I’m watching one thing before getting aggressive:
Can GT hold $8.50?
If yes, I’d be looking for a move toward the recent resistance and then potentially higher.
🟢 Entry: $8.40 – $8.60
🛑 SL: $8.15
🎯 TP1: $8.90
🎯 TP2: $9.20
🎯 TP3: $9.60
The real trigger for me is $9.00.
Break $9 with volume and hold it → that’s where I’d expect buyers to get more confident. 🚀
But if $8.15 breaks, I’m not forcing the trade. I’d rather take the small loss and wait for a better setup.
post-image
GT-0.87%
  • 5
  • 2
Makes sense!!
Makes sense!!
Load More

Join 40 M users in our growing community

⚡️ Join 40 M users in the crypto craze discussion

💬 Engage with your favorite top creators

👍 See what interests you

View More