Share your thoughts
placeholder
Article
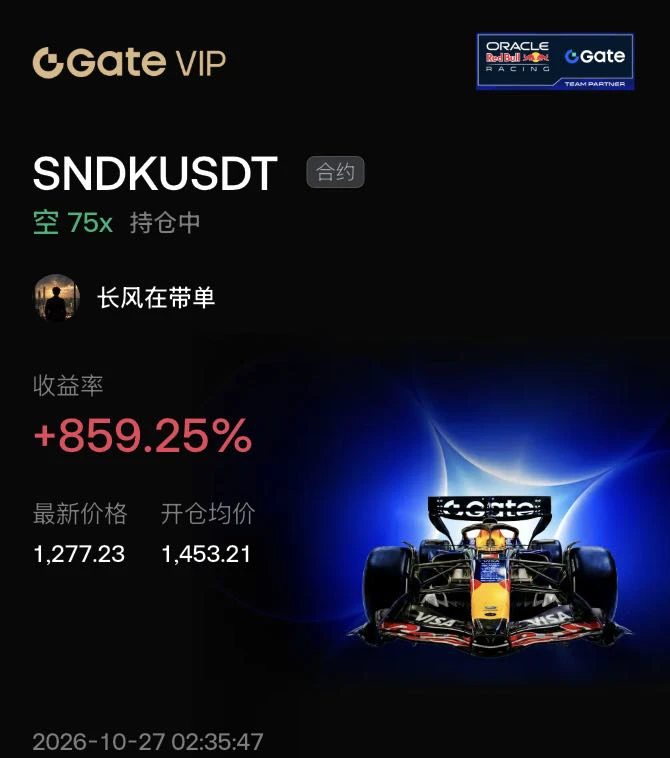
Some trades are just like this: the more you watch them, the less they move; the moment you turn away, they take off.

When I opened the chart this morning, $FOLKS was consolidating at the bottom and had not broken the key level. I advised against chasing and said to wait for a pullback. Now it has moved from 1.975 to 2.059, with a return of +204.97%. Feels really great. Those already on board should be waking up laughing.

Take 80% profit first and protect the remaining 20% at the entry price. If it keeps surging, let the profits run—don't be greedy for the very last bit.

Have a strategy
post-image
FOLKS-2.85%
SOL-2.45%
ETH+0.30%
🔥 Are You Buying Gold Just Because You See a Line or Pattern on the Chart?
And then wondering why the market keeps washing out your account?
Or maybe you bought the Japanese Yen after hearing that Japan was raising interest rates — only to watch the market move in the opposite direction.
The biggest problem for many traders is simple:
They trade incomplete news and indicators while smart money watches the numbers behind the market.
Today, let’s break down the bigger picture. 👇
🇯🇵 JAPAN'S ECONOMIC TRAP
The Bank of Japan has raised rates to 1.25%, its highest level since 1995.
But instead of
post-image
MU+3.80%
BTC+0.29%
XAU-0.20%
  • 2
  • 1
I'm trading on Gate, a top-tier exchange with a 13-year track record. Come join me and dive into the hottest events right now! https://www.gate.com/campaigns/6093?ch=7639&ref=VFAVA1LYUG&ref_type=132
post-image
  • 5
$SOLV SOLVUSDT Forming Bearish Pattern
SOLVUSDT is forming a clear bearish pattern, a classic bullish reversal signal that often indicates a drop. The price has been consolidating within a narrowing range, suggesting that selling pressure is weakening while buyers are beginning to regain control. With consistent volume confirming accumulation at lower levels, the setup hints at a potential bullish breakout soon. The projected move could lead to an impressive gain of around 10% to 20% once the price breaks above the wedge resistance.
This bearish pattern is typically seen at the end of downtren
post-image
SOLV+14.15%
The trending search is back, but leverage hasn’t followed: this FIL move is genuinely built on volume
Damn, $FIL surged over 20% in a day and hit the trending searches—I’m bullish, but only buying dips, not chasing! Currently at 1.0886, with 24h volume of 32.08 million USDT and a volume ratio of 2.67x.

My view: bullish on the daily chart; no adding before 1.0967 breaks out.

First, leverage hasn’t entered the table: the funding rate is neutral at 0.0001, and OI is only up 0.03% from the 09-14 archive, making a sudden liquidation squeeze unlikely.

Second, the structure is healthy: MACD ha
FIL+14.03%
$BR is being manipulated! It hit my original entry price three times, but still wouldn’t let me break even? Whoever plays this coin is doomed!!!
post-image
BR+23.85%
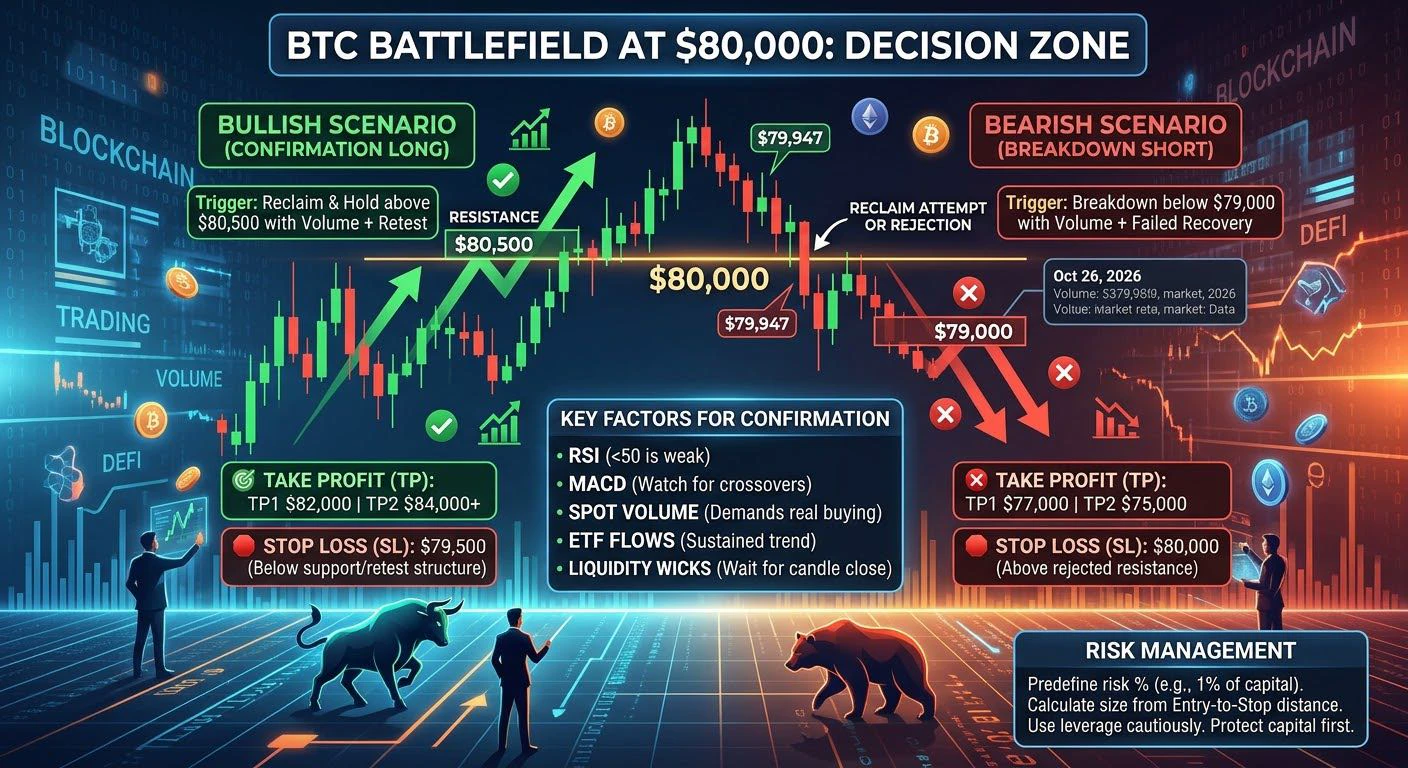
#weeklyshare Bitcoin (BTC) Market Analysis
Bitcoin is trading around $81,200–$81,300, after rebounding from the ~$75K area. BTC recently reached roughly $81,700, making this an important resistance zone.
Current Structure
* Current price: ~$81.2K
* Resistance: $81.7K–$82.2K
* Next resistance: $84K–$86K
* Support: $80.8K
* Major support: $77.5K–$78K
* Critical support: ~$75K
The daily structure remains constructive, but momentum needs to strengthen for a sustained breakout.
Bullish Scenario
A confirmed daily close above $82K could open the way toward $84K–$86K. Strong trading volume would provi
BTC+0.35%
ZEC Surges Past $1,480—The Real Reason..
ZEC just hit a new local high near $1,595, while 24-hour trading volume currently stands at an astonishing $2.86 billion—this is definitely not normal price action.
The drivers are as follows: BlackRock? No, it was Grayscale’s Zcash spot ETF (ZCSH), which launched in late August and has already surpassed $500 million in AUM. But the real catalyst is the Ironwood upgrade—a network repair designed to restore trust after the Orchard vulnerability scare. Add a $44 million short squeeze from traders betting on ZEC’s decline, and you get a textbook parabolic
post-image
ZEC+1.32%
BLK+1.45%
BTC+0.29%
Fear & Greed Index at 71, still in the greed zone, BTC holding above $80k—why is $RAY still unable to move?
The answer lies in the structure: the broader market is "greedy but losing momentum." BTC is currently at 81425.7, with MA5 already crossing above MA20, RSI at 62.6 and relatively strong, and the funding rate at +0.0073%, indicating that longs are still paying to maintain positions. However, the MACD histogram at -102.3 shows marginally fading upside momentum. In this environment, capital is more willing to stay in major assets rather than rotate into small- and mid-cap assets. $RAY is c
post-image
BTC+0.29%
To be honest, I’m surprised this trade has survived until now—it involved a fair bit of luck.
A few days ago in the early hours, I was watching $2Z . The key level held, and it stabilized again after the pullback. I only gave one signal at the time: go long. I didn’t expect it to actually deliver.
Grinding from 0.04895 all the way to 0.05063, it gave us a +165.4% answer. That profit felt great—staying up late wasn’t for nothing.
The market is won by waiting, and profits are made by holding. Putting risk controls in place upfront is rational; cutting after taking a loss is a decisive act.
Take 8
post-image
2Z+3.34%
SNDK+2.46%
ZEC+1.40%
society is so cooked and broke that 45000 people are forced to watch someone else buy an iPhone 18 cause they can't even afford to even klarna one
meanwhile stocks are at all time highs
something is not right
post-image
$FIL
1.094 If this bomb doesn’t break through, it’s a straight-up bagholder slaughterhouse😤 Those weak-handed storage traders ran long ago; the bulls are stubbornly holding the 1.006 trench, and a short-side stampede could erupt at any moment. With the current price pressing right up against resistance, is this the main force shaking out holders or a genuine breakout? If 1.006 doesn’t hold, it’s straight to the ICU; if it breaks through 1.094, no excuses—just send it🚀
post-image
FIL+14.03%
Those with reset cards, remember to use them.
post-image
$ZEC One of the strongest market moves.
From around $180 in March to over $1,580 now… nearly an 8x gain. After such a strong bullish rally, a pullback is normal. This latest leg seems increasingly momentum-driven: breakout chasing and short covering may be adding further fuel. After spiking to $1,595, some cooling off is completely normal. The real test will come after volatility subsides: $ZEC can it hold these higher levels and establish genuine demand? At $1,580, the risk is completely different from when it was $180. Don’t blindly chase the rally. Trade long $ZEC.
post-image
ZEC+1.32%
Smart money is quietly loading SYMBOL while the retail crowd panics.

$BNB /USDT - LONG

Trade Plan:
Entry: 762.1 – 764.5
SL: 751.9
TP1: 771.9
TP2: 777.6
TP3: 786.2

Why this setup?
Why now? The daily trend is firmly bullish, and the 1h price sits precisely at the entry_ref of 763.3, which is the exact sweet spot between the entry_low of 762.1 and entry_high of 764.5. The 1h ATR of 4.761929 shows the current volatility is compressed, setting up for a explosive move toward the first target at 771.9 and the second target at 777.6. The 15m RSI reading of 41.67 confirms there is no overbought e
BNB-0.53%
$BR
Are you still performing the “imitation” near the 1.2 Bedrock after that brutally rejected moment? Your greed has been stabbed in the wrist, yet you stubbornly continue craving liquidity from whales exiting, so our elite short sellers can feast on your tears? Trading signal: $BR : Short entry: $1.18500 - $1.21500 Stop-loss: $1.26500 Take-profit targets TP1: $1.09000 TP2: $0.95500 TP3: $0.82500 The severe volume-spike “surge-and-retracement-style” long-upper-wick rejection near the 1.22 resistance level, combined with the clear volume divergence and extreme detachment from the EMA7, almost
post-image
BR+23.85%
$ETH ETHEREUM: Third Historical Descending Wedge Fractal.
In my analysis, I have spotted the recurring underlying bullish fractal formations ETHUSD is forming. Now, we are at a point where ETHUSD is just in the fourth historical fractal formation. In my chart and analysis, I have spotted all the important factors to consider now.
When looking at my chart, we can see how ETHUSD is trading within this gigantic channel formation. It has strong support at the lower boundary. The most important parts of this whole structure are the several historical descending wedge formations. ETHUSD has always c
post-image
ETH+0.30%
ETH MARKET UPDATES
live-cover
LIVE20
Everyone is about to learn a painful lesson with $ONE /USDT right now.

$ONE /USDT - SHORT

Trade Plan:
Entry: 0.003096 – 0.003220
SL: 0.003929
TP1: 0.002580
TP2: 0.002195
TP3: 0.001617

Why this setup?
Why now? The 1h price sits at 0.003170 inside a tight range, and the 15m RSI at 70.3 shows momentum is stretched to the upside even though the daily trend is flat. The 1h ATR of 0.000247 confirms that volatility is compressed, which often precedes a sharp directional move. The entry zone between 0.003096 and 0.003220 lines up perfectly with the short bias, giving a precise trigger. If the mo
ONE+140.09%
  • 3
BTC ETH and Altcoins
live-cover
LIVE621
Load More

Join 40 M users in our growing community

⚡️ Join 40 M users in the crypto craze discussion

💬 Engage with your favorite top creators

👍 See what interests you

Trending Topics

JapanRealEstatePowerChipStocksRise

59.64k Views4.5k Discussing

Japan's Nikkei extended gains on Sept 18, with real estate, power, and semiconductor sectors leading. Gate covers over 12,800 global stocks and ETFs, offering one-stop USDT trading across US, HK, Korean, and Japanese markets. [👉 Read more](https://www.odaily.news/en/newsflash/518749)

USAIConceptStocksRally

34.36k Views1k Discussing

GateTopsStockPerpetualCoverage

38.62k Views2.59k Discussing

View More