
Square
Following
Hot
News
Notifications
Profile
Share your thoughts
placeholder
Article
11.09 ETH Trade Idea Review

Yesterday, I planned to build short positions in the 2160-2180 range. The market remained in an overall bearish divergence pattern, and I planned to wait for a rebound to play out before following the trend.

I was right about the overall downward direction, but I overestimated the strength of this rebound. The price never reached my planned entry range.

It almost reached the ideal level. What a shame$ETH #美国10月CPI即将公布
ETH-1.23%
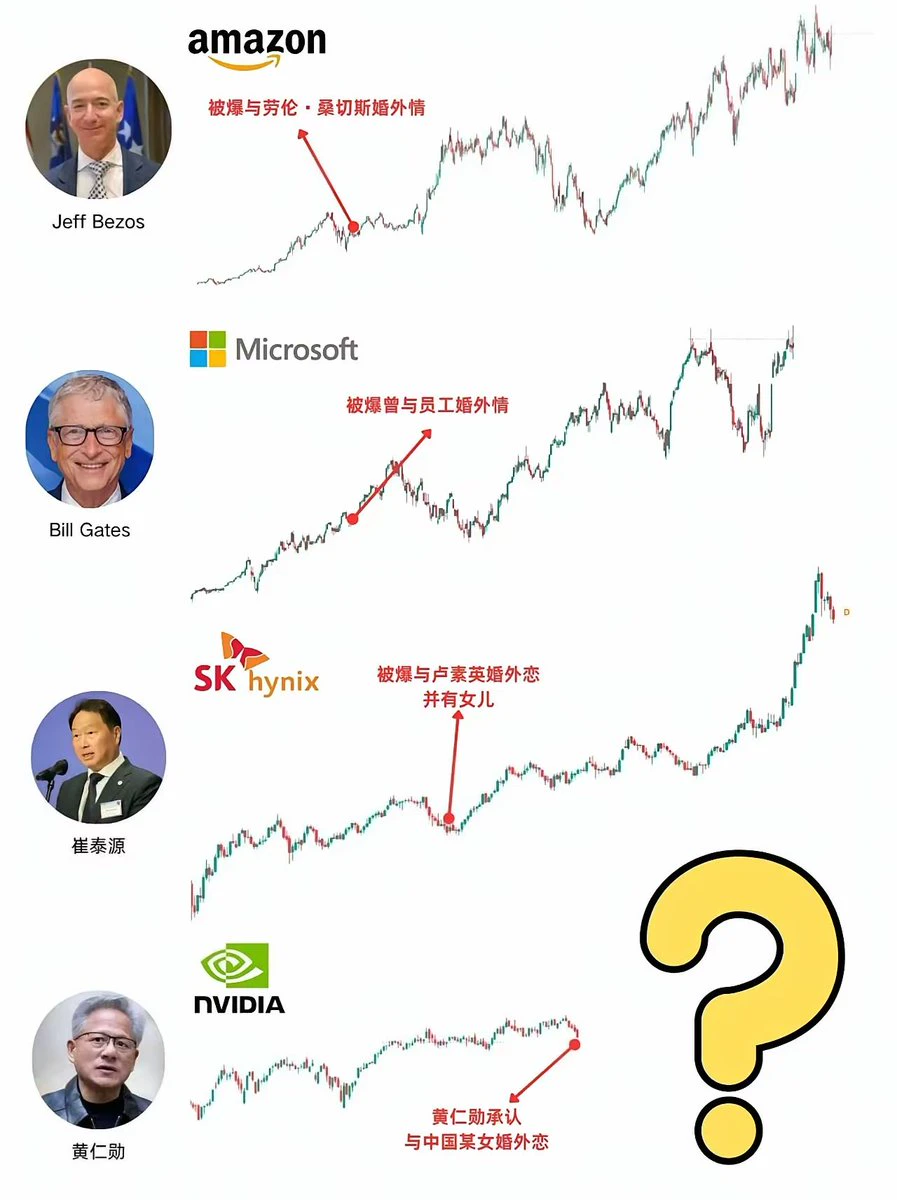
Once all the bad news is out, it’s good news.
Is NVIDIA about to pull the same move too?
post-image
NVDA-4.34%
Trenches
牛逼
牛
bade
b
牛逼
0x96...7777
Market Cap
$.
Change
.
24h Vol
$.
Holders
.
PIEVERSE
P
bade
b
PIEVERSE
0x0e...25a9
Market Cap
$.
Change
.
24h Vol
$.
Holders
.
STONK
S
bade
b
STONK
6GmA...UNgx
Market Cap
$.
Change
.
24h Vol
$.
Holders
.
ON
O
bade
b
ON
0x0e...1d48
Market Cap
$.
Change
.
24h Vol
$.
Holders
.
FLOAT
F
bade
b
FLOAT
Bv1a...BMmr
Market Cap
$.
Change
.
24h Vol
$.
Holders
.
Morning and BTC
live-cover
LIVE1,686
11.10 SOL Market Analysis

Short: 86.80-87.30 area, stop loss at 88.30, targets 85.00/83.50.

SOL is currently at 86.10. The market just hit a new low of 85.89. The broader trend remains under bearish pressure, and the rebound is struggling.

There is limited room to chase shorts at this level, and doing so could leave you on the back foot. The 86.80-87.30 area above is a confluence resistance zone formed by short-term moving averages and positions accumulated around the previous range. There’s no need to rush into the next move. Focus on how price behaves when it rebounds into this range. If
post-image
SOL-0.74%
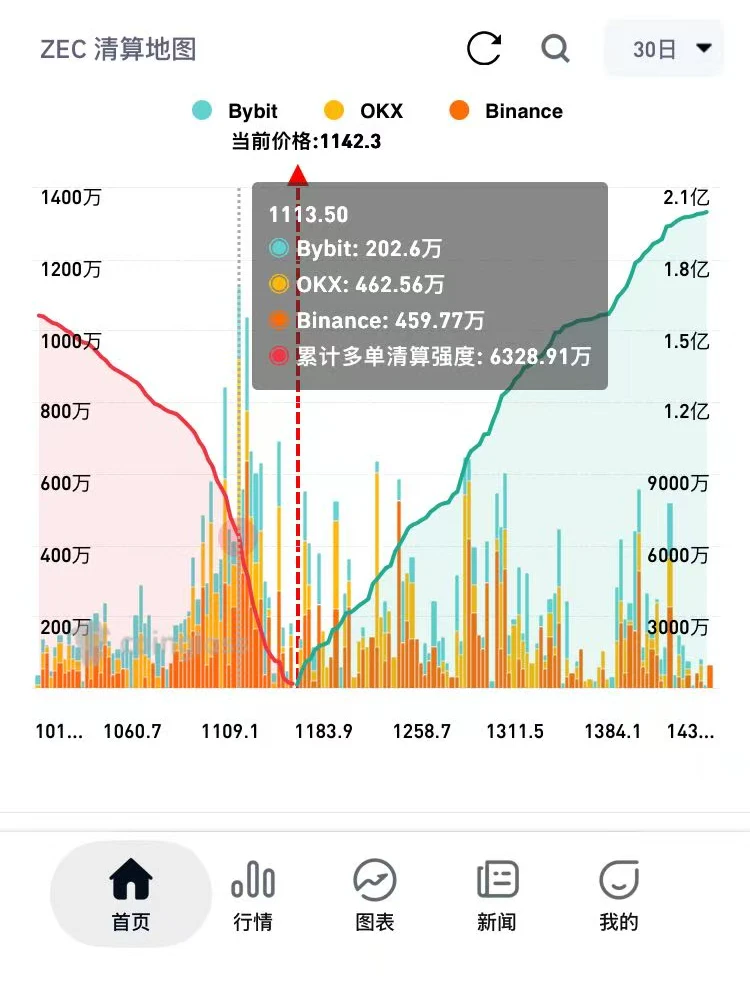
$ZEC The 7-day liquidation map shows:

1. If ZEC falls to $1,113.5, cumulative long liquidation intensity reaches as high as $63.28 million.
2. If ZEC falls to $1,089, cumulative long liquidation intensity reaches as high as $109 million!
3. If ZEC falls to $1,065, cumulative long liquidation intensity reaches as high as $126 million.

4. If ZEC rises to $1,236, cumulative short liquidation intensity reaches as high as $45.8 million.
5. If ZEC rises to $1,307, cumulative short liquidation intensity reaches as high as $124 million.
6. If ZEC rises to $1,414, cumulative short liquidation intens
post-image
ZEC+1.29%
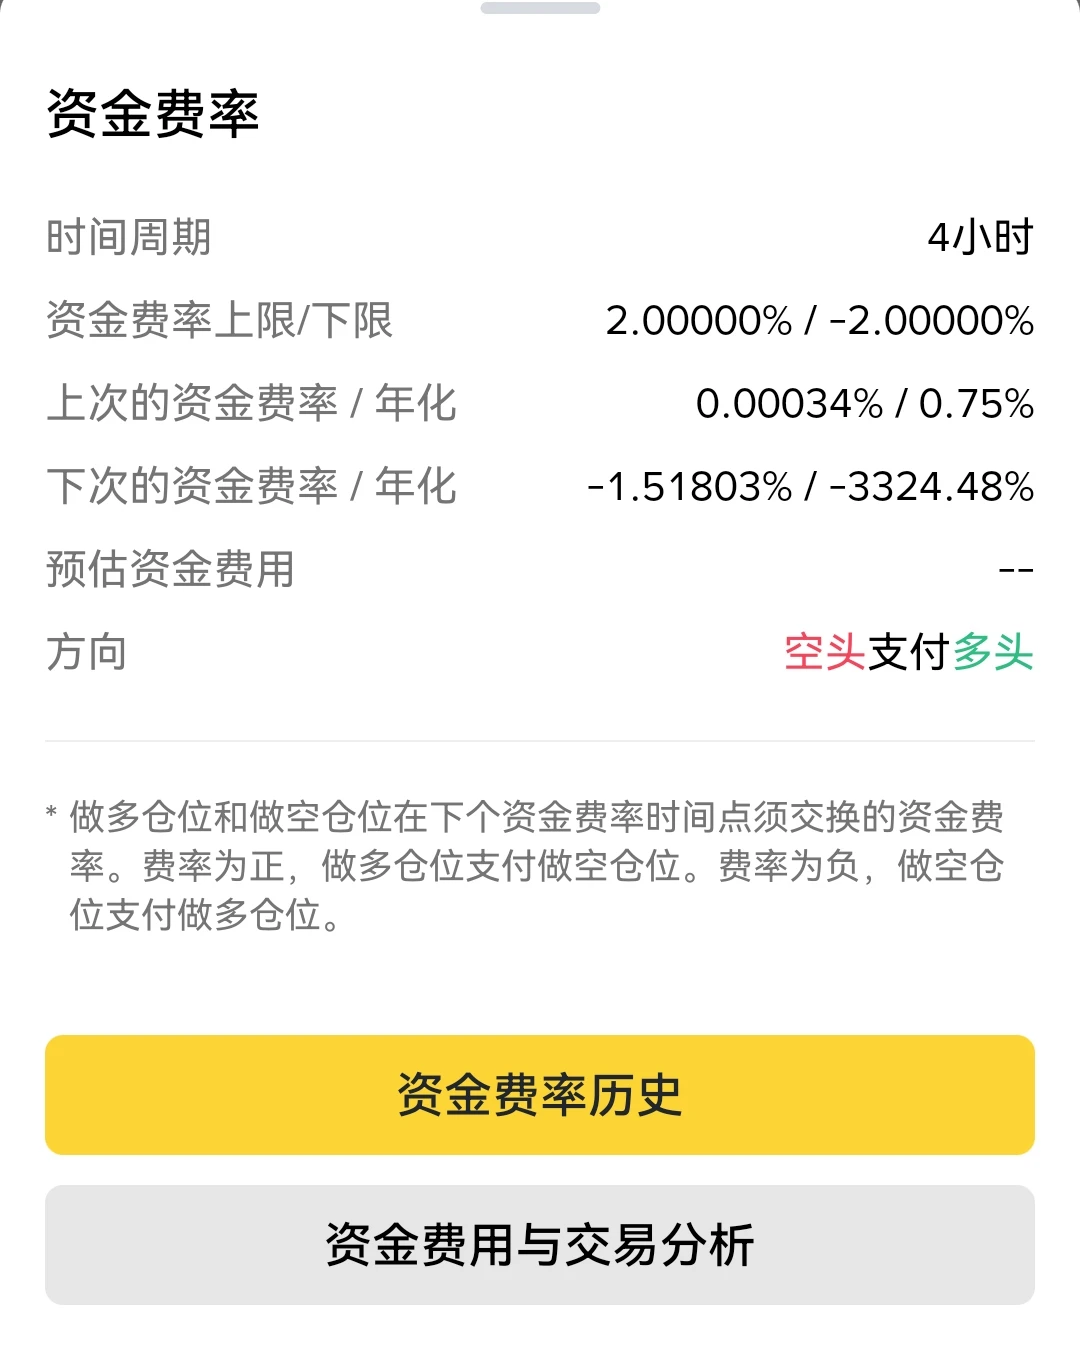
The annualized rate on the coin next door is 3000—absolutely outrageous. What does a -1.5% funding rate on Unitree Technology mean? If you opened a 100u short position with 10x leverage, you’ll be charged shortly at 12: -1.5%*100*10=-15u.

If you have a position, go check how much funding you’ve earned—or how much has been deducted?
post-image
Do the opposite of me in live trading. I’ll post trades from time to time over the coming period, so seize the opportunity
post-image
Hut 8 (@Hut8Corp) transferred another 1,617 $BTC ($121.43M) 2 hours ago, possibly to sell.
In October, Hut 8 sold 2,148 $BTC ($175.4M) at an average price of ~$81,657 to fund share buybacks.
HUT+8.24%
BTC-0.67%
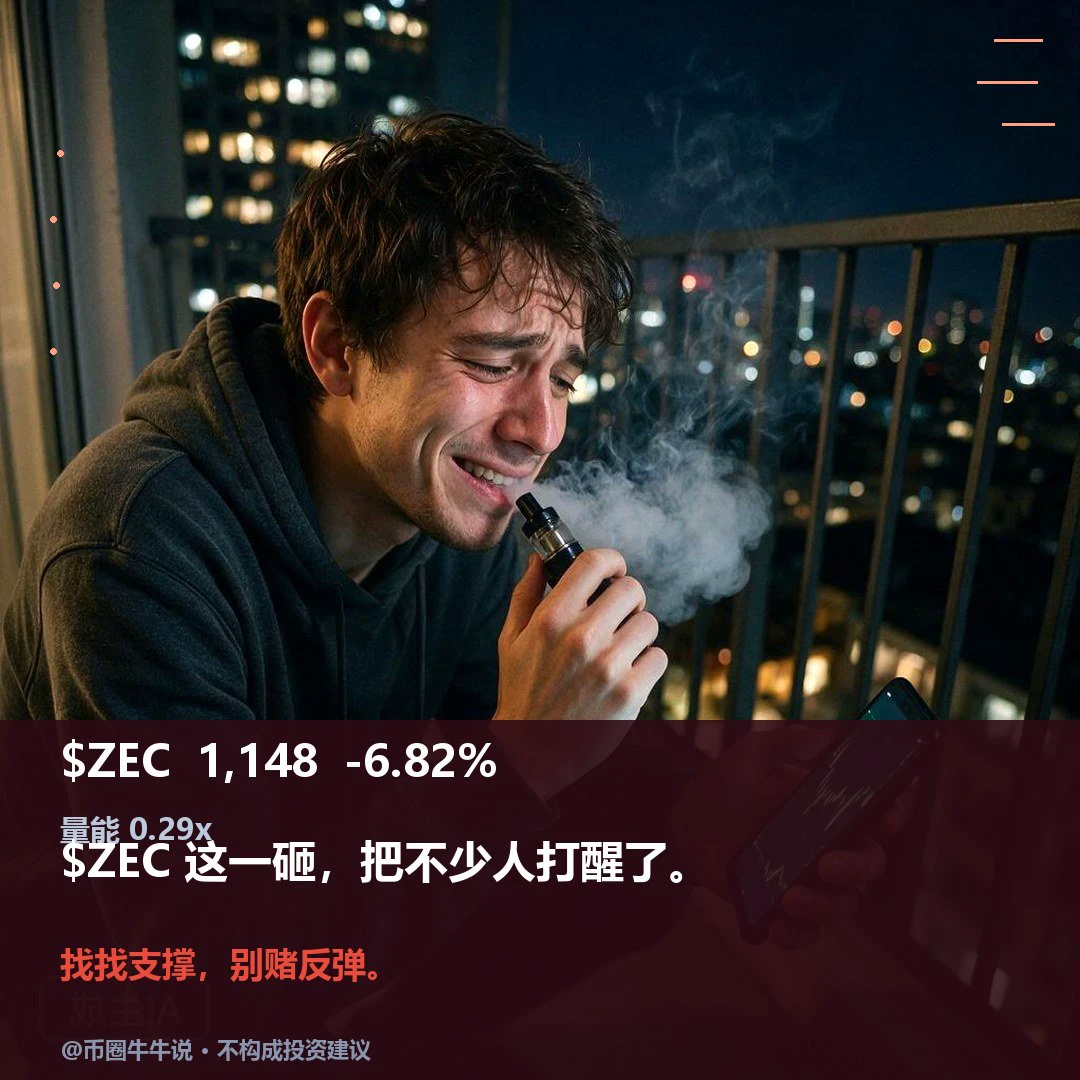
$ZEC Currently trading at 1148.37, down 6.82% over 24H. The 1H and 4H structures are both weak, with price below EMA20 on both time frames and RSI at around 21 and 27, respectively, indicating significant short- to medium-term pressure. Current volume is only 0.29x the average volume of the last 20 candles, suggesting little participation in the rebound.
Conditions to watch: If price can hold above resistance at 1242, the strength of the recovery can be assessed; if it breaks below support at 1142.34, the weakness may continue.
In the follow-up review, focus on whether volume expands when pric
post-image
ZEC+1.16%
November 10: ETH remains weak after an oversold rebound; short at resistance in line with the trend
[Today's Trading Plan]
Entry timing: Wait for the price to rebound to 2140–2160
Stop-loss: 2180
Take-profit targets:
First target: 2090–2070
Second target: 2055–2030
[Key Takeaway]
Driven by falling oil prices easing inflation concerns, U.S. stocks staged a sharp rebound on Monday, with the Dow up +2.15%, the S&P 500 up +2.35%, and the Nasdaq up +2.74%, while risk appetite clearly recovered. But the key divergence is that while U.S. stocks surged nearly 3%, crypto remained weak: ETH rebounded to
post-image
ETH-1.26%
8848 diamond-encrusted phone
post-image
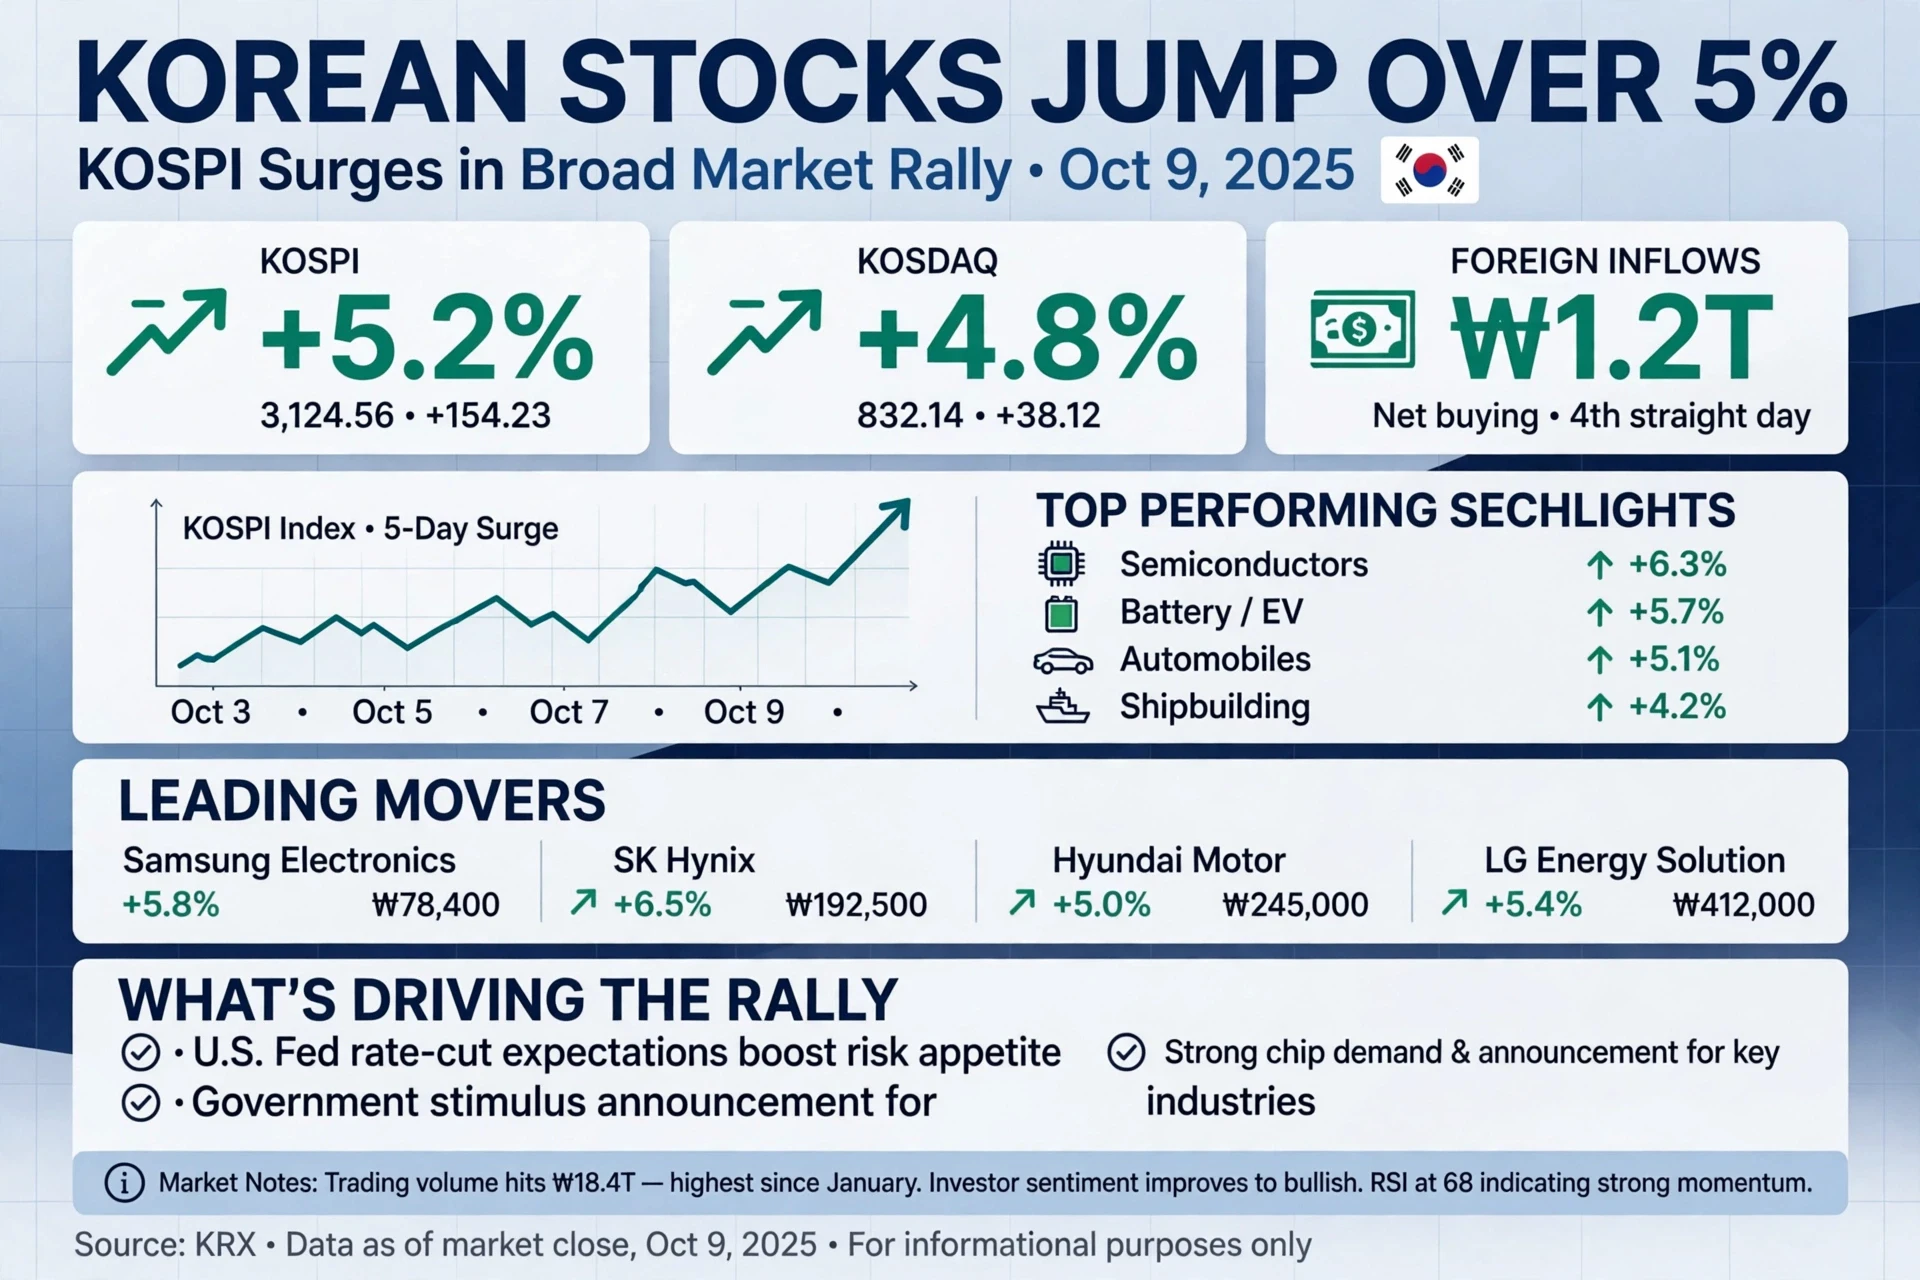
#KoreanStocksJumpOver5% — KOSPI Roars Back in Powerful Broad Rally*

South Korean equities staged a stunning breakout today, with the KOSPI surging *+5.2% to 3,124.56 (+154.23 points)* — its strongest single-day gain since early 2024. KOSDAQ followed with *+4.8% to 832.14*.

The rally was broad-based and volume-backed. Trading volume hit *₩18.4T*, the highest since January, as foreign investors net bought *₩1.2T* for a fourth consecutive day, flipping sentiment to outright bullish.

*Top performing sectors led the charge:*
Semiconductors +6.3%, Battery/EV +5.7%, Automobiles +5.1%, Shipbuilding
post-image
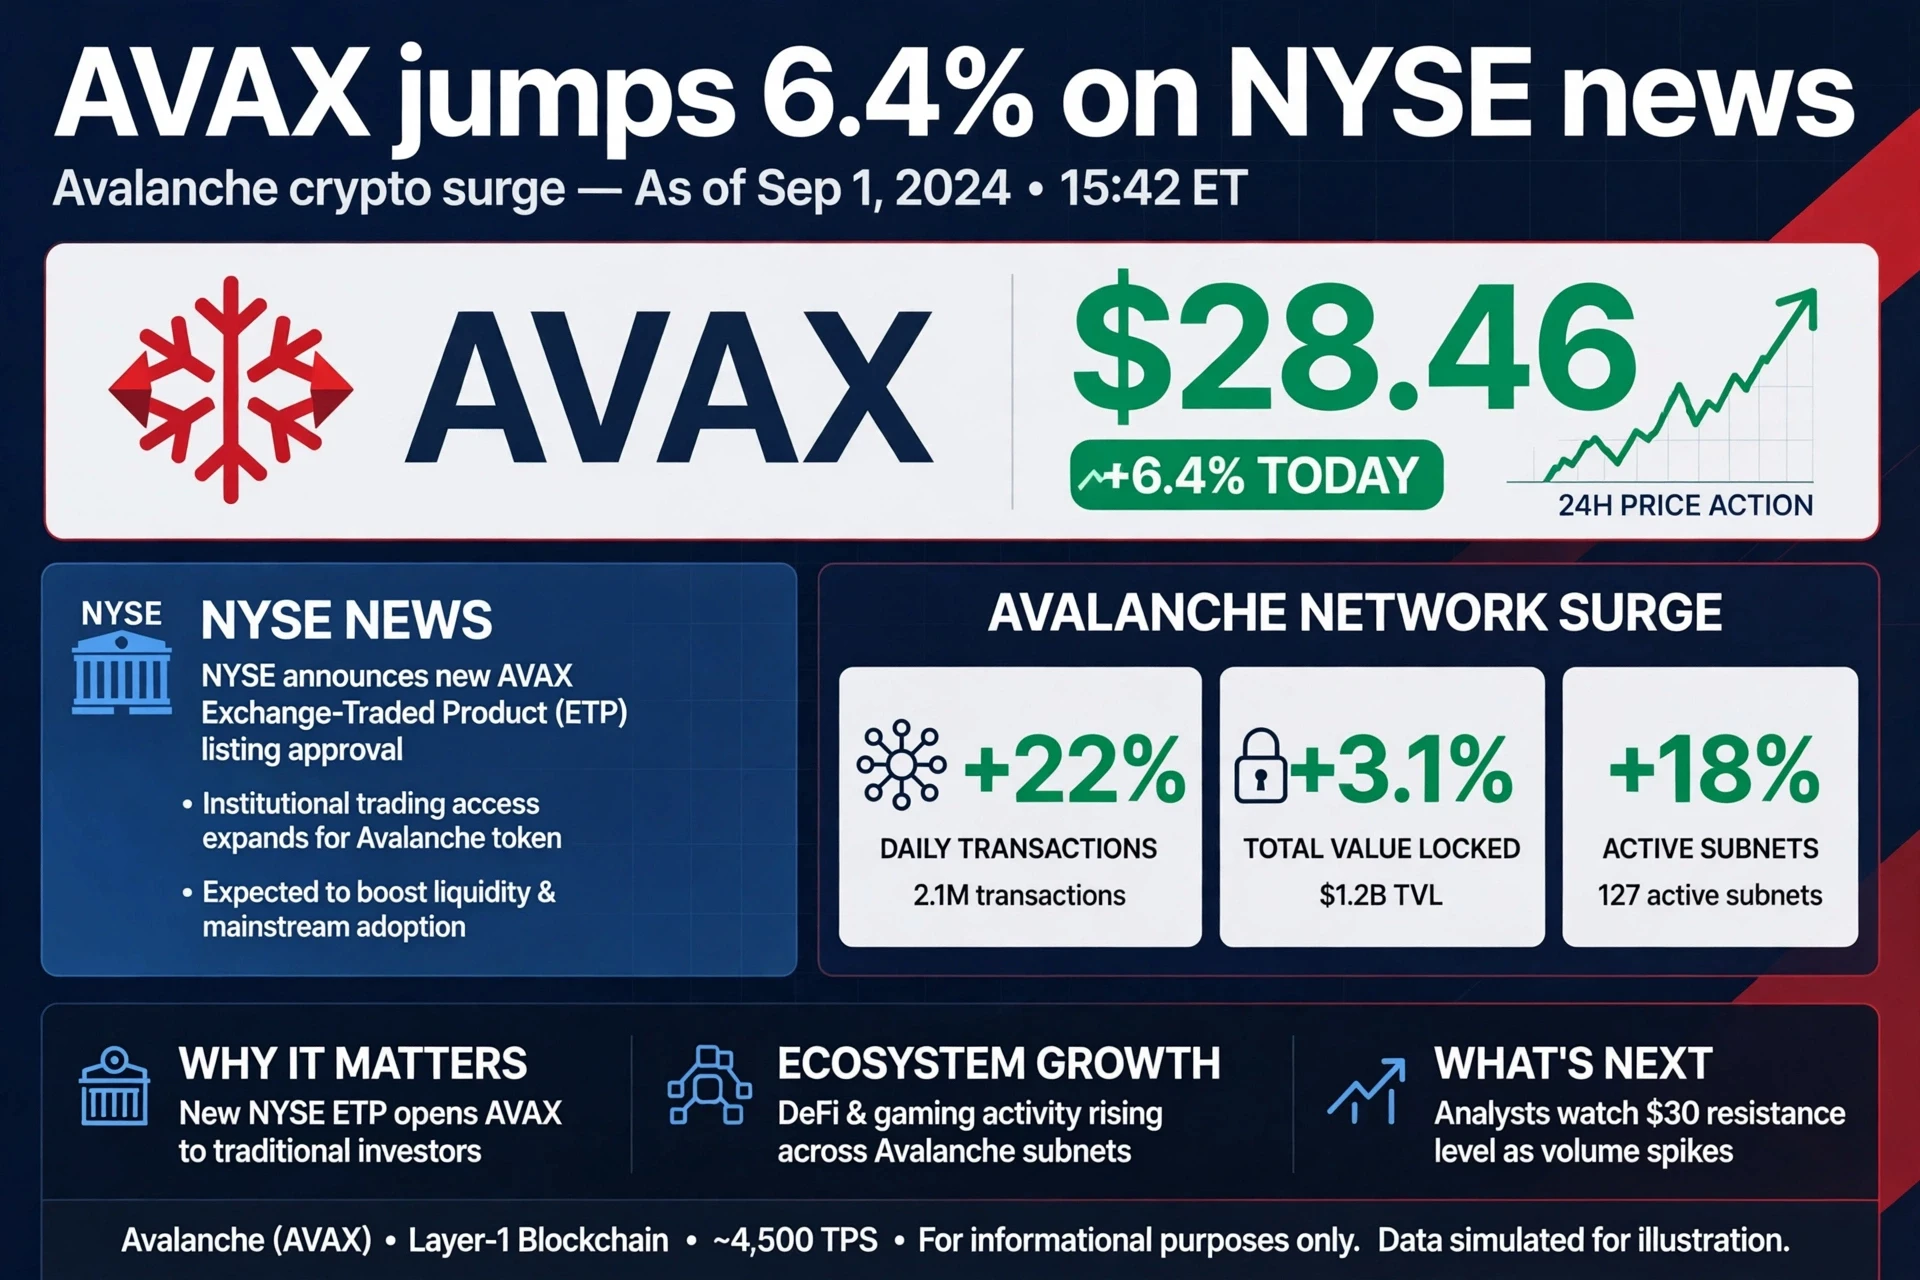
#AVAXJumps6.4%OnNYSENews — Avalanche Surges on Institutional Catalyst*

Avalanche (AVAX) is up *+6.4% to $28.46*, following major NYSE news — NYSE announced approval for a new AVAX Exchange-Traded Product (ETP) listing as of 15:42 ET on Sep 1.

This is a landmark development. The new ETP significantly expands institutional trading access for the Layer-1 token, expected to boost liquidity and accelerate mainstream adoption by opening AVAX to traditional investors.

*The move is backed by strong on-chain fundamentals:*
Avalanche network daily transactions are up +22% to 2.1M, Total Value Locked
post-image
AVAX-0.10%
What Is the Difference Between Market Orders and Limit Orders? Why Must Execution Speed and Price Be Balanced?

In crypto trading, choosing the right order type directly affects the execution price, speed, and trading costs. Many beginners focus only on whether they are buying or selling, while overlooking how their orders enter the market.

First, what is a market order?

The main goal of a market order is to execute as quickly as possible against available counterorders in the market. It typically prioritizes execution speed, but does not guarantee the final execution price. If the order boo
post-image
Musk just reset everyone’s Grok Bot quota today
And mine is about to reset again in 8 minutes—what a huge loss...
post-image
Faces Repeated Rejection Bearish Pressure Building
RWUSD continues to struggle around the same resistance zone, with sellers repeatedly stepping in to limit upward movement. The inability to break above this area suggests that bearish pressure remains present.

If the rejection continues, further downside could develop. However, a sustained move above resistance would weaken the bearish outlook.

Key figures

$0.9997–$0.9998 — Short-term resistance and rejection zone

$1.0157 — Level that would invalidate the bearish structure

$0.9748 — First downside level

$0.9553 — Second downside level

post-image
RWUSD
RWUSDRWUSD
Four.meme
MC:$3.88KHolders:1
0%
#USIranTalksShowNewProgress
Geopolitical Realignment: De-escalation Vectors Rewriting the Global Macro Risk Premium

The geopolitical architecture of the Middle East is undergoing a significant structural transformation as direct diplomatic channels between the United States and Iran yield tangible operational progress. Highly calibrated discussions centered on multi-tiered nuclear enforcement, systemic sanctions relief, and the re-establishment of verified international inspection frameworks have triggered an immediate unwinding of the global conflict premium.
This diplomatic breakthrough ha
XBRUSD-0.55%
XTIUSD-0.57%
SPX+0.33%
BTC-0.67%
  • 2
Oil Prices Plunge, US Stocks Celebrate! The Real Force Behind This Tech Rally May Not Be AI

Many people saw the Nasdaq rise 2.7% and immediately thought: AI is back!
But if you focus only on tech stocks, you may overlook another important factor behind this rebound—oil prices.
On November 9, Brent crude fell about 5.8% to $92.57 per barrel. The pullback in oil prices helps ease concerns about inflation and corporate costs.
Why does this matter?
Because oil prices affect not only gas stations, but also transportation, manufacturing, consumption, and costs across the entire economy. If energy p
NAS100-0.62%
  • 18
Load More

Join 40 M users in our growing community

⚡️ Join 40 M users in the crypto craze discussion

💬 Engage with your favorite top creators

👍 See what interests you

Trending Topics

USCPIDataIncoming

48.32k Views2.17k Discussing

The U.S. October CPI report will be released on November 10 at 8:30 a.m. ET. September CPI came in at 3.7% year over year, and markets will be watching closely for signs that inflation is cooling, especially in core CPI. A softer-than-expected reading could strengthen rate-cut expectations, while hotter inflation may pressure risk assets through higher Treasury yields and a stronger dollar. How do you think this CPI print will move $BTC, U.S. stocks and gold?

USIranTalksShowNewProgress

5.03k Views1.23k Discussing

KoreanStocksJumpOver5%

569 Views4.81k Discussing

View More