
Share your thoughts
placeholder
Article
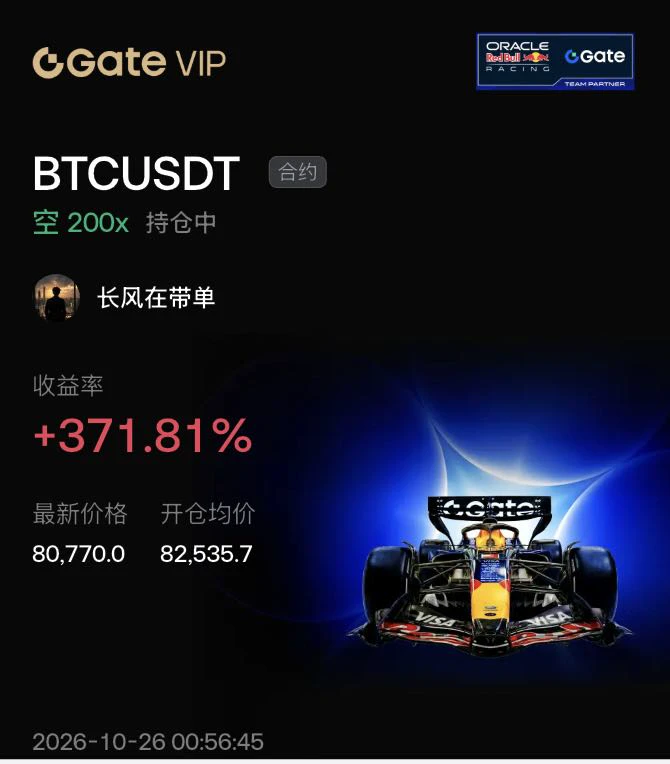
I opened a short position on this drop. Luck played only a small part—the level was simply textbook.
At the time, the wick up just reached below the previous high, but the bulls failed to break through twice in a row while volume kept declining, a typical exhaustion candlestick structure. I entered near the resistance level, with my stop-loss set just above the previous high, so the risk was easy to control.
Soon after entry, the market quickly pulled back. During the session, there was a small rebound, so I reduced part of the position. Seeing that the retest lacked strength, I continued hold
post-image
CYS-2.44%
BNB-3.70%
LAB-2.88%
I was just about to go to the forum and start cursing, but then I saw my balance and thought, forget it—the market is always right. 😤

With the screen glowing green, $NVDAX kept grinding along the bottom all the way to 216.97, and I felt something was off: the level that should have broken didn’t, while funds were quietly coming in. Didn’t someone get in ahead of me? Then I’ll follow and go long—get on board first and figure out the rest later.

I just opened my positions, and the current price has already reached 231.21, with a return of +611.38%%. Looks like this ride is secure. Everyone
post-image
NVDAX+0.02%
DOGE+0.17%
LAB-2.88%
In the end, I still have to make something of myself—I’m still not wealthy enough, and my abilities are lacking. Maybe my emotional experience has been too limited, which has made me realize that I’m especially prone to trusting others. But I feel that very few people can truly enter the center of my life; sometimes, sincerity just looks foolish to others.#晒出我的持仓收益
post-image
#HYPEBreaks88HitsNewAllTimeHigh
HYPE has entered a major price-discovery phase after breaking above $88 and printing a fresh all-time high of $88.11 on September 3. The token is currently trading around $85.4–$85.6, meaning it remains only about 2.8% below its record high despite the profit-taking that followed the breakout. The recent structure is especially interesting because HYPE has not collapsed after reaching $88.11; instead, it has been consolidating mainly between $83.5 and $86.4. From the August 31 area near $79.6 to the $88.11 ATH, HYPE gained approximately 10.7%, while the move fr
post-image
Water nourishes wood; gather gold and preserve gains
Moonlight steadies the heart; waterfalls bring wealth
Do not release floating profits; gains in the bag bring peace
post-image
Weekend Full Market Updates
live-cover
LIVE2,090
IOU Risk Reminder*
New Pi IOU lists on small exchange. Same rules apply: No deposits = not real Pi. You’re trading exchange credit, not crypto. When withdrawals open, exchanges must source real Pi. If they can’t, you get “Maintenance”. I express Pi thesis with BTC3L. Zero halt risk, same beta.
#PiNetwork
#Gateio #Gate60MUsers
post-image
PI-1.09%
BTC3L-1.13%
These returns have me feeling nervous, worried that the market will come to its senses tomorrow and blacklist me.
When I opened the chart this morning, it was still grinding sideways. The key was that the bottom held, while volume was quietly picking up and signs of funds entering were all too obvious. With a signal like that right in front of me, not taking it would have been letting all those late nights down. So I entered directly at 91.82, set my stop-loss, closed the software, and went back to work.
When I returned to my computer, the price had already reached 103.5, with the position’s r
post-image
ADA+0.09%
SNDK+0.20%
162,000 new jobs, but two-thirds came from waiting tables and teaching kids? This data is seriously inflated
My first reaction when the nonfarm payrolls report came out was, “It’s over, we’re going to drop,” but after calming down and digging into the data, I found that those 162,000 jobs were nowhere near as impressive as they looked.
The new jobs were heavily concentrated in low-wage industries. Of the 162,000 jobs, the hospitality and food services sector jumped by 62,000 in a single month—note that this sector had already declined for two consecutive months, so this was purely a technical
SNDK+11.88%
I was just about to go to the forum and start cursing, but then I saw my balance. Forget it—the market is always right. 😂

When the sell-off hit during the early session, many people panicked and cut their losses. I kept an eye on $BTR and instead thought: each rebound was weaker than the last, volume kept shrinking, and nobody was buying on the way up. How much longer can a market with insufficient support hold up? I went straight in with a short order at 0.17647.

The later script played out exactly as I predicted, with the price slowly drifting downward to 0.04716, securing +1441.79%. Ma
post-image
BTR-0.35%
DOGE+0.17%
BNB-3.70%
I did nothing—just went to the bathroom, and by the time I came back, the candlestick chart had already done the work for me.

A few days ago, before bed, I was watching the last hourly candle on $RIVER . It kept hovering around 6.705, and both attempts to break higher were immediately pushed back down. The resistance above was too obvious, and volume wasn’t keeping up. I marked a note in my plan at the time: this isn’t a suitable level to chase longs; those looking to short can try with a small position. While others were still waiting for a breakout, I had already placed my short order.

W
post-image
RIVER-6.74%
ADA+0.09%
ETH+0.51%
Everyone’s still barking up the wrong tree—DOGE just armed a trapdoor at 0.08913.

$DOGE /USDT - SHORT

Trade Plan:
Entry: 0.08884 – 0.08942
SL: 0.09187
TP1: 0.08707
TP2: 0.08570
TP3: 0.08365

Why this setup?
Why now?
- 4h bias flips SHORT with 55% conviction—not a scream, but a whisper before the drop.
- RSI 15m at 43.06: momentum is bleeding, not bouncing.
- Range-bound daily trend means 0.08913 is the pivot—losing 0.08884 opens a slide to TP1 0.08707.
- ATR 1h (0.001142) says volatility is tight—breakouts snap fast.

Debate:
Are you fading this 0.08913 rejection or buying the di
DOGE+0.17%
🚀 After the new Memes launched, who made the fastest gains? MARSCOIN has risen as much as +218% since launch, PONS +154%, Bull is Coming +187%, and BASECAT +96%.
Meanwhile, newly launched Meme perpetuals such as FLORK, DGAI, BONER, and CASHCAT have also begun building trading volume and market attention.
The popular names are the result; the newcomers are just the beginning. Check out Gate Meme Perpetuals’ Potential Newcomers list to see who could become the focus of the next wave.
Join the Robinhood Meme frenzy now: New users can claim 3 USDT on their first order, with up to 8,000 USDT avail
MARSCOIN-29.42%
PONS-13.19%
MEME-3.25%
FLORK-10.25%
  • 4
  • 2
I was just about to close the position and curse the market a little, but it turned around and dropped my jaw instead. While everyone else was running, I kept my eyes on the chart, thinking, what’s the point of cutting losses at a level like this? The pullback held, and support was still there, so I went long as planned and took a shot.

The entry price was 453.65. I opened a long position without hesitation and immediately took a clear direction. A lot of people were saying it would keep falling at the time, and I couldn’t be bothered to argue. The chart doesn’t lie—the price speaks for itse
post-image
DELL+0.25%
LAB-2.88%
BTC-0.41%
I had just switched the app to the background, and it shot right back up—are you playing hide-and-seek with me? 📈

A few days ago before bed, I was thinking: $LIT had been hovering around 3.753 for so long without breaking the key level, while the buy orders kept getting thicker little by little. Wasn't it about to make a move? So I opened a long position, set my stop-loss, and went to sleep.

When I opened the chart in the morning: the current price was 4.565, with +1043.98%% secured. That's absolutely wild. Here's your answer, folks—this run wasn't a waste of waiting. It dragged on for so
post-image
LIT-3.12%
SOL+2.28%
DOGE+0.17%
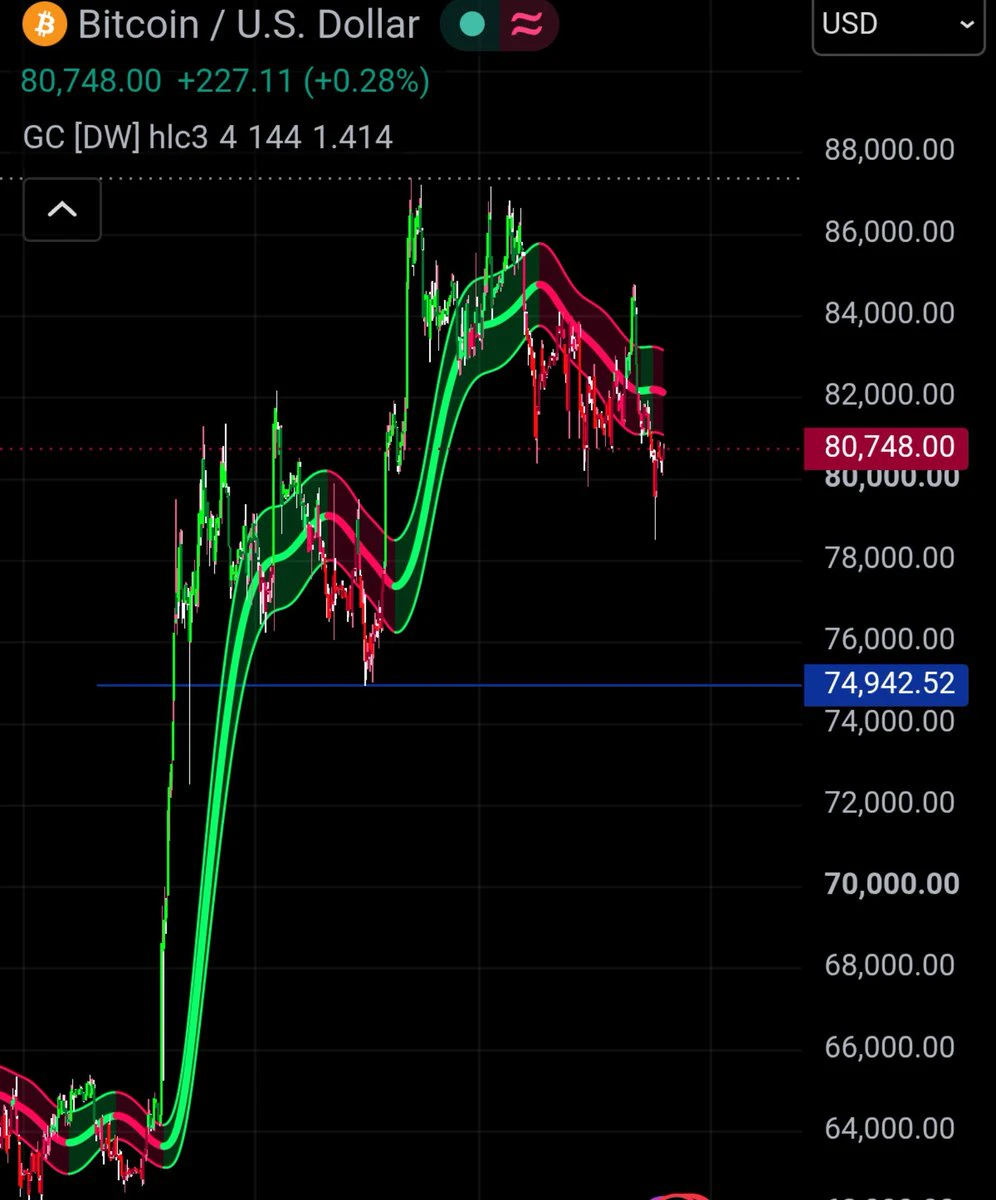
#BTCReclaims80K
BTC Reclaims 80K: Full Market Analysis, September 6 2026
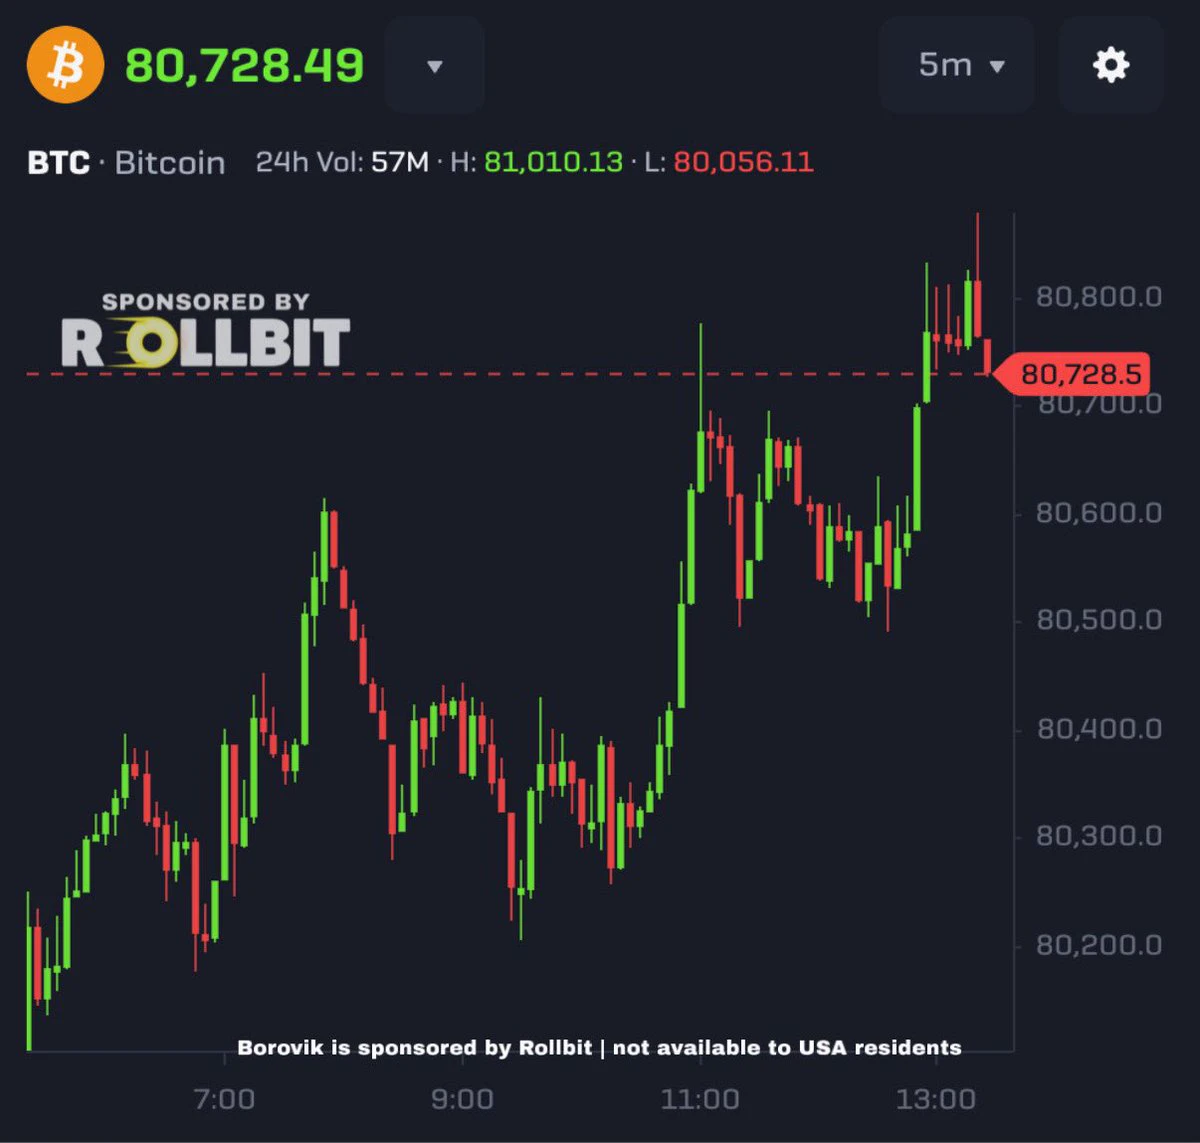
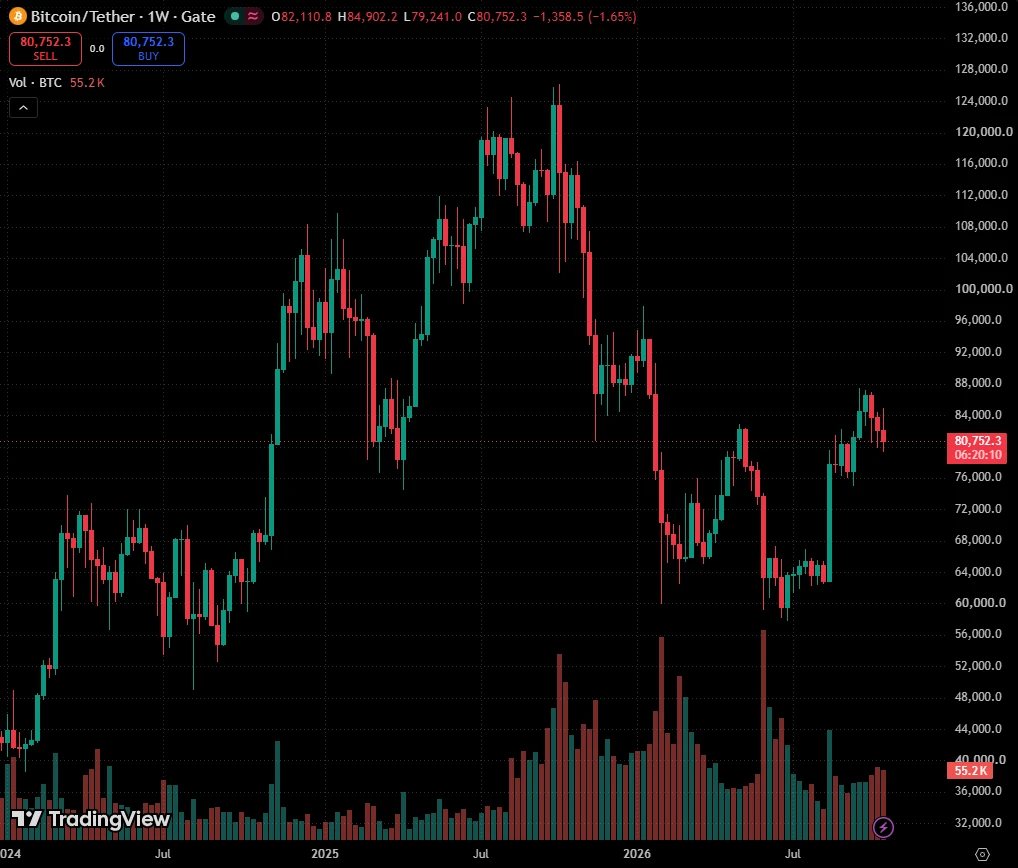
Bitcoin is standing right on the psychological 80,000 line again. Early Saturday September 6, BTC trades near 79,980 on spot markets, up about 0.4 percent in 24 hours after tagging 80,200 earlier in the session. The reclaim story is not clean: BTC broke back above 80K on Wednesday, lost it violently on Friday's jobs report, and is now rebuilding above 79,500. That two-step-forward, one-step-back rhythm says it all: the institutional bid is real, but macro headlines still hold the steering wheel.
The weekly scoreboard put
  • 1
Financial News, Crypto Updates, Real-World Strategies
live-cover
LIVE1,275
#Gate60MillionUsers
60 MILLION USERS. 60 MILLION STORIES. BUT TODAY, I WANT TO TELL YOU MINE. 💙🔥
When Gate officially crossed the incredible milestone of 60 MILLION global users, I didn't just look at that number as another achievement announced by a crypto platform; I stopped for a moment and thought about how many different dreams, experiences, struggles, successes, mistakes, lessons and unforgettable memories are hidden behind those 60 million users, because every single person who joined Gate has a different reason for being here, a different starting point, a different first trade, a d
post-image
Selective capital rotation into catalyst-backed assets like $ZEC and ripple:native signals localized strength rather than a full market-wide altseason.
Bitcoin dominance remains elevated at 57.5%, meaning capital is not cascading down the risk curve into mid- or micro-cap altcoins. The current moves are isolated narrative surges driven by ETF developments and regulatory milestones rather than broad liquidity expansion.
A true altcoin season requires Bitcoin dominance to break down sharply while overall market liquidity accelerates. Until that shift occurs, these rallies represent tactical rota
post-image
ZEC+16.41%
BTC-0.42%
#ZEC How to View ZEC After Breaking Above $1,200

Let’s start with the most compelling point in the bullish narrative: ZEC’s all-time high was actually $5,941 in 2016—the current $1,193 is still about 80% below its ATH. Against the backdrop of continued ETF inflows, the market can fully tell the story that “a decade high is just the beginning, with a return to the ATH ahead.” ZEC’s ETF assets under management have surpassed $400 million, SMA-200 is providing strong trend support near $440, and the daily structure remains healthy.

But in terms of pace, the risk is accumulating rather than di
post-image
ThisIsTranslateContent:
#ZEC How should we view ZEC after it broke above $1,200?
First, the most compelling point in the bullish narrative: ZEC's all-time high was actually $5,941 in 2016—the current $1,193 is still about 80% below its ATH. Against the backdrop of continued ETF inflows, the market can fully tell the story that a ten-year high is only the beginning and that ZEC is returning to its ATH. ZEC's ETF assets under management have surpassed $400 million, while the SMA-200 near $440 provides strong trend support, and the daily structure remains healthy.
But in terms of momentum, the risk is accumulating rather than dissipating:
First, the squeeze fuel is nearing exhaustion. On top of OI tripling from $700M to $2B, shorts have been squeezed for two consecutive days. The remaining horsepower of this engine is rapidly declining—once the shorts are fully cleared out, a vacuum in buying pressure will emerge.
Second, the pace of the rise has shifted from "violent" to "out of control." ZEC broke above $1,000 on Thursday (+20%) and went straight to $1,200 today (+17.8%). A 40% two-day slope has historically almost never occurred without a sharp pullback. The price is tracking a parabola, and every parabola eventually breaks.
Third, sentiment has already overtaken demand. PANews' review of the previous ZEC surge concluded that it "began with demand and ended with sentiment"—the share of privacy transactions fell rather than rose after the surge, indicating that capital speculation, rather than real usage, was driving the price. This round has a stronger demand base thanks to the ETF, but the slope from $1,000 to $1,200 is clearly being driven by sentiment.
Key levels
Upside: $1,200 has just been breached. The next round-number level drawing market attention is $1,500, followed by the 2016 ATH of $5,941 as the "narrative level."
Downside: $1,000 is the lifeline of this rally; a break below it would mean the squeeze-driven move is over. $1,100 is the first short-term support.
Conclusion
The medium-term logic (ETF + privacy narrative + ten-year high) remains intact, and this rally has not been invalidated. But the 40% gain in two days has turned the question of "how much further it can go" into whether it will "pull back first and then continue" or "finish the move directly."
So: Above $1,200 is a high-volatility zone, where the probability of wide-range consolidation or a rapid wick is far greater than that of a continued one-way surge. $ZEC
repost-content-media
ZEC+16.41%
  • 2
  • 1
Load More

Join 40 M users in our growing community

⚡️ Join 40 M users in the crypto craze discussion

💬 Engage with your favorite top creators

👍 See what interests you

View More