Square
Following
Hot
News
Profile
Share your thoughts
placeholder
Article
DXY is having a bearish retest here
IMO a rejection will happen next which is bullish for crypto and stocks
post-image
Thank you for witnessing with me the entire journey from 0% to 1400% in ten days without ever taking a heavy position or going all-in.
I hope for 2000%, 3000%, 5000%, and 10000%, and that we will be together throughout. The footprints I have left on major exchanges were absolutely not achieved by going all-in.<
My system is very simple: use technical analysis and indicators to strictly screen every coin, the project team, ecosystem, positive and negative catalysts, macro factors, technical aspects, whether to enter, and which price level is especially critical. I use high-frequency pin bar nak
BTC+0.80%
ETH+1.08%
  • 1
Sol market update
live-cover
LIVE55
$SUI Everything Is Fine! 🔥
🔥🐶🔥
post-image
SUI+0.29%
Today, we are only verifying one question about $ENA : whether there will still be buying support after breaking above 0.2438.
The 1-hour and 4-hour trends are both strong, with RSI at 70 and 77, respectively. The current price is 0.2394, approximately 8.19% from the 1-hour support at 0.2198 and approximately 1.84% from the resistance at 0.2438. The 24-hour change is +7.79%, but it cannot replace confirmation at key levels.
My view is not based on chasing rallies or selling into declines: wait for a break above 0.2438 or below 0.2198 first, and whichever occurs first will determine how the vie
post-image
ENA+7.80%
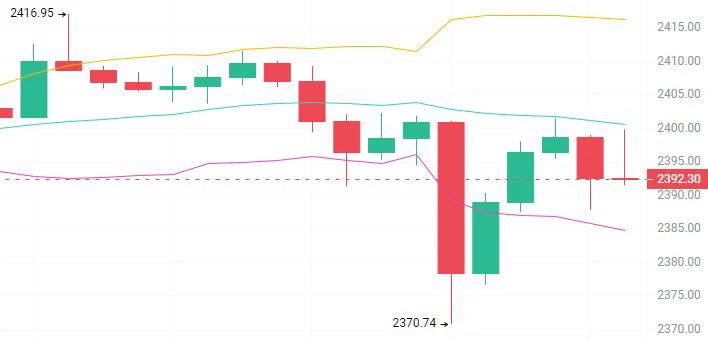
10.10-10.11 Weekend ETH Strategy Review
$ETH currently hit a high of 2552, with the candle body breaking above 2550, surpassing the third take-profit level but not reaching the fourth. Following Achen’s weekend strategy, profits have already been substantial!
It has now retraced to around 2540. The Bollinger Bands are opening upward, with the middle band supporting at 2515 and medium-term support at 2500. The current price is hugging the upper Bollinger Band, so the likelihood of a pullback is somewhat higher than for BTC. For now, simply wait for a signal while the price moves sideways.
Trad
AChenBit
10.10-10.11 Weekend ETH public trading plan
Prioritize executing $ETH long strategy
  Entry range: Light long near 2480 on a pullback; add near 2470
  Stop-loss defense: near 2460 (set according to position size; execute planB⬇️ after breaking below)
Take-profit levels
  First take-profit: near 2500 (touching the upper Bollinger Band)
  Second take-profit: near 2520 (resistance at the short-period high)
Third take-profit: near 2540 (medium-period high-volume trading zone)
Long-term target: near 2560 (establishing a long-term position in the pullback trend)
Trading factors: The narrowing Bollinger Bands indicate that after the sharp drop, the market has entered a narrow-range consolidation phase. Weekend volatility is limited, and weekend trading volume is contracting. For the range-bound market, first watch the first and second take-profit levels, then dynamically observe and analyze the trend on Sunday evening. After determining the overall trend for next week, watch the third take-profit level and the long-term target.
planB
If the entry range is not reached, the stop-loss at 2460 is broken, or the price breaks above 2520, execute the short strategy
Entry range: Wait for a high-level short above 2520 on a pullback; add near 2530
  Stop-loss defense: 2540 (unified stop-loss)
Take-profit levels
  First take-profit: near 2500
  Second take-profit: near 2480 (lower-band support)
Third take-profit: below 2460
Long-term target: below 2430
#Gate亮相TOKEN2049
#Ledger事件损失近9000万
#GateWCTCS9全球交易赛
repost-content-media
ETH+1.09%
$PUMP PUMP: A Potential Daily Head & Shoulders
Weekly Rounded Bottom Remains Constructive
PUMP has staged an impressive recovery following months of consolidation, developing a rounded bottom with the potential to form a larger cup-and-handle pattern. The recent rally towards $0.006806 reinforces the improving longer-term structure, although the pattern remains incomplete.
Weekly EMAs Support the Recovery
The 21/8-week EMAs remain bullishly crossed, with price trading comfortably above both averages. Weekly RSI also remains above 50, although both RSI and StochRSI are easing from overbought co
post-image
PUMP+3.19%
$ETH Is the bull market really coming this time, bro
post-image
ETH+1.09%
  • 1
  • 1
Less than 7 days left before the final epoch of the @axisrobotics Creator Campaign wraps up. 👀🦾
If you’re just discovering Axis, here’s how I understand what they’re building.
The idea is to bring human intelligence and robotics together, allowing people to guide machines through tasks that would normally require human involvement.
The process is pretty simple in theory:
🧠 Humans provide the intelligence and instructions.
🤖 Robots use that input to carry out real world tasks.
🎮 People remain in control of the actions the robots perform.
What makes this interesting is the bigger picture.
I
post-image
🐋 WHALE WATCH : Look at what happens when shorts try to stand in front of momentum.
=> $BTC closing hard on the $84K resistance wall
=> Over $95.72M liquidated from aggressive short positions in a flash
=> Order books thinning out above current levels
If $84K officially cracks and flips to support the squeeze higher is going to be violent. Pay attention.
post-image
BTC+0.80%
"Buy Crypto" searches are spiking again.
The last time this happened? 2021, right before the bull run.
post-image
GM from me and Coach Cruz 🔥
Could I be a UFC fighter?
post-image
$FET Is Near Resistance; What Evidence Is Most Lacking for a Breakout?
$FET 24-hour +5.68%, current price 0.2383, only 2.52% away from the 1-hour resistance at 0.2443. Positions like this are most prone to a common illusion: briefly moving above it intraday and treating the breakout as complete. The truly meaningful answer is whether it can hold after moving above.
The opposing case also has clear invalidation levels. Falling below the 1-hour support at 0.217 would indicate that short-term buying support has failed the test; if the 4-hour support at 0.2038 is also broken, the previous bullish
post-image
FET+5.71%
Sol market update
live-cover
LIVE52
#TOTAL going to $5T!🔥🚀
📈When you look at the Crypto #Total Market Cap, you can better understand why we have bounced back!
The green candles are very strong anyway! We are just at the beginning of the #BullRun!
You are still earlier!
post-image
Weekend pumps warrant some suspicion, as they can easily be traps. However, our long position is around 82,500. The point shown here in Figure 1 is a spring point, so taking a short-term short position to hedge profits would be appropriate between 84,638 and 85,288. The stop-loss should be above 85,888; setting it at 86,300 would be most appropriate.
Our 82,500 long position does not need to be closed. We should add to it when the price retraces to a suitable level, targeting a rise to 90,000.
Tonight, set a short order at 84,638, stay alert for a low-volume weekend pump, and be mindful of the
$MAGIC Nears Resistance: What Evidence Is Most Needed for a Breakout?
$MAGIC 24 hours +33.20%, current price 0.1364, just 2.49% away from the 1-hour resistance at 0.1398. At this kind of level, it is easy to develop the illusion that briefly moving above resistance means the breakout is complete. The answer that truly carries weight is whether price can hold after breaking above it.
Let’s pull the camera back to the 24-hour range: low 0.0926, high 0.1398. Where the current price of 0.1364 sits within this range directly affects the meaning of the same signal. Near the high, strength needs to p
post-image
MAGIC+34.83%
🚨 BITCOIN IS SHOWING RESILIENCE WHILE ALTCOINS BLEED!
Bitcoin is trading around the $83,000 region, while several major altcoins have suffered heavier weekly losses.
This raises an important question: Is Bitcoin becoming the safer place for crypto traders during market uncertainty, or are altcoins preparing for a comeback?
👀 Watch Bitcoin’s next move carefully. It could influence the direction of the wider market.
What are you choosing right now: BTC or ALTCOINS? 🔥
#Bitcoin #CryptoMarket #Altcoins
BTC+0.80%
$SOL SOLUSDT: Downside pressure holds following rejection
The chart for SOLUSDT shows a strong downward corrective swing on the four-hour timeframe, with sellers clearly in control as price trades below the declining moving averages. The single sign of this seller dominance is the rejection near the upper volume node where price failed to sustain higher levels.
My downside plan activates conditionally if a retracement reaches the trigger at 112.5, which could open a path toward the target at 105.2.
This scenario would be completely canceled if price breaks above the invalidation at 114.9, whic
post-image
SOL+0.83%
Load More

Join 40 M users in our growing community

⚡️ Join 40 M users in the crypto craze discussion

💬 Engage with your favorite top creators

👍 See what interests you

Trending Topics

GateAtTOKEN2049

41.35k Views21.85k Discussing

Gate brought a series of major events to TOKEN2049 Singapore! From the official launch of Gate Money to the F1 Red Bull driver meet-and-greet and the Gate Gala, we witnessed a new chapter of "One Gate, Borderless Finance." Which moment from TOKEN2049 stood out most to you?

LedgerLossesNear90Million

39.52k Views300 Discussing

GateWCTCS9GlobalTradingCompetition

34.6k Views5.16k Discussing

View More