Square
Following
Hot
News
Profile
Share your thoughts
placeholder
Article
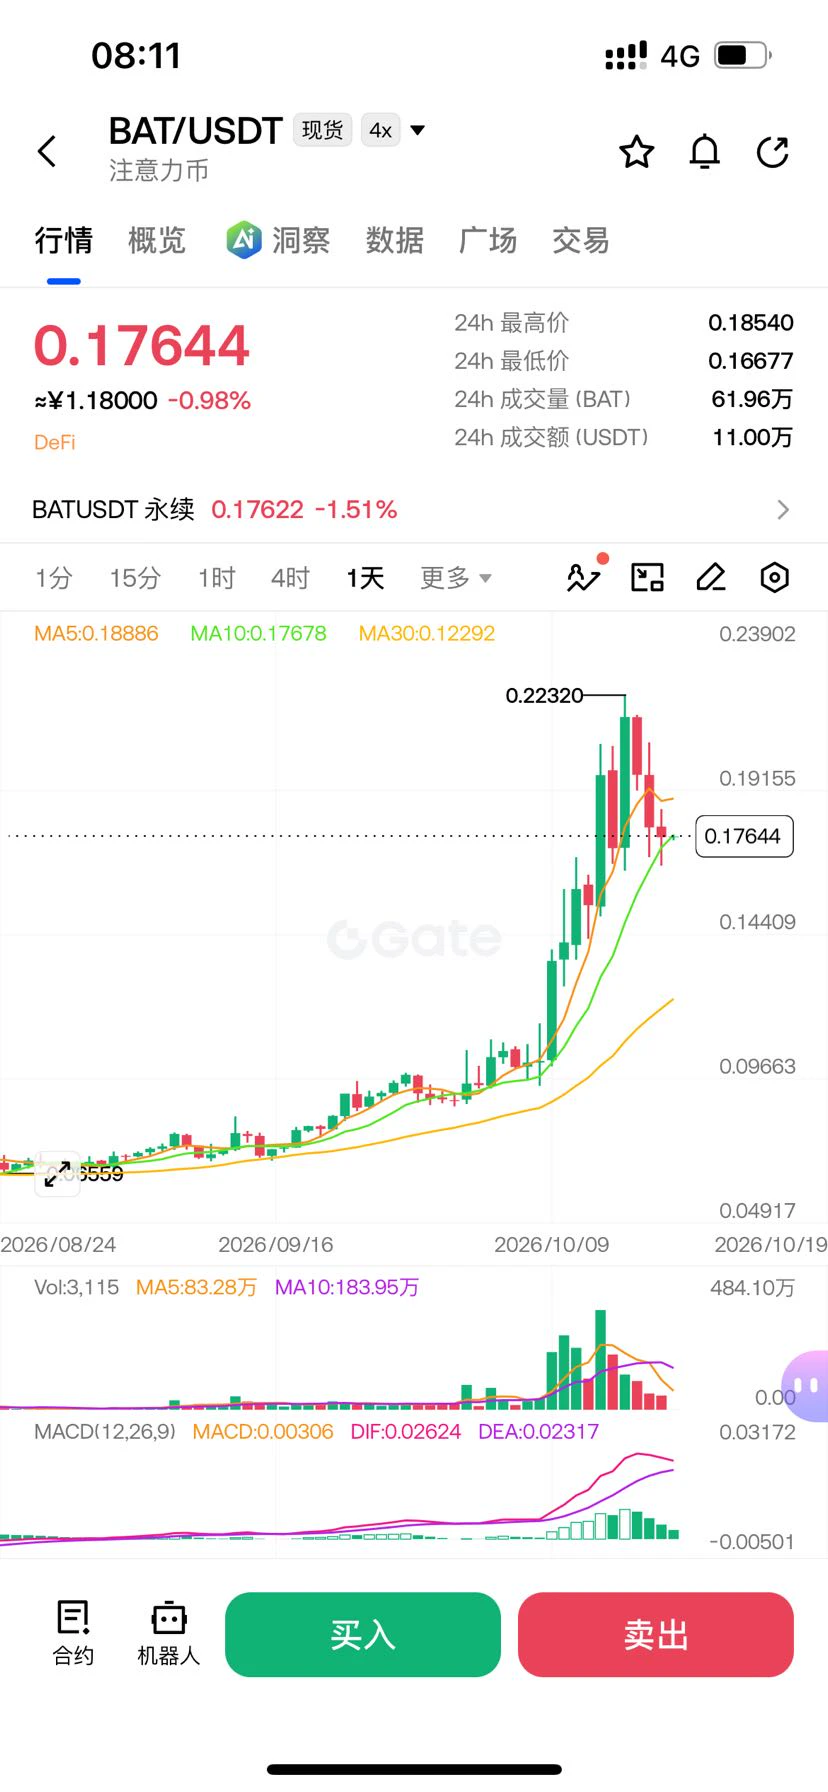
$BAT I've been watching this for a week, and the more I look, the stranger it seems.
Up 9.8% in 7 days sounds pretty impressive, right? But look at the volume—it’s down to just 30% of normal. It’s rising, but nobody’s following. With trading volume under 34 million, where are the buyers?
Even crazier, it’s up 117% over 30 days and 122% over 90 days. I won’t say how the people who dumped it all the way down from 0.22 feel now. Either way, at 0.1756, this is halfway down from a high—not the floor.
I believe a rally on rising volume. A rally on falling volume just looks like nobody’s buying while
post-image
BAT-1.65%
🚀🔥 GATE BTC AND ETH FUTURES VOLUME RANKS TOP 3 — A POWERFUL MILESTONE FOR THE CRYPTO MARKET! 📊💎
#GateBTCAndETHFuturesVolumeRanksTop3
The cryptocurrency market continues to evolve, and trading activity remains one of the most important indicators of market participation. Bitcoin (BTC) and Ethereum (ETH) stand at the center of the digital asset ecosystem, attracting traders, investors, institutions, and crypto enthusiasts from around the world.
🏆 Gate's BTC and ETH Futures Trading Volume Ranking in the Top 3 Highlights Its Position in the Competitive Crypto Trading Landscape!
Futures tradin
post-image
BTC+0.80%
ETH+0.43%
Trenches
TSI
T
bade
b
TSI
0xa8...1c1e
Market Cap
$.
Change
.
24h Vol
$.
Holders
.
AGT
A
bade
b
AGT
0x5d...e274
Market Cap
$.
Change
.
24h Vol
$.
Holders
.
CNPY
C
bade
b
CNPY
0xc6...ddd2
Market Cap
$.
Change
.
24h Vol
$.
Holders
.
BOOMER
B
bade
b
BOOMER
0x5a...5c00
Market Cap
$.
Change
.
24h Vol
$.
Holders
.
CLAUDIA
C
bade
b
CLAUDIA
0xd5...5261
Market Cap
$.
Change
.
24h Vol
$.
Holders
.
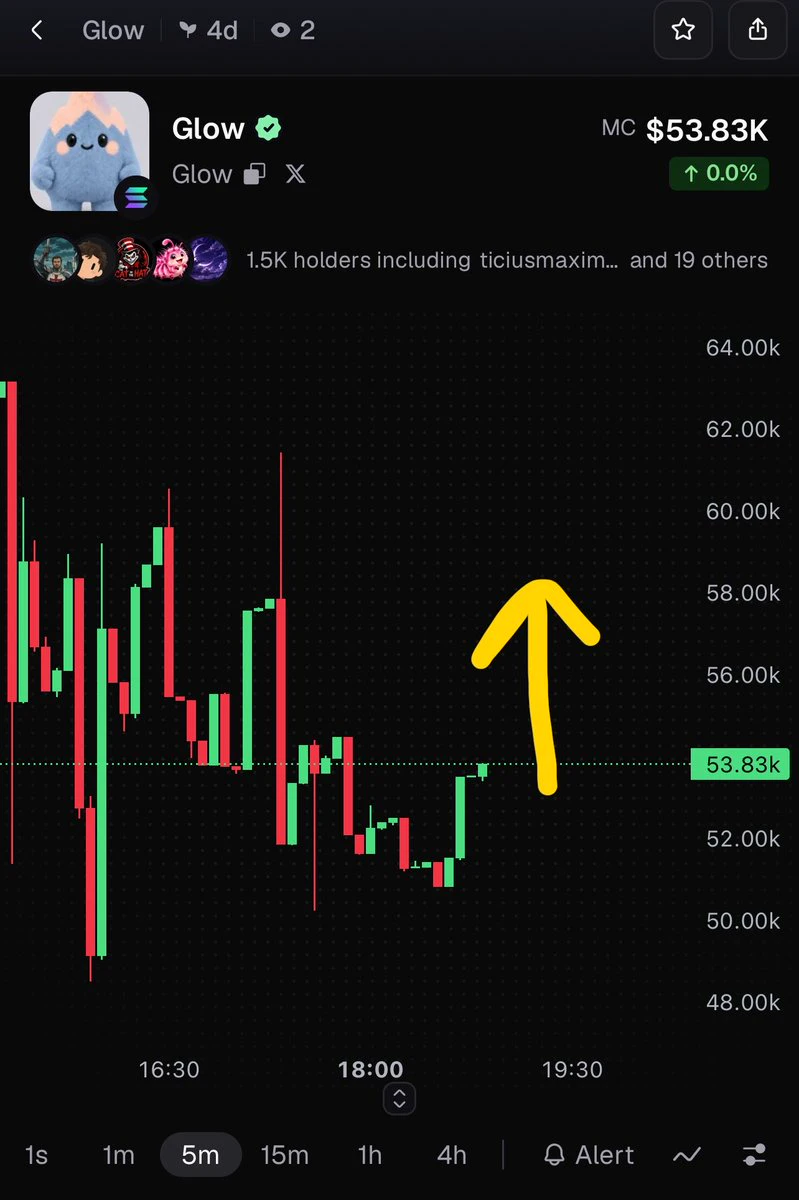
solana:9KDhovVA2kdjngkFooqEn5FoKkuZeDMYiQtVk7Lbm9up $58k - $64k
9KDhovVA2kdjngkFooqEn5FoKkuZeDMYiQtVk7Lbm9up
#crypto $sol
post-image
SOL+0.71%
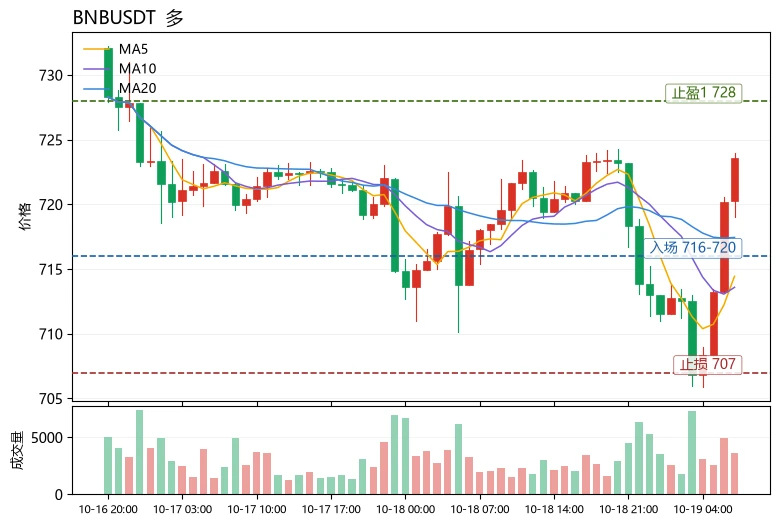
The most unusual detail in today's market is that the $BNB
funding rate is exactly 0.0000%, while the Fear and Greed Index sits in the neutral zone at 53, yet the price has moved above MA5 and is approaching the upper Bollinger Band at 727.962. Neither bulls nor bears are willing to pay a premium, suggesting this is a modest rally driven by spot buying and sector rotation, rather than leveraged sentiment.
Looking at correlations, with BTC stabilizing, $BNB is up just +0.77% over 24h, but its trading volume of 54.6M USDT is healthy; MA5=714.448 crossing above MA20=717.447 forms a golden cross
post-image
NEAR+3.06%
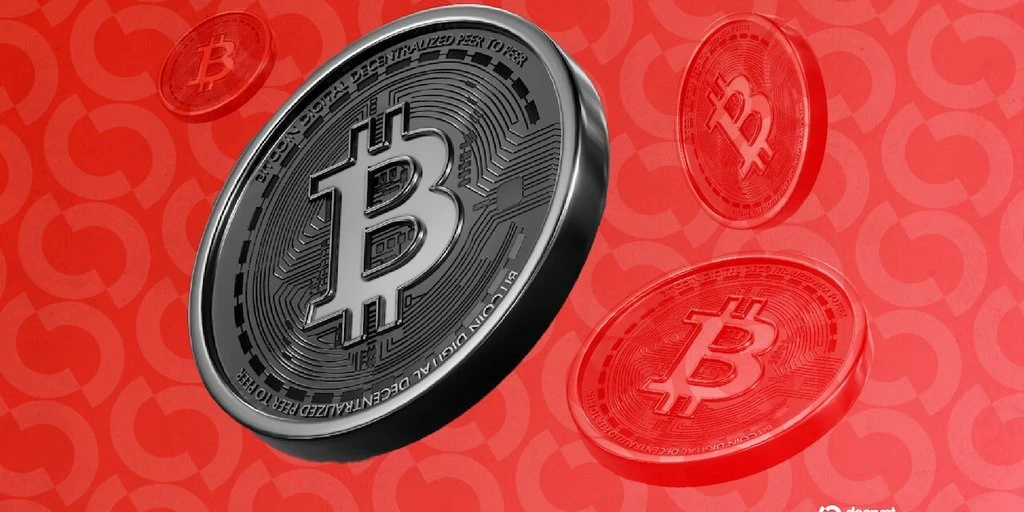
Bitcoin ETFs Lose Nearly $1 Billion in Two Weeks as Uptober Stays Red
U.S. spot Bitcoin ETFs posted net outflows of $228.6 million this week, after losing $681.1 million the week before. Over the two-week span, roughly $910 million has left the funds.
Outflows topped inflows on three of five trading days. Wednesday’s $261.4 million exit was the week’s worst session, wiping out a $175.7 million inflow from Tuesday. Thursday managed a modest $5.1 million inflow before selling resumed Friday, with the funds shedding $82.4 million on the final day, according to Decrypt’s ETF tracker.
⚠️ Personal m
post-image
BTC-0.96%
Quant says a firm could settle an FX trade across the UK's GBTD and The Clearing House's US network, both powered by Quant, with no direct link between them. GBTD lets any member ask another to lock funds for the trade.
@quantnetwork
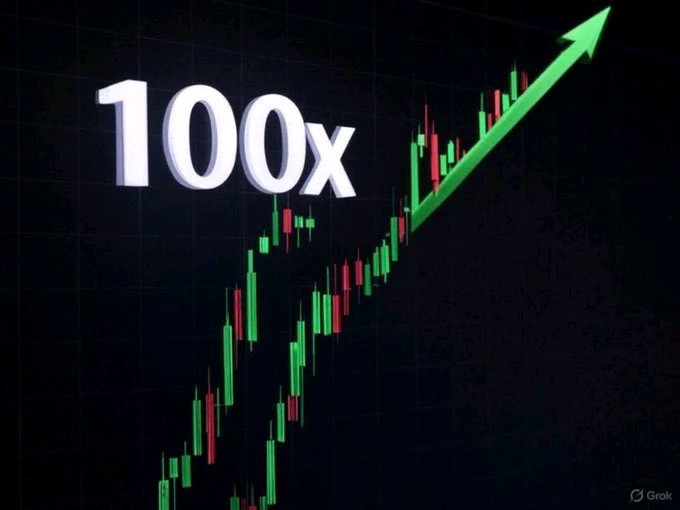
Which #memecoin will do 100x pump next?
post-image
MEME-2.07%
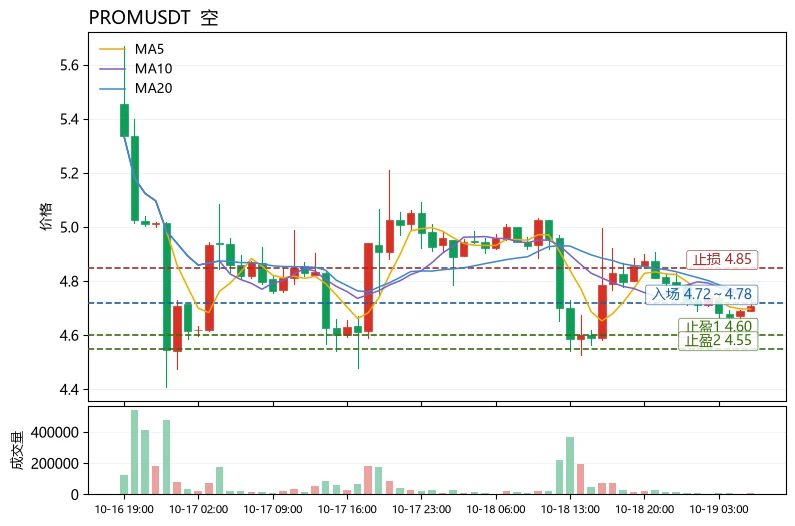
$PROM The most unusual detail today is that the funding rate remains positive (+0.0050%), yet the price has fallen 5.37%—longs are paying to hold their positions, indicating crowded positioning, while MA5 (4.6964) has fallen below MA20 (4.74425), weakening the short-term moving-average structure.
Technically, the MACD histogram is -0.005031; bearish momentum is not strong, but its direction is clear. RSI is only 43.7, in the neutral-to-weak zone and not yet oversold, meaning there is still room to fall. The lower Bollinger Band at 4.55403 is the nearest structural support; the current price of
post-image
PYTH-6.21%
Having made it this far all by myself, I stopped blaming anyone long ago. After that, no matter how difficult things got, they never seemed like much, so when you ask what kind of person I am, I don’t know how to answer you either.
post-image
📈 Growth is cooling, but not stopping: IIES-UCAB published its September Economic Outlook Report, offering a two-sided view of Venezuela’s economy.
On one side: the country is expected to close 2026 with real growth of 6.5%. On the other: manufacturing, coming off a spectacular year with 11.7% growth, is expected to slow to 7.5%.
For those trading in the P2P market, the question isn’t how much the economy is growing in the abstract, but how much of that growth translates into bolivars in people’s pockets, real demand for USDT, and pressure on the exchange rate. And on that point, the report r
post-image
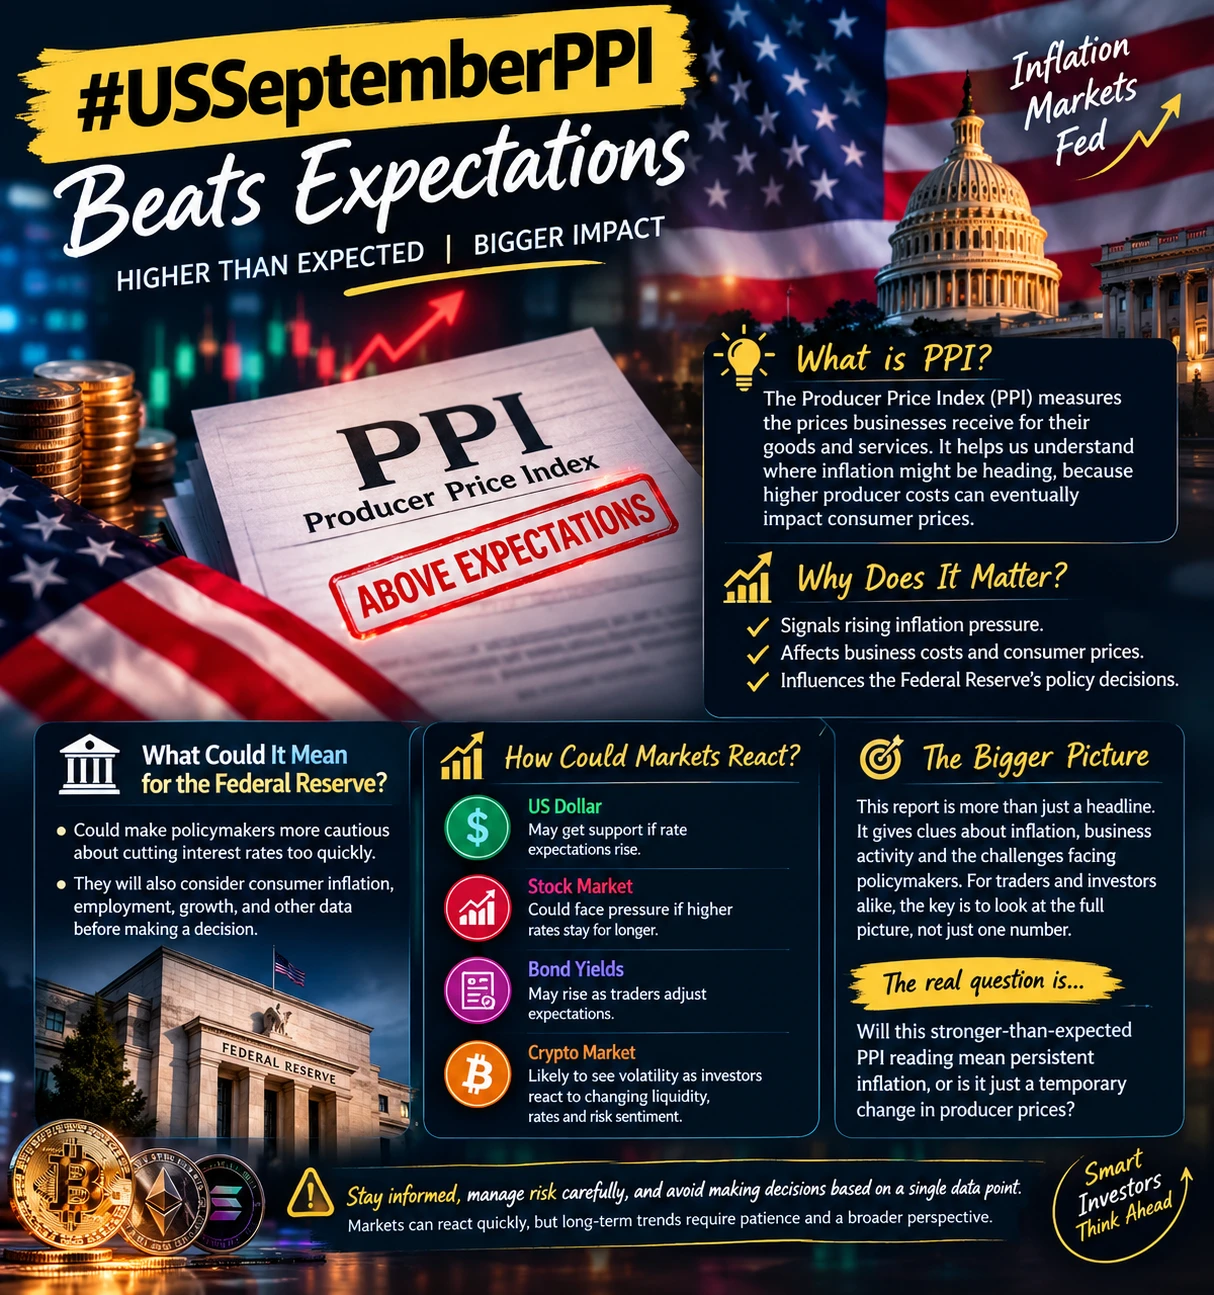
#USSeptemberPPIBeatsExpectations 📊🇺🇸
🔥 US September PPI Beats Expectations: A Key Signal for Inflation, Markets, and the Federal Reserve!
The latest US Producer Price Index (PPI) data for September has captured market attention after beating expectations, putting inflation trends and the future direction of monetary policy back in the spotlight. 📈
The Producer Price Index measures the prices businesses receive for their goods and services. Because producer costs can influence prices across the broader economy, PPI data is an important indicator for investors, economists, and financial mar
post-image
BTC+0.83%
Bitcoin Support and Resistance Levels
live-cover
LIVE61
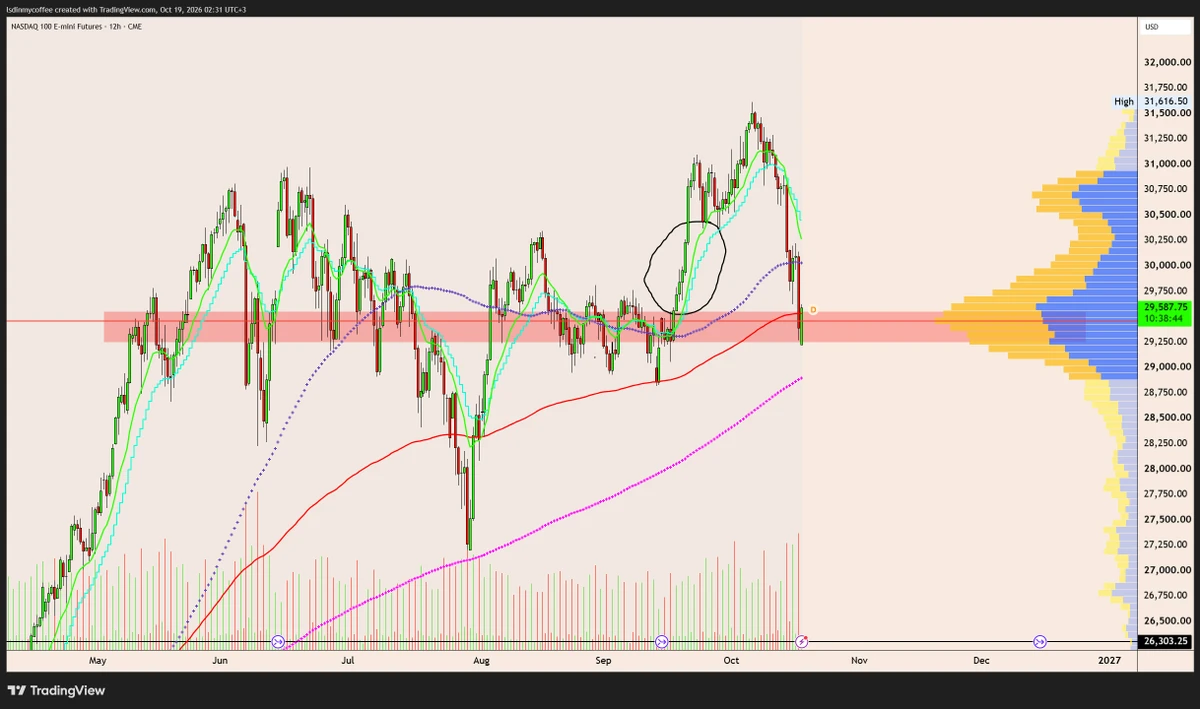
$NQ
Dumped right into the PoC + filled the inefficiency created by the September FOMC pump
Not saying we can't go lower but it looks like a bad level to start being bearish
post-image
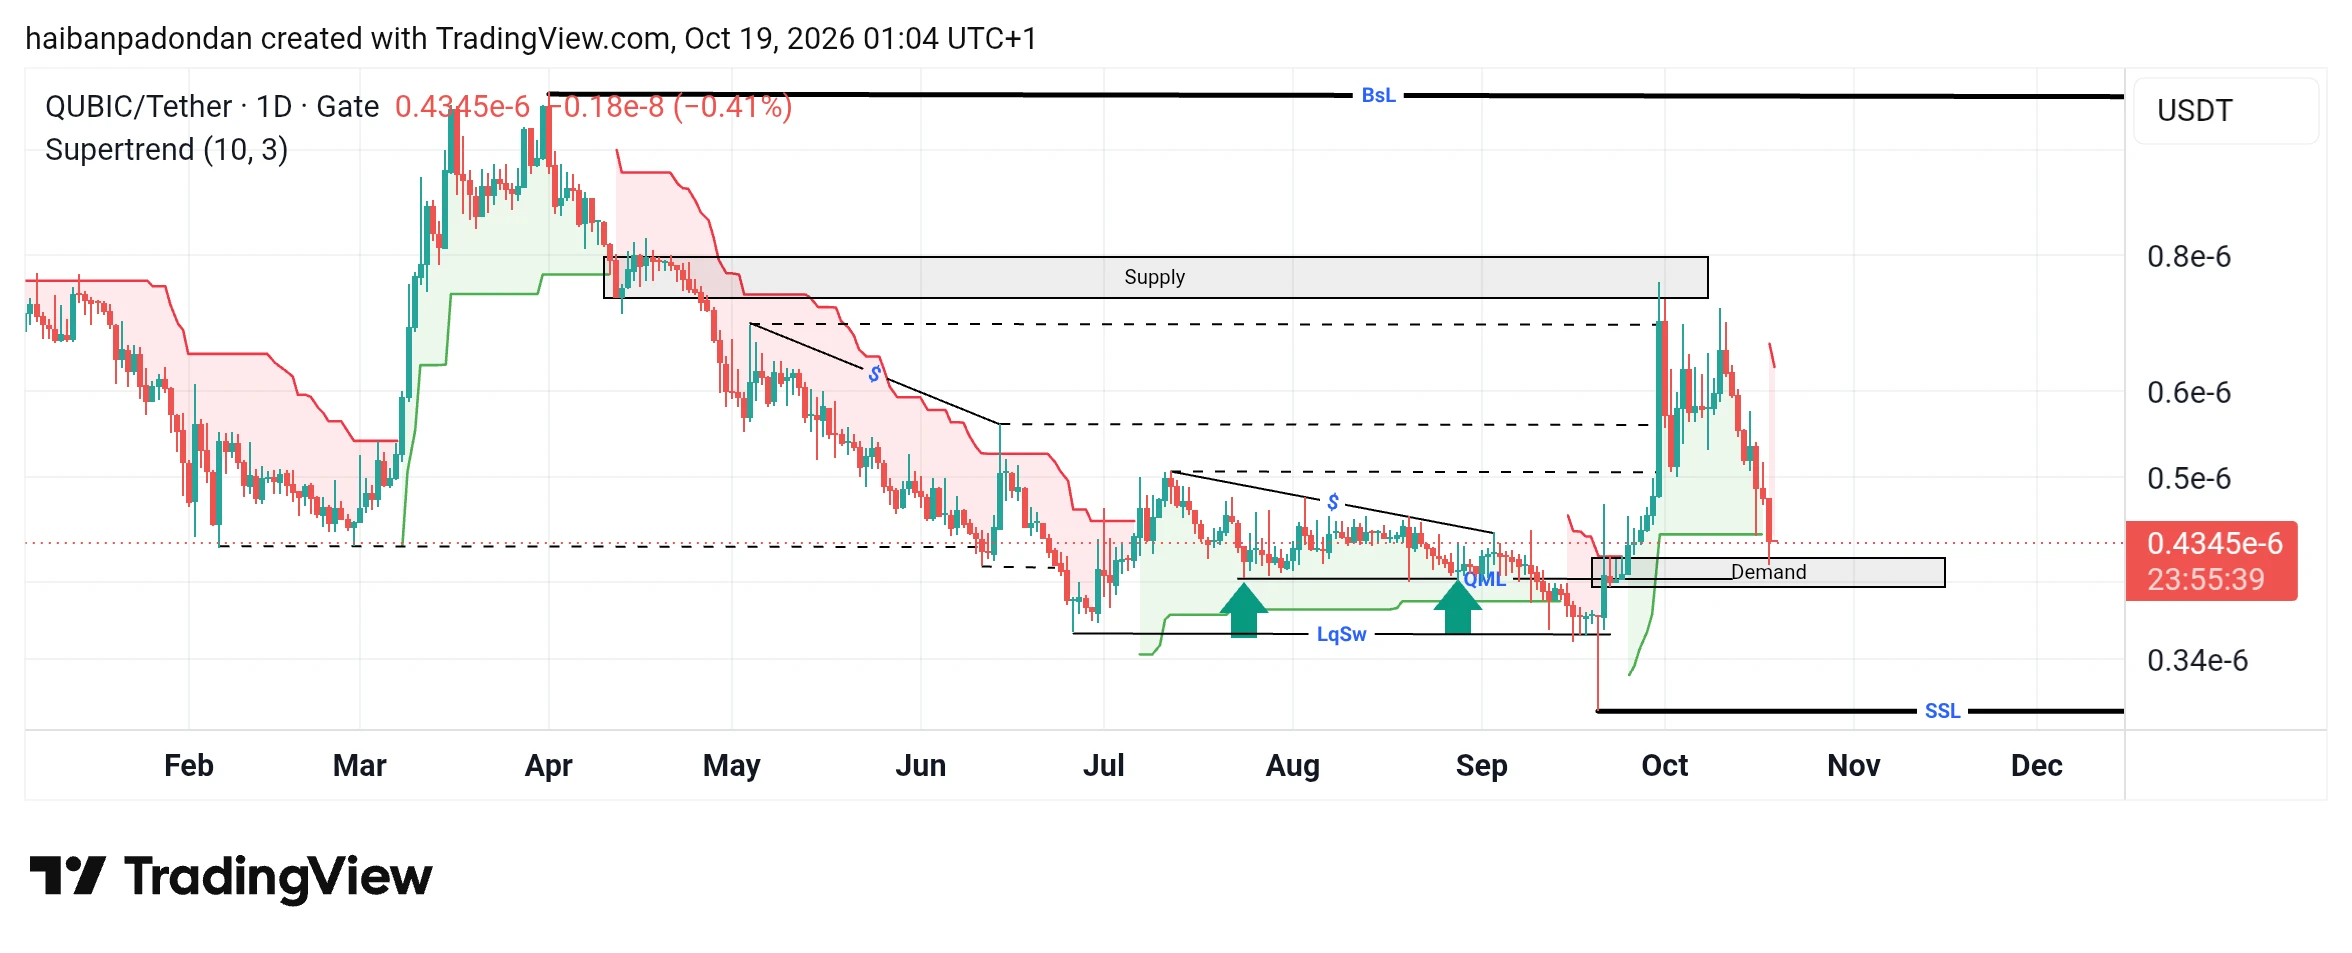
The demand area serves as the final hope for a price rebound toward the BSL; if this demand area fails to hold, the price will continue its bearish trend even further. $QUBIC ‌
post-image
QUBIC-9.04%
What if we don’t nuke on a random Monday?
post-image
$Q Do you have something wrong with your head? You're jumping all over the place
post-image
Q-8.97%
$LSK Same 1000U, wildly different outcomes. I chased in at 0.2198 and cut at 0.1839, leaving me with 769U from my 1000U. The 15.55% drop in 24h hit hard. In retrospect: I bought near the 24h high, hoping for a rebound; when it fell to 0.19, I didn't stop-loss, still holding out hope; only when it hit the low of 0.1804 did I panic and sell at the bottom. Trading volume of 26.2M wasn't small, but catching a falling knife among the top losers is just asking to lose. Lesson: chasing highs without setting a stop-loss is handing your account over to the market. If you still want to trade it now, wa
LSK-14.71%
$SIREN I entered long before this 13.74% surge and am now up 38%, but I don't plan to close everything. Price is currently 0.0343. 24h volume is 46.6M. It broke above the previous high of 0.0356 on increased volume but failed and pulled back. There are no signs of whale selling on-chain, and open interest is rising in tandem, suggesting this is a major player driving the price up, not retail FOMO. My plan: add to my long on a pullback to the 0.0325-0.0330 range, with a stop-loss below 0.0293 (I'll admit I'm wrong if it breaks today's low). First take-profit at 0.0380, second target at 0.0420.
SIREN+13.07%
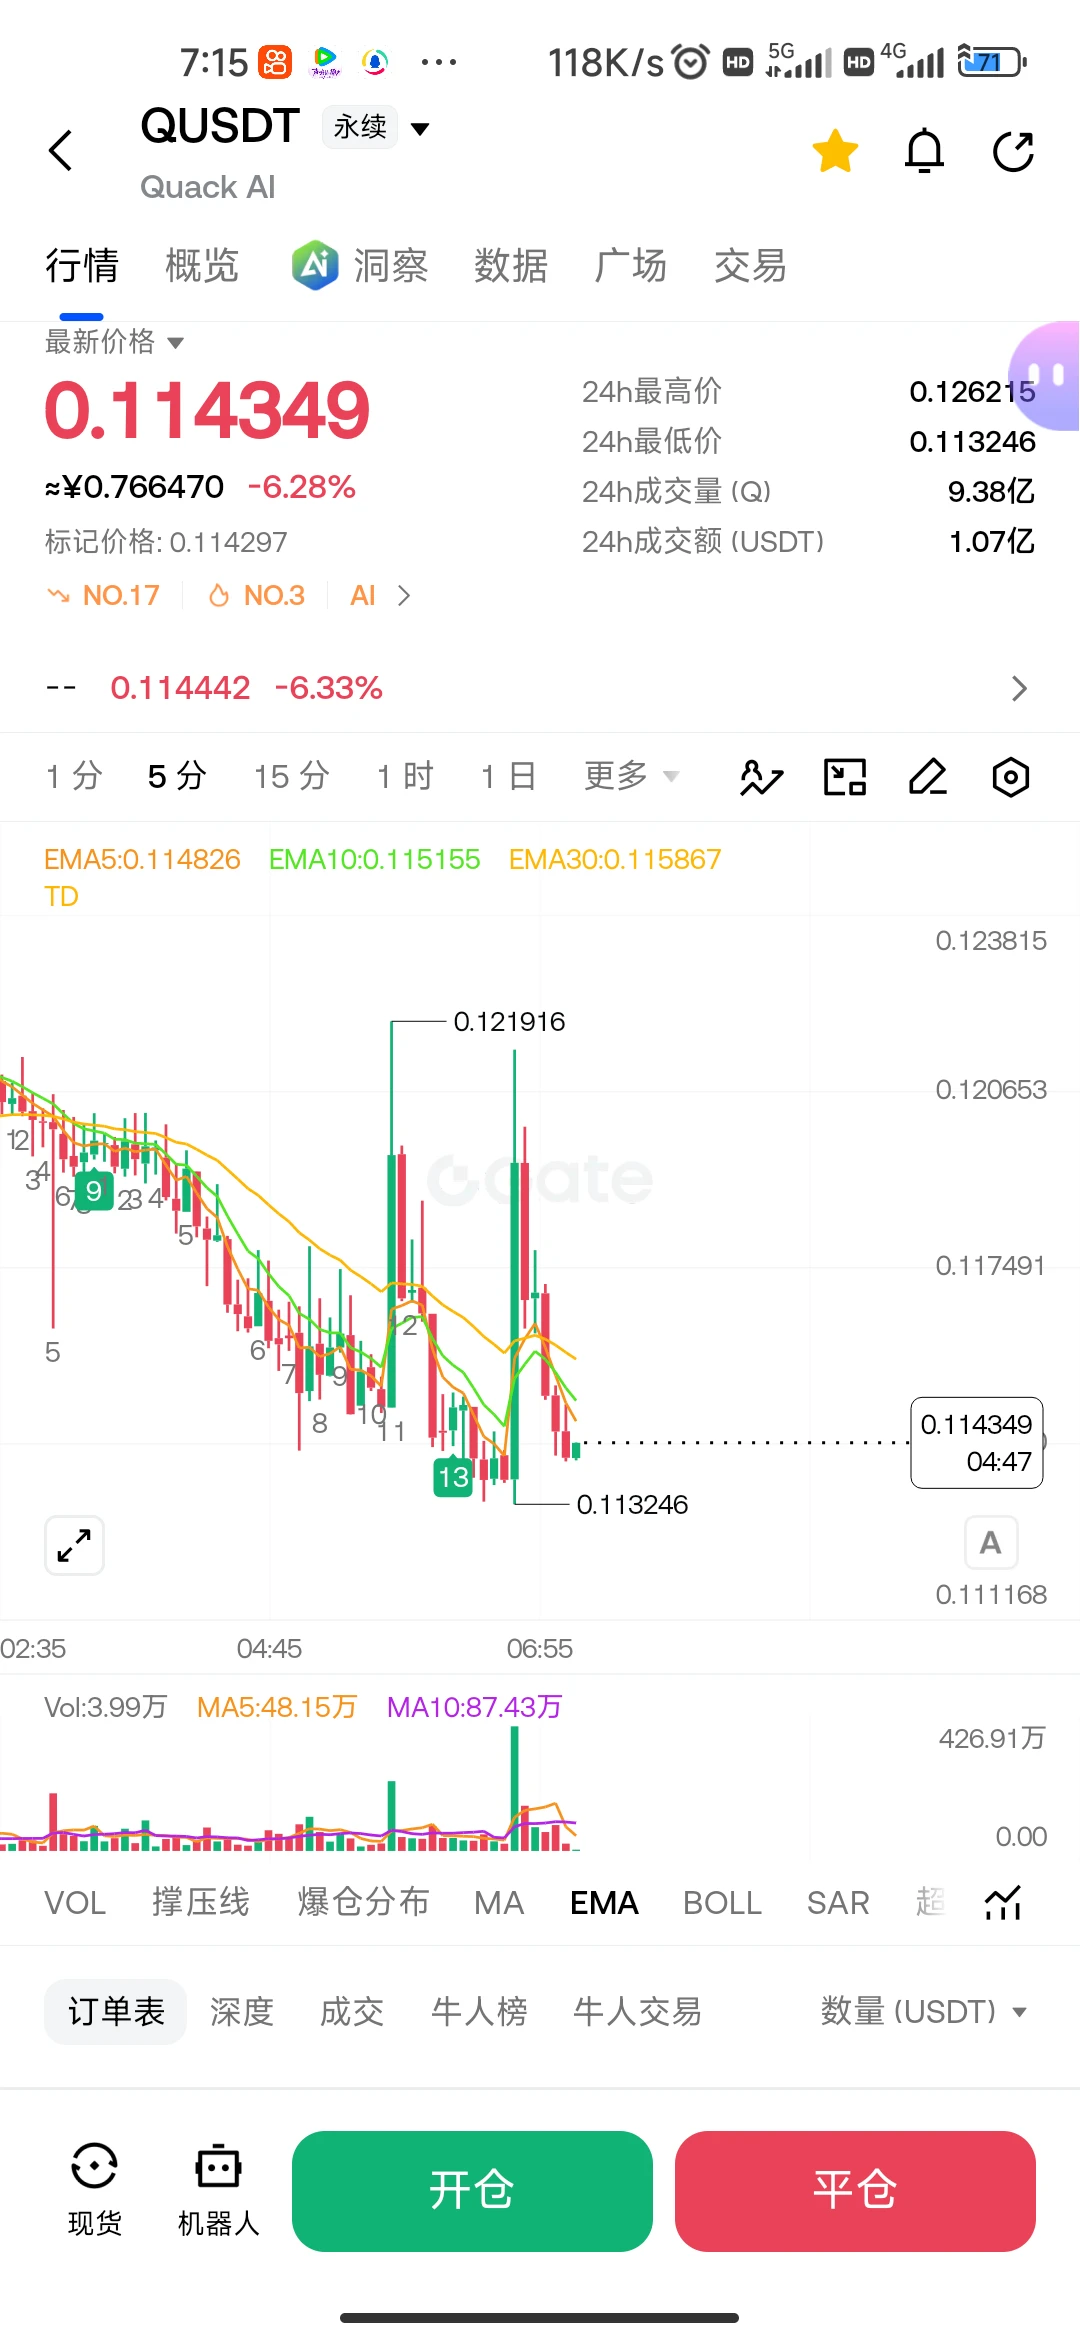
$Q's data looks off. Its 24-hour range exceeded 43%, plunging to a low of 0.0870 before rebounding above 0.11, while trading volume surged to 1.13 billion—price down 10% but volume exploding. This isn't ordinary shakeout.
Three possibilities: first, whales are wash trading to create panic and accumulate; that wick at 0.0870 is evidence. Second, a cascade of futures liquidations, with leveraged positions pushing the price through the floor in an instant. Third, someone knew something in advance and is selling, but buyers are equally aggressive.
The chart looks more like the first scenario to me
Load More

Join 40 M users in our growing community

⚡️ Join 40 M users in the crypto craze discussion

💬 Engage with your favorite top creators

👍 See what interests you

Trending Topics

USSeptemberPPIBeatsExpectations

91.35k Views1.94k Discussing

US September PPI came in at 6.3% YoY, well above the 5.3% market expectation, pointing to renewed producer-side inflation pressure. Weekly jobless claims were 199K, broadly in line with forecasts. Could hotter inflation further reduce room for rate cuts, and what does it mean for $BTC, US stocks, and gold?

GateWCTCS9GlobalTradingCompetition

37.87k Views6.84k Discussing

GateBTCAndETHFuturesVolumeRanksTop3

53.8k Views1.94k Discussing
View More