
Square
Following
Hot
News
Profile
Share your thoughts
placeholder
Article
gm frens
tgif 🎉
post-image
$ZEC
The ZEC short opportunity is here again
Yesterday’s ZEC plunge was incredibly satisfying
Big Hammer previously posted that ZEC had to reach 1100
Yesterday proved that perfectly
It currently feels like ZEC’s decline is not over yet
No obvious divergence has appeared
Although it has already recovered today from yesterday’s drop
The bullish candlestick momentum is average
There is also a relatively high degree of overlap
If it breaks above 1221.13 with increased volume next
And manages to hold above it
Then shorting should be approached cautiously
Currently, ZEC
Could move in either directi
ZEC-2.04%
🔥 $LUNC BURN UPDATE 🌕
🔥 460.4B burned since May 2022
🔥 817M burned in the last 7 days
🔥 16.19M burned TODAY
Tax2Gas is LIVE. ⚙️
Network activity now feeds directly into the burn mechanism.
No noise.
No hype.
Just the machine doing its job. 🔥
THE MACHINE IS RUNNING. QUIETLY.
I’M HOLDING. 💎
#LUNC #TerraClassic
post-image
LUNC+0.89%
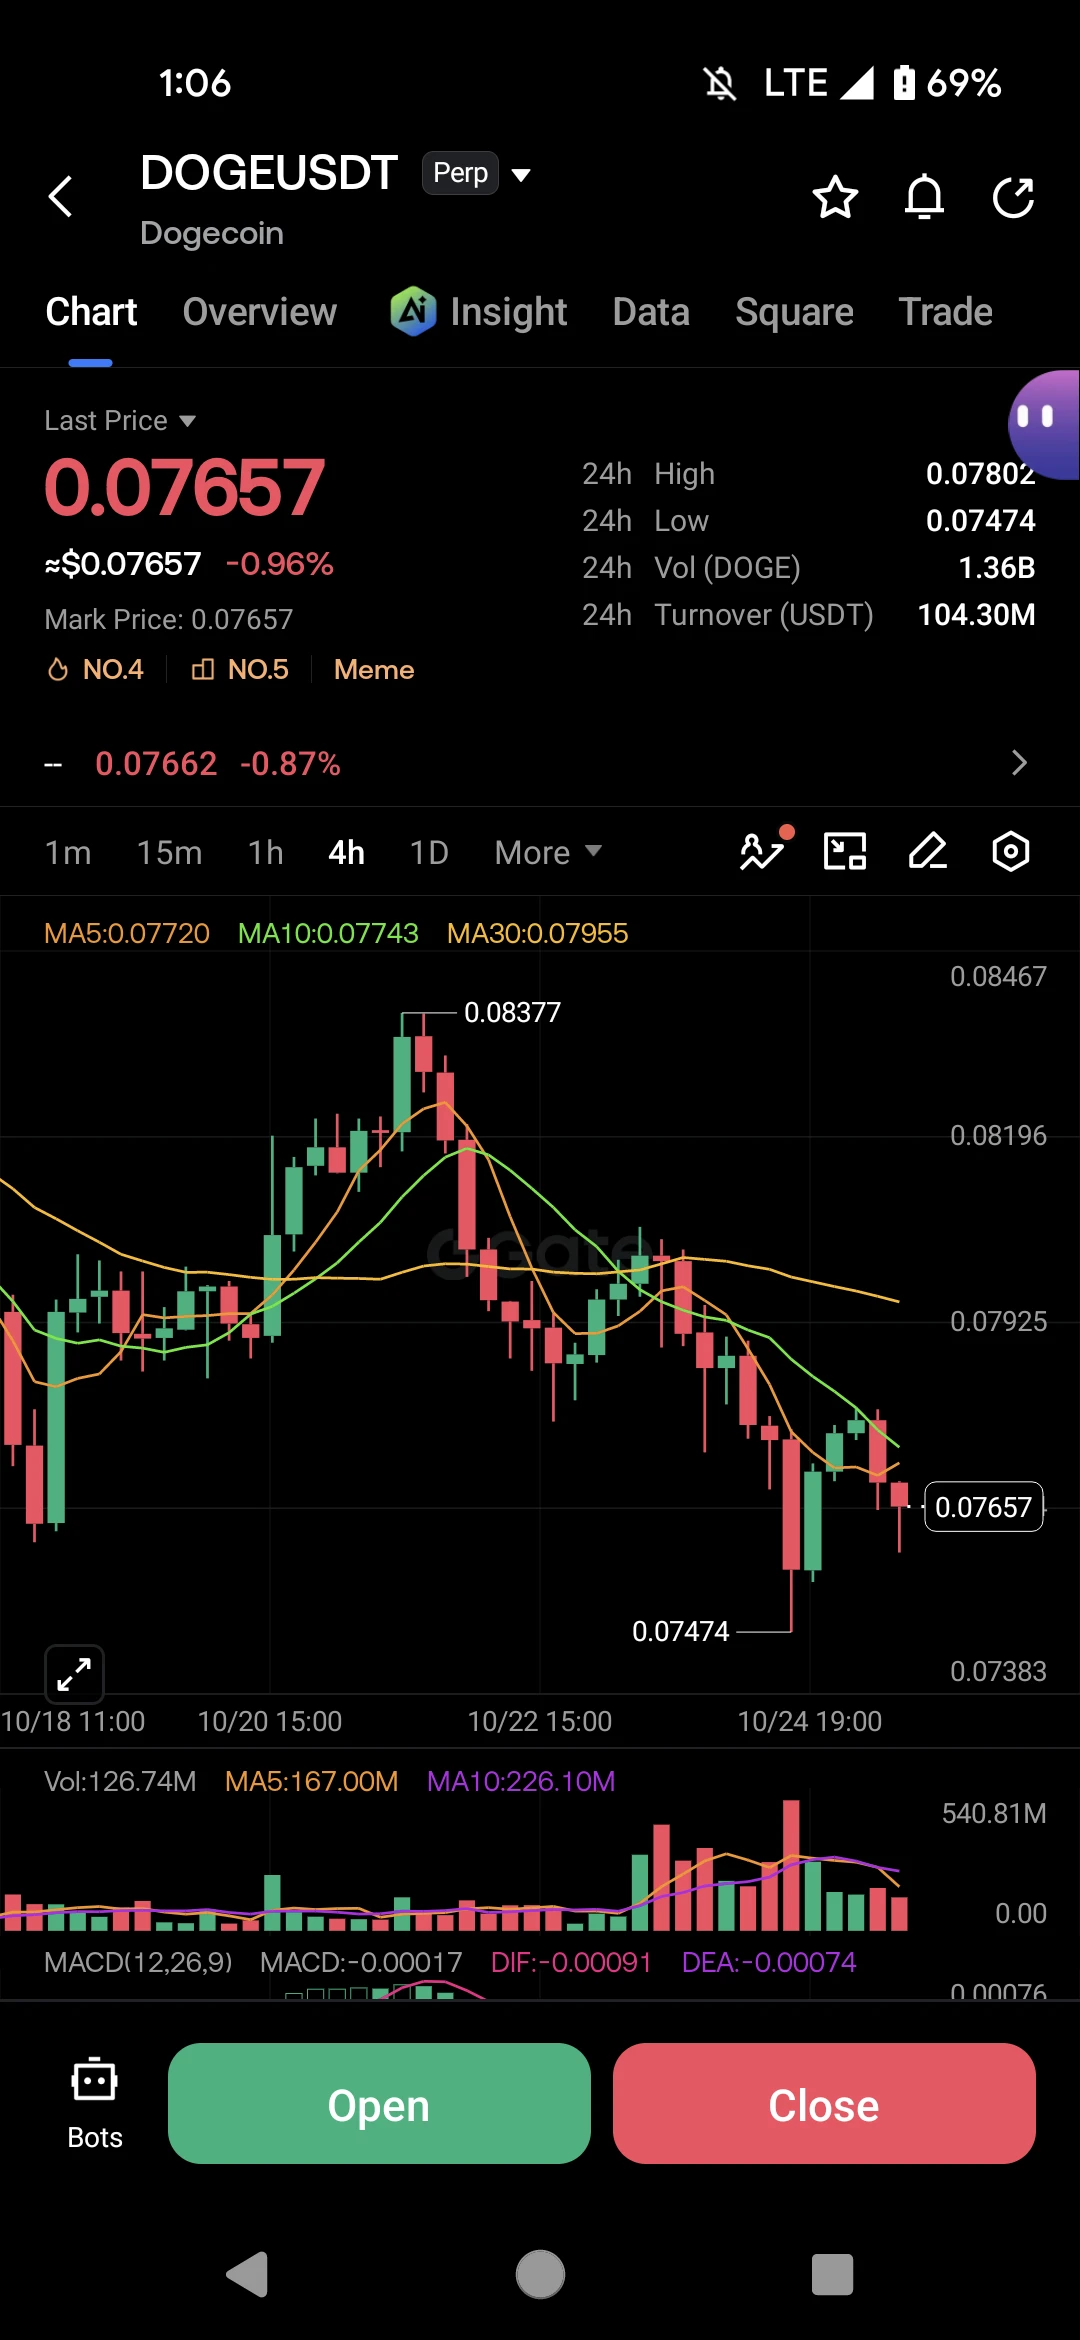
Better to lose more than chase a short!!!!!
What’s your view on what comes next? Duoduo will update after dinner~
post-image
-5.079% is the shift shaking up $AVAX today, pushing the price to $10.223. Why does this matter? Look at the gap between the 24h high of $10.985 and the 24h low of $9.764. This spread represents daily volatility. Volatility measures how wildly a price swings in a set timeframe. Higher volatility means wider price swings, which demands wider stop-losses to avoid getting wicked out prematurely. Watch how the volume reacts as AVAX hovers near these boundaries. Learning takeaway: Always adjust your position size down when daily volatility expands to manage your downside risk. Not financial advice.
post-image
AVAX-5.63%
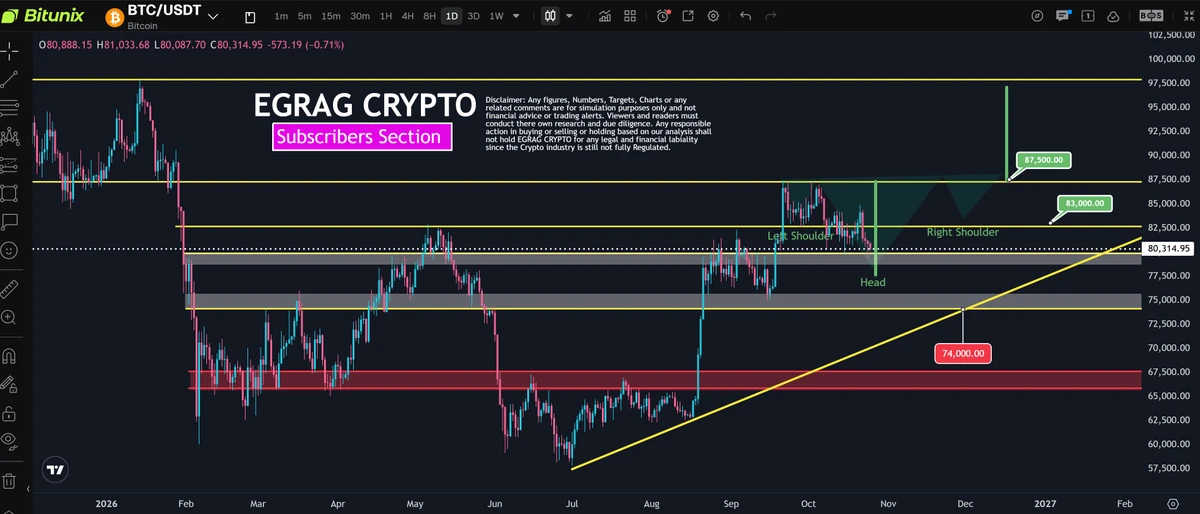
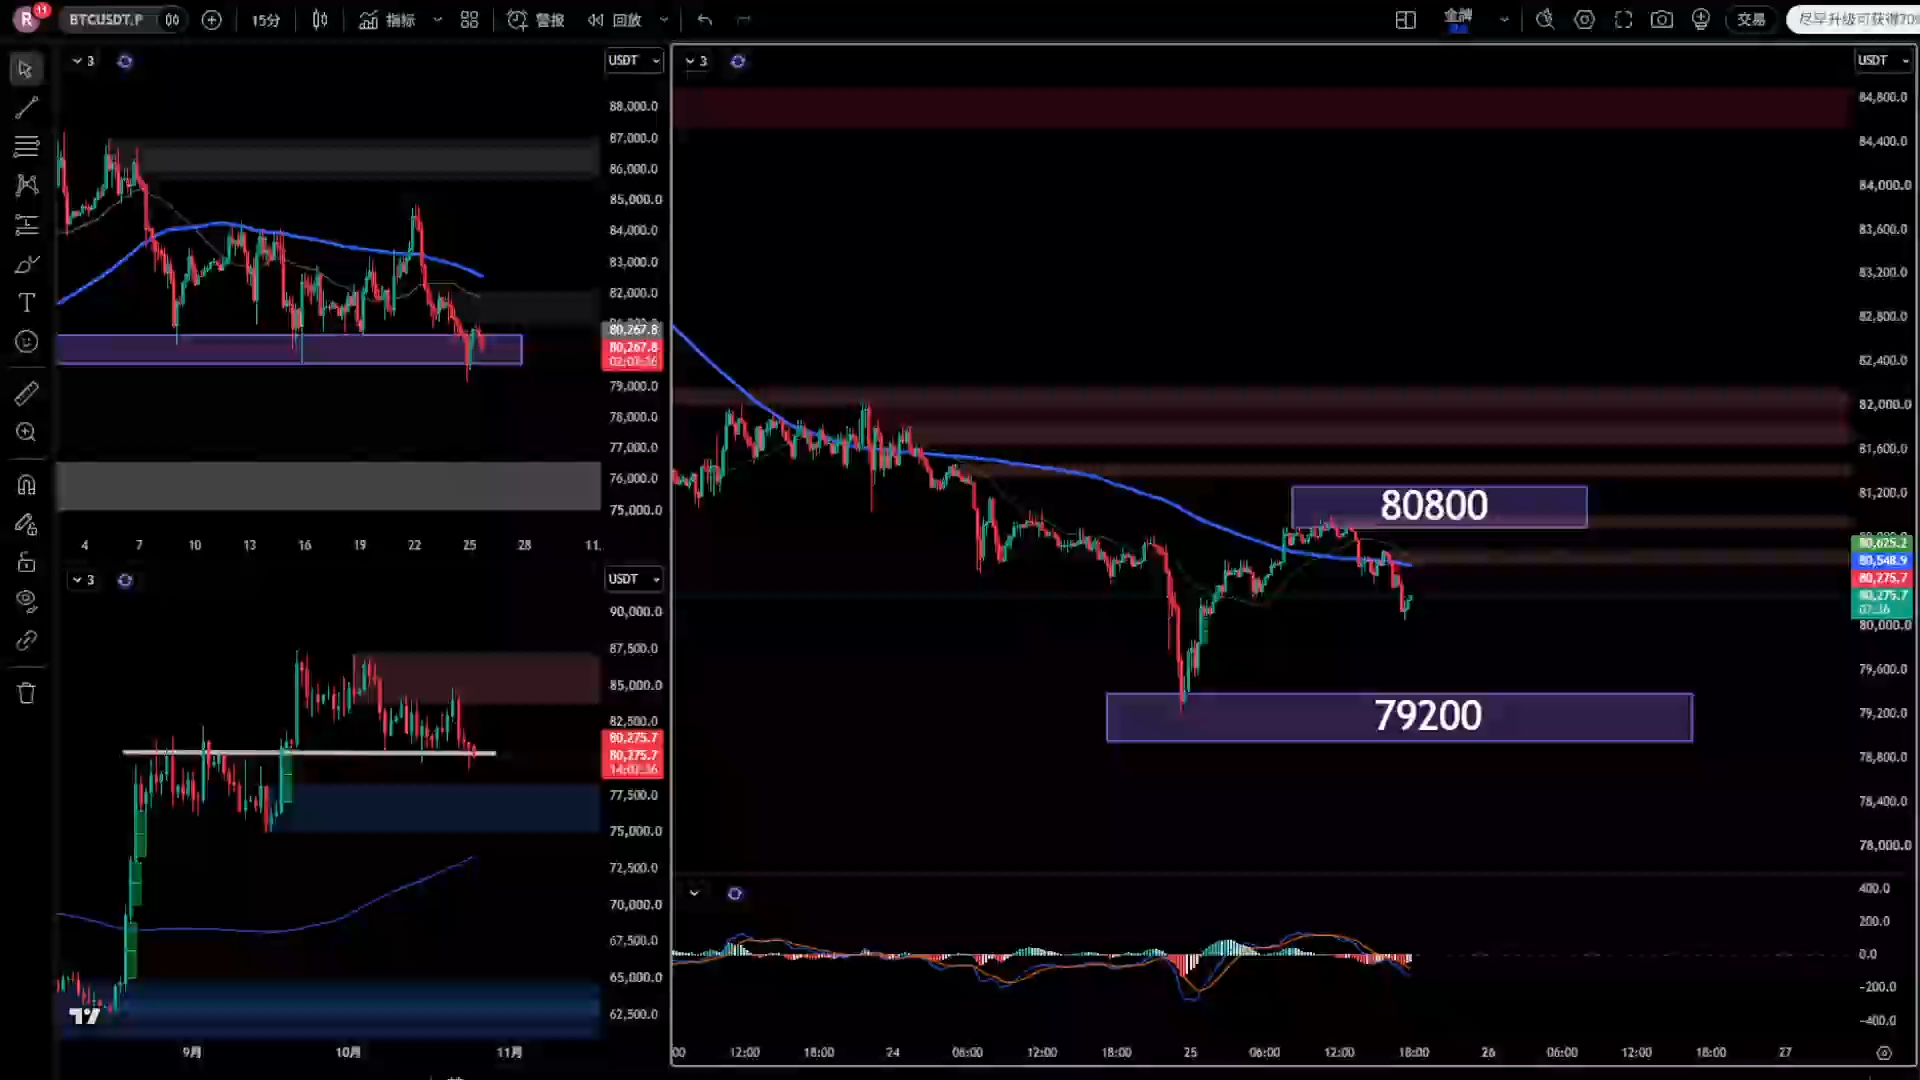
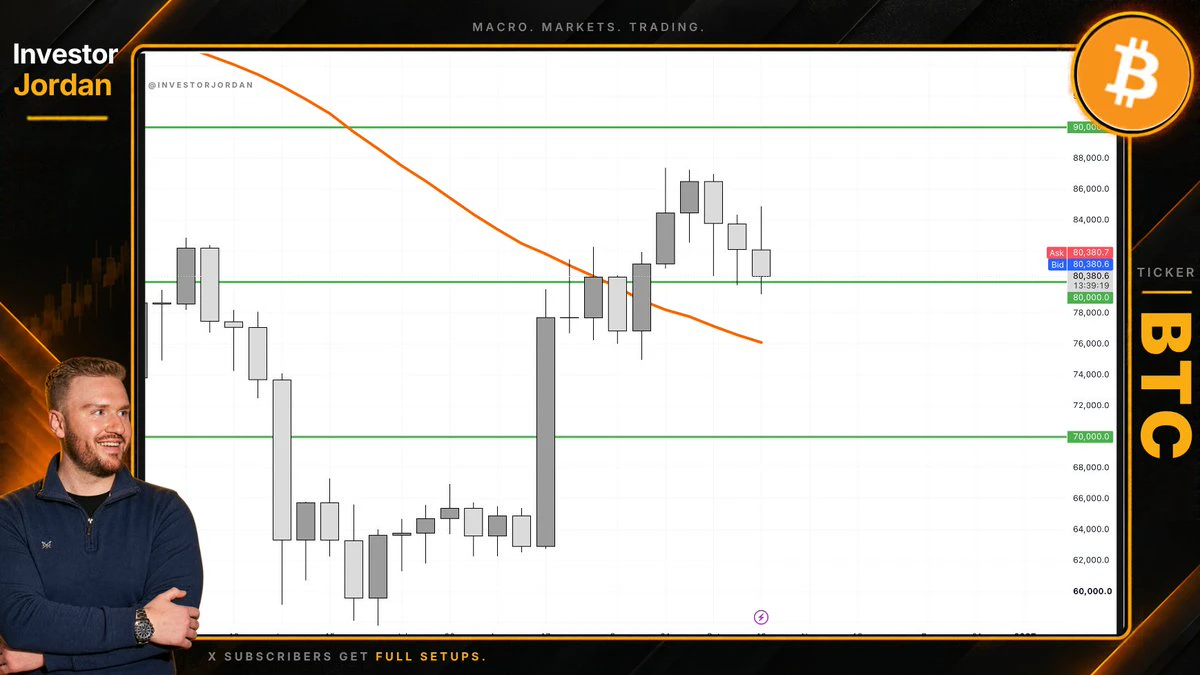
After testing the daily-chart support and rebounding, it is now at 823 (“duō” as written), with the 84–86 range in sight. #btc
post-image
BTC-0.49%
$SOL The overall crypto market is down at the moment, and that includes Solana. There were about 20 million in long positions in Solana that were closed.
The overall crypto market liquidated millions and millions today. Also, there were some outflows happening with ETFs of Solana happening.
However, you know, within a week or two, all of this is going to flip around. There is just too much interest in Solana and crypto as a hold. The trading volume is up over 48 percent for the day. Investors and traders are still trading Solana at a high level.
post-image
SOL-4.22%
  • 1
#BTC回调触及81000美元
BTC Retests $81,000: A Rebound Is Here, but a Bottom Still Needs Proof
Bitcoin pulling back from around $87,000 to briefly touch $81,000, followed by a recovery toward $82,000, creates an important decision point. My view is that the rebound deserves attention, but it does not yet settle the debate between a temporary recovery and a lasting bottom. A market can bounce because sellers pause, short positions close, or buyers begin testing support. Those forces do not all produce the same outcome. What matters next is whether buyers can defend the recovery when selling pressure r
GateSquare
📉 BTC retests $81,000, rebound underway—is the bottom in?
Just a few days ago, the market was still discussing 90K, but BTC quickly pulled back from around 87K, briefly touching $81,000 before rebounding to around 82K.
The market rhythm has suddenly changed, and the divide between bulls and bears is becoming increasingly apparent.
Some believe the area around 81K is an opportunity to build positions in a new round, while others worry this is merely a brief rebound amid a downtrend.
Several key questions now deserve attention:
📊 Can the 81K support hold, or will 80K be tested next?
💰 After outflows from spot BTC ETFs, can buying demand return?
🏦 With the Fed remaining hawkish and CPI due to be released soon, will macro pressure continue to affect the market?
Bring #BTC回调触及81000美元 to Gate Square to share your market outlook, trading strategy, or position review.
Whether you are bottom-fishing, waiting on the sidelines, or reducing your position, you are welcome to share your reasoning.
👉 https://www.gate.com/post
  • 2
  • 1
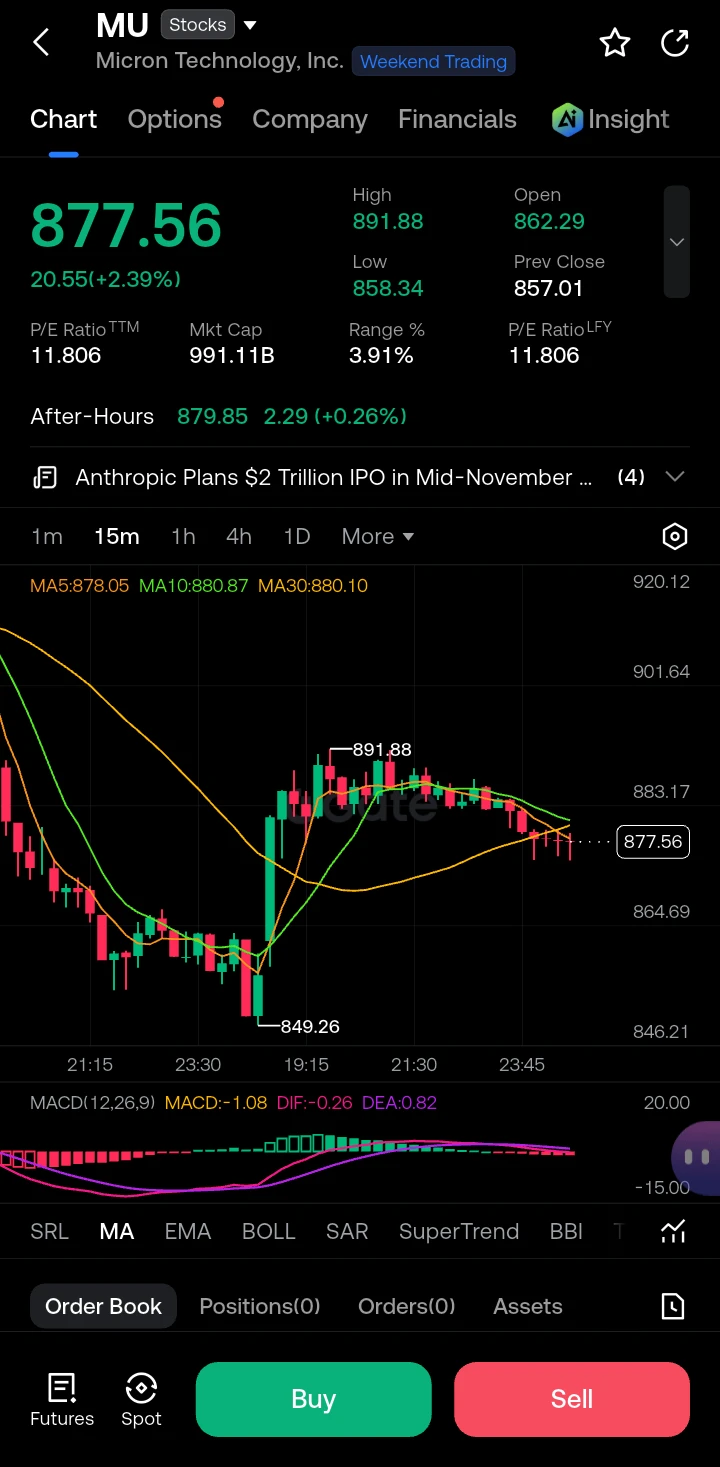
$MU $BTTC hits even 1 cent, I'm a millionaire. 😐
The math is simple: 100M BTTC × $0.01 = $1,000,000.
Today it's trading around $0.00000037. So yes, a small dream with a huge supply. 😅 I'm not expecting a miracle, just stacking patiently and watching the BitTorrent Chain ecosystem grow.
Realistic? Probably not. Fun to dream? Absolutely. 🚀
What's your $BTTC bag size? 👇
#BTTC
MU-4.83%
  • 1
BTC and Ethereum market surges predictions
live-cover
LIVE3,164
#AIStocksFallALABDropsOver9% 📉 #AIStocksFall — ALAB Drops Over 9% as AI Chip Stocks Face Pressure
The AI trade just hit another reality check. ⚠️
On October 8, Astera Labs (NASDAQ: ALAB) fell 9.21% to $347.05, losing $35.20 in a single session. The decline came as investors pulled back from AI-related semiconductor stocks amid renewed concerns about AI revenue expectations and the enormous cost of building AI infrastructure.
But this sell-off raises a bigger question:
Is the AI growth story weakening — or are investors becoming more selective about valuations?
🔍 WHAT TRIGGERED THE SELL-OFF?
post-image
SNDK-4.91%
  • 1
WTF.
A swarm becomes the whole.
Hot CPI: A Rate Hike—or a Longer Wait for Relief?
Inflation can unsettle markets without forcing the Federal Reserve to raise rates.
The crucial shift is in the expected policy path, not the CPI headline alone.
Here is how to separate October tightening risk from a temporary market scare.
What would change?
In this hypothetical scenario, CPI exceeds expectations. That could strengthen October hike expectations, but the adjustment might instead mean fewer anticipated cuts or a longer hold. Without verified market pricing, assigning a probability would be speculation.
Composition matters: persis
post-image
xxx40xxx
Hot CPI: October Hike Risk or Delayed Rate Relief?
Markets can tighten financial conditions before the Federal Reserve changes rates.
An upside CPI surprise matters most when it changes the expected policy path—not merely the headline.
The distinction helps explain when pressure on crypto and U.S. stocks could persist.
A surprise is not a verdict
If CPI exceeds expectations, October hike expectations could rise. But investors might instead anticipate fewer cuts or a longer hold. Without verified starting probabilities, the magnitude of that shift remains unknown.
Persistence matters more than surprise alone. Broad-based core inflation would strengthen the tightening argument; an isolated energy increase would offer weaker evidence. Employment trends and Fed communication could reinforce or challenge either interpretation.
Where the pressure lands
If expected interest rates and Treasury yields rise, equity valuations could weaken as future profits are discounted more heavily. Earnings provide a separate test: resilient margins and guidance could cushion the impact, while deteriorating profits could compound it.
Crypto could face reduced speculative demand and tighter financing conditions. Leverage can amplify price moves, but losses are not inevitable: positioning and expectations already reflected in prices influence the reaction.
Strategy: separate confirmation from noise
A sustained rise in yields alongside restrictive Fed communication would strengthen the bearish scenario. Cooling underlying inflation or a reversal in bond-market repricing would weaken it.
One important countercase: weaker employment could reduce hike expectations yet still hurt stocks through recession fears. Easier policy expectations are not automatically bullish.
A disciplined framework watches yields, earnings guidance and crypto leverage together rather than chasing the first move.
Risk: Inflation releases can trigger reversals, slippage and leveraged losses. This is educational analysis, not personalized investment advice or a profit guarantee.
What evidence would persuade you that October’s dominant risk is renewed tightening rather than weakening growth, and why?
$BTC $GT $ETH
#ShareWeekly #weeklyshare #FedSeptemberMinutesLeanHawkish #GateSquare
repost-content-media
BTC-0.49%
GT-0.82%
ETH-2.96%
$SUI After breaking below the moving averages, can it still hold up in the short term?
Conclusion first: The technical picture has weakened; the rebound favors shorts rather than longs, and 1.0561 looks more like a continuation point in the decline than a bottom.
$SUI The current price is 1.0561, down 7.06% over 24h, with a trading volume of 112.7M USDT, indicating a high-volume sell-off. In terms of the moving-average structure, the price has fallen below MA5 and MA10, with MA5 beginning to cross below MA10 to form a short-term death cross. MA20 has turned downward after flattening, breaking
post-image
SUI-5.88%
ME-3.09%
The wick-driven liquidation shakeout is over! Don’t rush to treat this rebound as a reversal or bottom-fishing opportunity!
Many people see the long lower wick pulling price back up and can’t wait to go long. But let me remind you: a recovery rebound after a sharp drop ≠ the arrival of a bottom. Today, I’ll fully explain the underlying market logic, the news environment, and the key resistance and defense levels.
Why did the market quickly rebound after plunging to new lows?
1. Concentrated leverage liquidations created an extreme wick
After a prolonged decline, many low-entry long positions w
ETH-2.96%
BTC-0.49%
10.9 BTC public strategy
$BTC Long trade setup
  Entry range: Prefer waiting for a pullback to around 820 before lightly entering a long
  Stop-loss defense: Around 815 (a downside wick is highly likely; set according to position size, and execute planB⬇️ after a break below)
Take-profit levels
  First take-profit: Around 830 (short-term resistance
  Second take-profit: Around 835 (previous high-volume trading area)
Third take-profit: Around 840 (execute short planB after stabilization here)
Long-term target: Above 855
Trading factors: The price began rebounding from n
post-image
BTC-0.46%
#原油# The rebound broke through 91.98, but I think it is only a rebound. The second image shares my view. $CL ‌
CL-0.18%
market rebound
live-cover
LIVE2,305
ETH rose 0.91% over a 15-minute window, representing a technical rebound after the previous pullback, driven by a recovery from oversold conditions. However, it lacks a clear event catalyst, while sell orders dominate the order book and liquidity remains thin, limiting the gain. ETH is down 3.71% over 24 hours and 8.48% over 7 days, with the medium-term outlook still weak. The sustainability of the rebound remains to be confirmed by trading volume and buying pressure.
post-image
ETH-2.96%
Load More

Join 40 M users in our growing community

⚡️ Join 40 M users in the crypto craze discussion

💬 Engage with your favorite top creators

👍 See what interests you

Trending Topics

GateAtTOKEN2049

35.2k Views20.8k Discussing

Gate brought a series of major events to TOKEN2049 Singapore! From the official launch of Gate Money to the F1 Red Bull driver meet-and-greet and the Gate Gala, we witnessed a new chapter of "One Gate, Borderless Finance." Which moment from TOKEN2049 stood out most to you?

BTC Pulls Back to 81000

25.41k Views35.7k Discussing

AIStocksFallALABDropsOver9%

24.61k Views554 Discussing

View More