Share your thoughts
placeholder
Article
162k jobs is a strong gain, but don’t rush to declare that the US economy is taking off!
After seeing US nonfarm payrolls rise by 162k in August, many people may have initially thought: Is the US economy getting back on its feet?
Not so fast.
The data is indeed very strong, far exceeding the market expectation of 56k, while the unemployment rate remained steady at 4.1%. But a closer breakdown shows that employment growth was not broad-based. The food services and bars industry added 59k jobs in August, local government education added 42k, while the information industry actually shed jobs.
Thi
AAPL-2.51%
  • 30
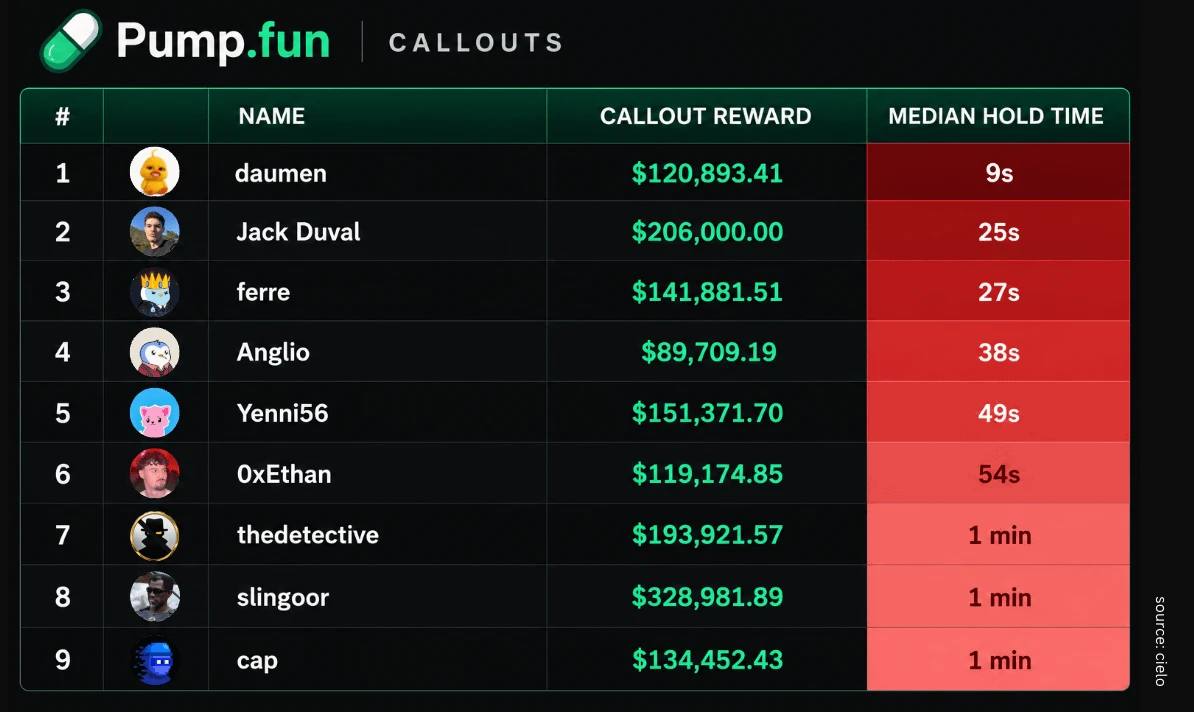
$30,000 on an influencer.
one signup.
globally known guy.
post-image
$UNI ‌ ‌#UNI / USDT - 7.061
Live Data: Price 7.061 +13.16% | 24h High 7.484 / Low 6.199 / Vol 4.26M UNI / Turnover 29.71M USDT | 4h EMA5:6.999 EMA10:6.826 EMA30:6.314 | MFI:64.568 | Today -1.04% / 7d +33.47% / 30d +75.27% / 90d +173.04% / 180d +82.09% / 1y -24.13%
1. PROJECT DETAILS
Uniswap is the largest decentralized exchange protocol on Ethereum and the core of DeFi.
UNI is its governance token. If you hold UNI, you vote on protocol fees, treasury, and future upgrades. Uniswap v4 and Unichain are the two biggest catalysts right now.
• Why it matters: Uniswap processes over 30% of all DEX
post-image
UNI+12.00%
  • 4
  • 2
$ETH ‌ ‌
1. PROJECT DETAILS
Ethereum is the dominant Layer1 for smart contracts and the settlement layer for Layer2s.
• Utility: Gas for DeFi, L2 settlement, staking, restaking, stablecoin settlement. Ranked NO.2 Spot and NO.2 Market Cap on Gate.
• Supply Model: Post-Merge PoS with EIP-1559 burn, net deflationary during high activity. Avg Price 4,289.10 is 41.6% above current price, showing long-term average holders are underwater and overhead supply exists above 2,594.96
. • Performance: 30d +30.77% and 90d +48.20% indicate strong recovery, while 1y -41.48% confirms macro correction still i
post-image
ETH+1.75%
  • 1
crypto market update
live-cover
LIVE1,042
#ETH Ethereum is trading around your quoted $2,492, and the latest market snapshot is also around $2,494, with an intraday high near $2,521 and low around $2,452. The broader 24-hour move is roughly +1.5–2%. Recent market analysis shows ETH continuing to hold its strong monthly recovery, while institutional demand and ETF flows remain important catalysts.
ETH Momentum — Why Traders Are Watching $2,500
ETH's current structure is interesting because price is sitting directly around the major $2,500 psychological level. This is the decision zone between continuation and another rejection.
Recent
post-image
ETH+1.75%
  • 1
🚨 BREAKING 🚨 :
I just found the same pattern which has happened in 2022 and going to happen in 2026
JUST wait and watch everything will be fine
Don't lose hope
Could history repeats itself , what do you think 🤔?
post-image
Everyone’s watching the 1H RSI—but the 15M just flashed 63.6. That’s your tell before SNDK drops.

SNDK/USDT - SHORT

Trade Plan:
Entry: 1789.47 – 1793.59
SL: 1811.33
TP1: 1776.68
TP2: 1766.78
TP3: 1751.92

Why this setup?
Why now?
- The 4H bias is SHORT, but the 1D is stuck in a range—so this is a scalp, not a trend.
- Entry at 1791.53 sits right under rejection; TP1 at 1776.68 is only 0.8% away, offering a fast 1:1.8 risk-reward before the daily range caps upside.
- Don’t chase the long—the 15M RSI is overheated, and ATR (8.25) means volatility is tight enough to snap back to mean.
SNDK+1.47%
ETH at the upper boxed area
is a perfect short opportunity
It is best to wait for the right side and short after a confirmed downward signal $ETH .
post-image
ETH+1.73%
$DOOD 2nd target done 🎯
Set your stop-loss at Target 1 once TP3 is achieved 😉
post-image
Original content no longer visible
DOOD+20.73%
What I posted yesterday is indeed something many beginners just can’t figure out··· Let’s put it in more straightforward terms···
For example, with a 95% win rate, and a stop-loss on every trade, does that mean he is guaranteed to make money?
Not necessarily, absolutely not··· If you see someone constantly emphasizing their win rate while never mentioning their risk-reward ratio, you should basically steer clear···
Using the simplest calculation, suppose every trade is 100u at 100x leverage, with the take-profit set by default at 0.5–0.7%. Then the profit from each take-profit trade is 5
post-image
4-11.96%
Nobody’s watching SUI while it quietly sets up a trap at 0.8012.

$SUI /USDT - SHORT

Trade Plan:
Entry: 0.7989 – 0.8035
SL: 0.8236
TP1: 0.7844
TP2: 0.7732
TP3: 0.7564

Why this setup?
- 4h bias is SHORT (55.4) but 1D is range—so this isn’t a trend, it’s a scalp.
- RSI 15m at 57.07 shows weak upside fuel; price is stalling under 0.8035 resistance.
- ATR 1h at 0.0093 means the move is tight—TP1 at 0.7844 is a 2% drop, not a crash.
- Why now? We’re waiting at the exact entry_ref with invalidation at 0.7738 below. The longer we hover here, the more likely the short triggers.

Debate:
If
SUI+0.52%
Everyone is staring at SUI’s 0.80 while the real money is hiding in the 4h range.

SUI/USDT - SHORT

Trade Plan:
Entry: 0.7989 – 0.8035
SL: 0.8231
TP1: 0.7848
TP2: 0.7738
TP3: 0.7573

Why this setup?
Why now? The 1D trend is flat, but the 4h signal screams SHORT with 55% confidence. Price is stuck at 0.8012—right in the middle of a 0.7989–0.8035 squeeze. RSI on 15m is cooling at 53.8, not overbought, but momentum is stalling. ATR on 1h is only 0.0091, meaning volatility is compressed—and compression always precedes a burst. Targets are clear: TP1 at 0.7848, TP2 at 0.7738. The invalidation a
SUI+0.64%
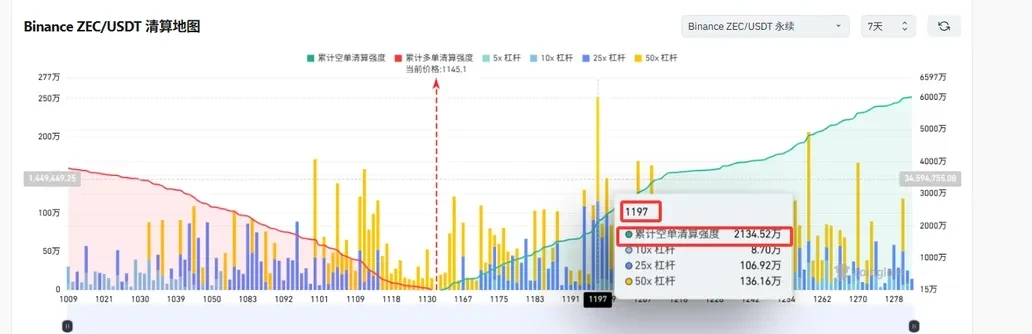
Everyone’s chasing the 1D bullish trend—but the 4h chart is quietly screaming something else about ZEC.

$ZEC /USDT - SHORT

Trade Plan:
Entry: 1174.62 – 1188.62
SL: 1268.99
TP1: 1116.09
TP2: 1072.40
TP3: 1006.87

Why this setup?
Why now? The 84% confidence SHORT on $ZEC /USDT isn't a gut call—it’s a structural divergence.
- RSI (15m) at 58 shows weak momentum, not exhaustion buying.
- ATR (1h) at 28.0 means volatility is compressing—breakouts are violent, and the setup favors downside.
- Entry zone (1174–1188) sits right under a rejected high, while TP1 at 1116 is a 5% drop from here
ZEC+16.77%
#BTCReclaims80K
BITCOIN AT $79,907: THE $80K BATTLE IS NOT OVER
Bitcoin is back at $79,907, sitting just below the psychological $80,000 level after a week of violent swings. The market has already shown that bulls are willing to defend the lower levels, but Friday’s jobs shock proved that macroeconomic data can still overpower even strong institutional demand.
The real question now is simple:
Is BTC preparing for another breakout above $80K, or is this just another temporary recovery before a deeper correction?
📊 THE WEEK IN ONE VIEW
Bitcoin has experienced an unusually wide range over the
BTC+0.28%
Gate Reaches 60 Million Users! Veteran Users, Come Together—New Users, Don’t Be Shy
60 million is a very large number.
But if you break it down, it is actually made up of real trading accounts, market experiences, and countless moments of hesitation over whether to “buy or not buy.”
Some people started using Gate early on, witnessing the crypto market gradually evolve from a niche circle into a global phenomenon; some first encountered digital assets during a bull market; and others may have simply registered an account after a friend said, “This thing has been really popular lately,” opening
BTC+0.28%
  • 40
With this trend, I don’t even need to think—the account is dancing on its own. When the whole screen was glowing green, $ZORA was lying around $0.00793, completely motionless. While everyone else was cutting losses, I saw a pullback holding firm, with funds buying every dip. That signal was obvious enough, right?
As expected, when I checked the chart after lunch, it shot straight up to $0.00853 in a single move. The +182.57% profit went securely into my pocket. What a comfortable feeling. This move was purely because the market was in a good mood and casually scattered some gold coins, one of
post-image
ZORA-3.65%
DOGE+2.74%
ETH+1.73%
#GateEventContractTradeSharingChallenge #ZEC
Zcash (ZEC) is showing exceptionally strong momentum. With your quoted current price around $1,189, the latest market data places ZEC around $1,184, with an intraday high near $1,204 and low around $1,005. That means the 24-hour move is roughly +16–19%, depending on the exchange and exact snapshot.
The most important development is that ZEC has successfully moved above the psychological $1,000 area after breaking through a major multi-year resistance zone. Recent reports attribute the acceleration partly to a short squeeze, with roughly $13M+ in Z
ZEC+16.78%
Load More

Join 40 M users in our growing community

⚡️ Join 40 M users in the crypto craze discussion

💬 Engage with your favorite top creators

👍 See what interests you

View More