
Share your thoughts
placeholder
Article
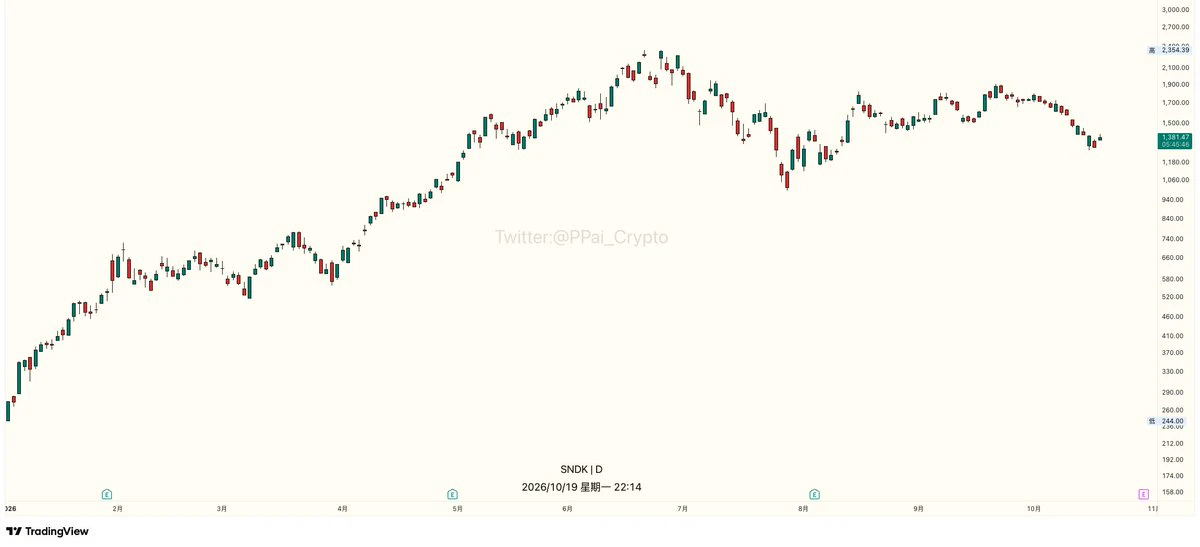
#JapanRealEstatePowerChipStocksRise
Japan’s stock market continues to attract attention as investors focus on two important themes: real estate and semiconductor-related companies.
Recent trading has shown strong interest in Japanese chip and AI-related stocks. Semiconductor names such as Advantest, Tokyo Electron and Kioxia have been among the companies drawing significant buying interest, reflecting the continued global focus on AI infrastructure, advanced computing and memory demand.
The semiconductor story is particularly important for Japan because the country remains a major part of the
post-image
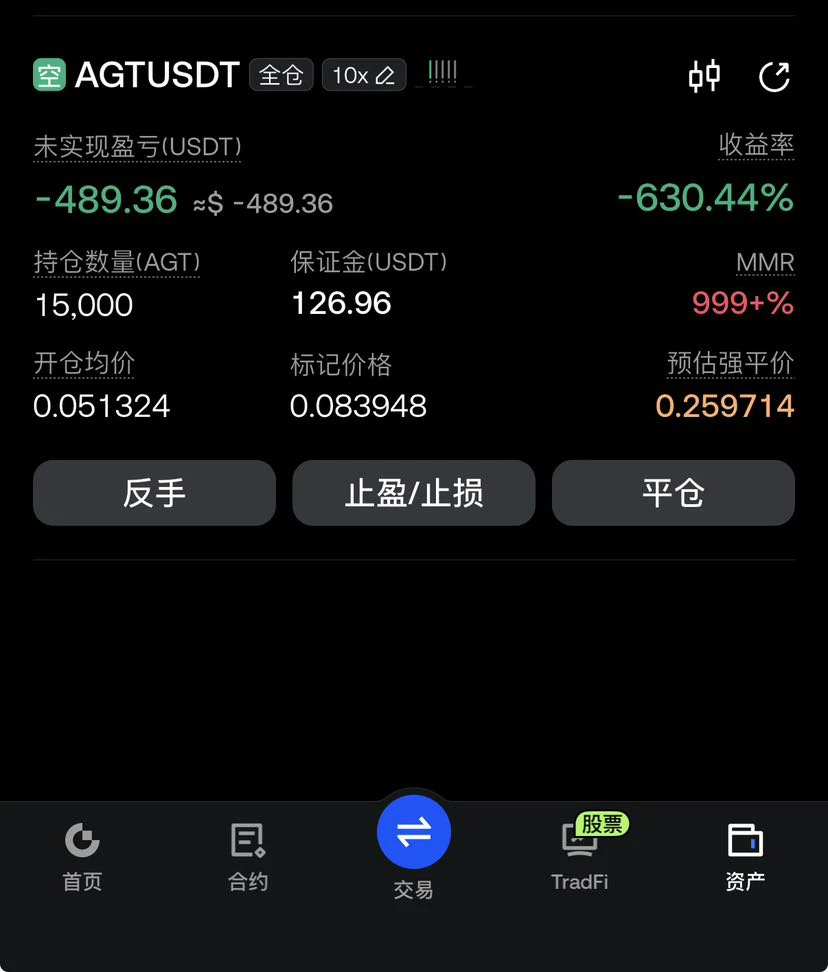
$AKE bought the dip, bought the dip, bought the dip, bought the dip, bought the dip; once it gets pumped up, sell everything again,
AKE-8.69%
#SUI is back above $0.80, and this is the part of the chart I am paying attention to.
The move is not just a one-day bounce. SUI went from roughly $0.686 on September 15 to above $0.81 within a few sessions, and the latest market data has it around $0.83. That puts the short-term structure firmly back in recovery mode.
The bigger question now is whether $0.80 becomes support or whether this move turns into another rejection.
The current market data shows SUI around $0.83, with roughly 8.5% 24-hour gains and more than 14% seven-day gains. Spot volume is around $226M, while futures volume is clo
post-image
SUI+0.26%
BTC-0.23%
AURORA+5.80%
#日股地产电力半导体板块走强 Japanese stocks are showing an interesting split after the latest BOJ decision.
The Nikkei 225 closed at 65,018.95, up 1.38%, after the Bank of Japan raised its policy rate by 25 basis points to 1.25%, the highest level in 31 years. What makes this move interesting is that the market reaction was not uniformly defensive. The yen weakened beyond 157 per dollar, while Japanese equities moved higher. The BOJ decision was also divided 7–2, which helped the market interpret the move as less aggressive than a straightforward tightening signal.
Looking underneath the index, three group
post-image
JPN225+0.23%
USDJPY+0.58%
The Meme market is one of the fastest moving parts of crypto. One moment, a token is quiet and overlooked, and the next, volume, social attention, and price action can completely change the picture.
But I don’t think every Meme token deserves attention simply because it is trending.
When I look at the Meme market, I’m more interested in the combination of price structure, trading volume, liquidity, market attention, and momentum. A sudden price spike can attract traders quickly, but the more important question is whether that momentum can actually hold.
If a Meme token continues making higher
post-image
MEME-1.80%
TOKEN+1.33%
  • 4
$AKE AKE Just Went Parabolic | Can AKEDO Keep Flying?
AKEDO pumped 10x in just one month, and people are still out here asking, “wen alt szn?”
AKE is trading around $0.09, with roughly +51% in 24 hours and +432.5% over the last seven days, putting its market cap around $2.1 billion. The token has also pushed into a new all time high zone, meaning the market is no longer trading against a well established resistance ceiling.. it is effectively in price discovery
That kind of momentum can attract fresh liquidity fast, but it also means volatility can become absolutely brutal when traders start c
post-image
AKE-7.22%
MARKET OVERVIEW
live-cover
LIVE54
Insiders are quietly building a massive short position on NEAR

$NEAR /USDT - SHORT

Trade Plan:
Entry: 4.1348 – 4.2048
SL: 4.6061
TP1: 3.8426
TP2: 3.6244
TP3: 3.2972

Why this setup?
Why now? The daily trend remains bullish yet the 1h price sits at 4.1693, barely above the entry zone of 4.1698, creating a deceptive calm before a sharp reversal. The 1h ATR of 0.139834 shows volatility is compressed, which often precedes a violent expansion in the direction of the short bias. The 15m RSI at 67.11 signals the last burst of long exhaustion before momentum flips. Targets are stacked at TP1 3.84
NEAR+17.72%
I was incredibly stupid: my short hit stop-loss, so I thought about opening a long. As soon as I opened the long, it retraced and hit stop-loss; I opened another one, and it immediately retraced and hit stop-loss again.
Learn a lesson, learn a lesson
Don’t open positions recklessly; learn how to set take-profit and stop-loss levels. Don’t look at minute charts; start with the 15-minute chart.
The week has just begun. The direction is uncertain, so don’t open positions recklessly.
$ETH
post-image
ETH-0.09%
  • 1
#ShareWeekly
AVAX/USDT
🚀 AVAX/USDT Daily Chart Analysis: Relief Rally or Trend Reversal? 📈
$AVAX has surged nearly +10% today, currently trading around $11.101, printing a massive bullish daily candle. Let’s dive into the 1D chart to map out the next moves.
📊 Chart Breakdown:
· Macro Trend: Still bearish overall (from $36 down to $5.645), but we are seeing a strong local reversal.
· Bottom Formation: We saw a capitulation wick down to $5.645 with high volume, followed by a period of consolidation (the small purple box/triangle) and now a breakout.
· Momentum: The bottom indicator (likely
AVAX+15.87%
Quick short trade on $MINA
Enter now, sell at 0.11600 or 0.12000
First target 0.11000
Second 0.10800
Third 0.10600
Last 0.10400
-+ Stop loss above 0.13300
post-image
MINA+8.31%
Gold is range bound but a hidden SHORT setup is forming.

$XAU /USDT - SHORT

Trade Plan:
Entry: 4374.65 – 4376.31
SL: 4383.43
TP1: 4369.52
TP2: 4365.54
TP3: 4359.58

Why this setup?
Why now? The 4h trend shows a range while the 1h price sits at 4375.48, exactly at the entry_ref for a SHORT bias. The 15m RSI at 46.42 signals weakening momentum without being overbought, supporting a potential move lower. The 1h ATR of 3.311683 defines the volatility, making the entry zone between 4374.65 and 4376.31 a precise trigger. Targets are TP1 at 4369.52 and TP2 at 4365.54, with the invalidation level
XAU-0.07%
UPDATE: Bitcoin jumped 6% to $81,034 as oil supply fears hit global markets.
The move wiped out nearly $250 million in crypto short positions in four hours.
U.S. bond yields also rose, while oil traded near $98 per barrel.
$BTC now needs to break and stay above $82,000 to continue its rally.
post-image
BTC-0.24%
Insiders are quietly loading $LINK /USDT while the charts scream caution.

$LINK /USDT - LONG

Trade Plan:
Entry: 12.362 – 12.436
SL: 12.043
TP1: 12.666
TP2: 12.843
TP3: 13.110

Why this setup?
Why now? The daily trend is bullish, the 1h ATR of 0.148138 confirms explosive momentum, and the 15m RSI at 59.62 shows room to run before overbought. The entry zone sits at 12.399, with TP1 at 12.666 and TP2 at 12.843 offering clear targets. The invalidation level of 11.651 is the hard line in the sand that protects this setup.

Debate:
Are we hitting TP2 or getting trapped?

⚠️ Personal market an
post-image
LINK+0.27%
5 days: turn 1,000 into 20,000, taking students
#eth
post-image
ETH-0.14%
BTC remains steady
live-cover
LIVE64
A name that has been rising for five straight days has climbed onto the trending list overnight: RENDER—who's scooping it up?
Well, a name that has been rising for five straight days climbed onto CoinGecko's trending list overnight—$RENDER . Current price: 1.662, up 5.7% in 24 hours, with volume reaching 2.478 times the 30-day average.

I'm bullish at this level—don't chase spikes in the short term; I favor buying dips below 1.66, cut losses if it breaks below 1.616 (4h SAR), and talk about acceleration only after it reclaims 1.757.

Two reasons—the daily MACD has formed a golden cross above
RENDER+6.46%
ZEC’s right shoulder has appeared
You can try shorting
Stop loss at 1540
If the pattern forms
There will be a major pullback
post-image
ZEC+2.58%
  • 2
  • 2
Bitcoin $BTC is pushing right back into the $80,000–$81,000 decision zone after reclaiming key market structure. A single wick above $80K isn't enough to call it a full breakout, the real test is whether buyers can flip former resistance into a reliable support floor.

Key Technical Levels to Watch
Breakout Confirmation ($81,000 – $81,700): Sustained 4, hour/daily candles closing above this zone confirm continuation toward $82,500 and potentially $85,000.
Immediate Pivot ($80,000): The primary psychological level. Holding above $80K on pullbacks shows strong buyer absorption.
Key Suppo
post-image
BTC-0.23%
  • 4
  • 1
The market doesn’t explain itself; it just moves, and all you need to do is avoid moving recklessly.

While everyone was still waiting on the sidelines, $CELR held after the pullback and buying strengthened. I noted that longs were worth considering—don’t chase shorts. From 0.002049 to 0.003562, unrealized profit reached +1807.25%. The buildup was truly sluggish, but the breakout feels just as good.

Take profit on 80% first, and protect the remaining 20% at the entry price. Keep an eye on your profits, brother; if it keeps surging, let the profits run.

Have a strategy before the market o
post-image
CELR+16.84%
BNB+0.88%
BTC-0.24%
Load More

Join 40 M users in our growing community

⚡️ Join 40 M users in the crypto craze discussion

💬 Engage with your favorite top creators

👍 See what interests you

Trending Topics

MSTRTopsNasdaq100

74.29k Views3.04k Discussing

Strategy (MSTR) has gained about 48% over the past month, making it the best-performing stock in the Nasdaq 100, while Bitcoin rose roughly 12% over the same period. The company holds 845,050 BTC with a cumulative cost basis of about $63.73B. MSTR is not a pure Bitcoin proxy — its price swings can be more extreme. Can this rally last?

Gate Tops 24H Net Inflows Among Exchanges

26.53k Views3.69k Discussing

BTCRetakes80K

57.39k Views60.73k Discussing

View More