Square
Following
Hot
News
Profile
Share your thoughts
placeholder
Article
Most people are still waiting for the S&P 500 to break above its previous high on strong volume, but I’m more inclined to think that a decline is more likely to come first.
The S&P 500’s candlestick chart increasingly looks like the right shoulder of a head-and-shoulders pattern—the left shoulder, head, and right shoulder lined up in sequence. Volume has not expanded in sync and instead appears hesitant around the right-shoulder area. More importantly, the 52-week correlation between the equal-weight S&P 500 and the market-cap-weighted S&P 500 has fallen to 0.67, the lowest level in history. I
post-image
SPYX-0.20%
Booooooom 💰👇$AVAX The third target has been reached—you didn’t take your eyes off it, so secure your profits. Congratulations to you 🎉🤑💰 It has reached 10.400
post-image
AVAX-5.21%
$CKB Conclusion first: It is not advisable to chase shorts at the current price, nor is it suitable to heavily bottom-fish. The optimal approach is to wait for a rebound before cautiously entering a small short position or staying on the sidelines, using an extremely tight stop-loss to await confirmation signals.
The 24h plunge is 26.38%, and the amplitude across 30 candlesticks is 44.28%, with volatility in an extremely elevated state. In this environment, any attempt to “bottom-fish” is essentially gambling. The moving-average system shows MA5=0.0015804 has crossed below MA20=0.00166705, con
post-image
CKB-27.67%
ENA-12.03%
Layout: Bitcoin, Ethereum, Dogecoin
live-cover
LIVE2,041
  • 3
XRP Ledger Moves to Clarify Security Concerns! Not a Single New XRP Was Minted. Why is the market wo
live-cover
LIVE1,490
Can $RIVN defeat the @hellojintao curse?
post-image
RIVN-2.97%
🚨 Europe may lose the AI race, just like it did with the internet! 🇪🇺 Palantir's Louis Mosley warns this tech revolution is set to be bigger than anything we've seen. Why does this matter? $AI #TechTalk
PLTR-0.04%
Don’t touch $FIL under any circumstances. With today’s -11% bearish candle, people in the group are still asking whether they can buy the dip—I advise you to put the knife down first.
I felt something was off while watching the market this morning. After surging to a high of 1.2688, it has been sliding steadily, with barely any meaningful volume on the rebounds, and every small bounce has been slammed back down. I just checked the market: the current price is 1.1139, with 24h trading volume still at $262 million—volume hasn’t contracted, so what does that mean? It means those who are running a
FIL-10.64%
$W Enters Oversold Territory; a Rebound and a Bottom Are Two Different Things
$W 24-hour change: -11.18%, current price 0.01939. The 1-hour and 4-hour RSI readings are 15 and 53, respectively. Oversold conditions create demand for a rebound, but a rebound only shows that the decline was sharp; a bottom still requires the price to stop damaging the structure.
Let's return to the 24-hour range: low 0.01926, high 0.03175. Where does the current price of 0.01939 sit within this range? That will directly affect the meaning of the same signal. Near the high, strength needs to prove that this is not
post-image
Revenue Meta and Return to Fundamentals have paved the way for the way for outperformance & the revival of this asset class.
We are absolutely cranking it on the port side and institutional allocators are interested in our bags.
This is net positive for all involved.
However, hubris is a bull market trait. We stay humble, zoom out, and gas it as hard as we can.
We take profits to the bank.
We maintain integrity and outwork others.
We let the market come to us.
For now, Wall Street is waking up to the new game in town, and we’re positioned exactly how we’d want to be.
Be more bullish.
post-image
$BTC
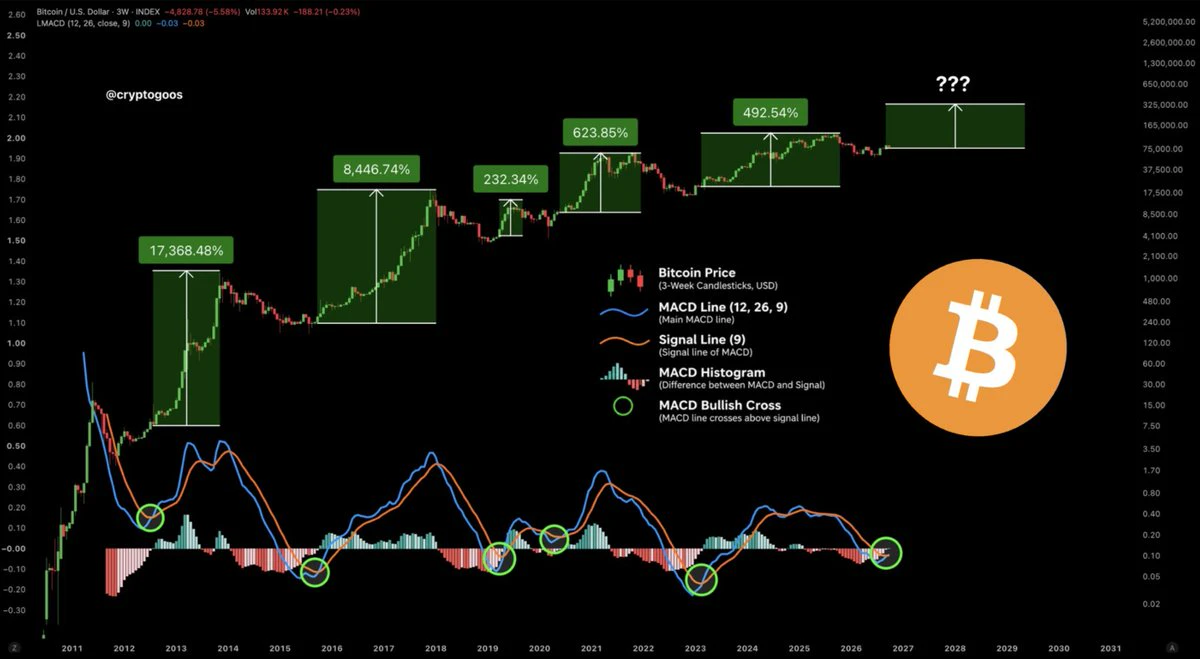
Bitcoin hasn’t cooled off yet, and the daily chart is quietly edging higher again. Right now, there’s only one line that matters: hold above it, and it’ll head straight for the previous high; break below it, and it’ll slide back to around 83K for a breather, where buyers are waiting. Either way, the script is already written: hold, and the rally continues; lose it, and it’ll crouch deeper before bouncing back. 😏 Don’t panic—pullbacks are opportunities to get on board.
post-image
BTC-1.25%
$DOGE
or
$PEPE
? Or another #Memecoin?
post-image
DOGE-3.20%
PEPE-5.03%
MEME-6.11%
MEMECOIN+0.08%
$ONDO /USDT RECLAIMING MOVING AVERAGE SUPPORT FOR A BULLISH CONTINUATION REBOUND ARE BULLS TARGETING $0.5434 NEXT?
Pair: $ONDO /USDT
Direction: LONG
Entry Price: 0.5017
Target Levels (Take Profit)
TP 1: 0.5173 +3.11%
TP 2: 0.5278 +5.20%
TP 3: 0.5434 +8.31%
Stop Loss
SL: 0.4809
Technical Breakdown
ONDO ($0.5014) is executing a measured consolidation phase following its prior upward impulse, holding steady above key support levels. This behavior reflects healthy buyer absorption and prepares the asset for a structural continuation toward overhead targets.
Price action is tightly interacting
ONDO-6.04%
$DOS This data is terrifying. So many bulls are entering now! Aren’t you afraid of another jab?
post-image
DOS-12.02%
The Fear & Greed Index remains in the greed zone at 69, but $BOME is currently priced at 0.0007936, down 27.98% over 24h, with an RSI of only 13.2, a typical extreme oversold reading; MA5=0.00081674 has fallen below MA20=0.00090342, the MACD histogram at -5.945e-06 remains bearish, and the lower Bollinger Band at 0.00073445 is within reach. The broad-market greed sentiment diverges from panic selling in individual coins. If BTC stabilizes, oversold rebound momentum is likely to be released first in assets with negative funding rates—$BOME's funding rate is -0.0138%, with short-side crowding a
post-image
BOME-28.46%
CHIP-14.02%
US Dollar Index (DXY) climbs to its highest level in 18 months.
The dollar index held around 102.2 on Monday, close to the peak of 102.54 reached last week — its strongest since April 2025. The move extends a fourth consecutive weekly gain, the longest streak since 2025.
The drivers behind the move:
• Middle East tensions: Escalation around the Strait of Hormuz and shipping routes is supporting safe-haven demand for the dollar.
• Elevated oil prices: With the US now a net energy exporter, higher crude prices are acting as a dollar-supportive factor rather than a drag.
• Rate expectations: Ris
post-image
BTC-1.25%
  • 2
$STRK Once you get in, it’s a bottomless pit. I’m losing badly
post-image
STRK-25.20%
$FIL After falling this far, the easiest misconception is that a sharp drop automatically means the price is cheap.
I’m watching just one point of divergence: whether there is still buying support after a break above 1.2644. The current price is 1.1384, with volume at 0.29x. The 1-hour and 4-hour trends are both weak, with RSI at 13 and 52, respectively.
If volume continues to expand after a break above 1.2644, the advantage will shift toward the bulls; if the price breaks below 1.1288 and fails to recover, the short-term outlook will be invalidated, and the next level to watch will shift to 1
post-image
FIL-10.64%
Once retail truly returns...
Many #Crypto's will pump 100x on average.
post-image
Load More

Join 40 M users in our growing community

⚡️ Join 40 M users in the crypto craze discussion

💬 Engage with your favorite top creators

👍 See what interests you

Trending Topics

GateWCTCS9GlobalTradingCompetition

35.65k Views5.5k Discussing

Gate WCTC S9 Global Trading Competition is officially live, crossing asset boundaries across crypto, stocks, and CFDs with an 8M USDT total prize pool. The Lucky Launchpad guarantees a win every time, new users get a 20 USDT futures voucher upon registration, and the Event Contract PK tournament features a prize pool of up to 400,000 USDT.[👉 Read announcement](https://www.gate.com/announcements/article/102133)

GateXRedBullWinsSingaporeGP

174.59k Views6.53k Discussing

WillYouBuyDipInKoreanStocks

61.92k Views1.79k Discussing

View More