Share your thoughts
placeholder
Article
Everyone's sleeping on SYMBOL while the daily trend whispers bull.

$SOL /USDT - LONG

Trade Plan:
Entry: 101.7 – 101.9
SL: 100.6
TP1: 102.7
TP2: 103.2
TP3: 104.1

Why this setup?
Why now? The daily trend is firmly bullish, giving the long side a clear macro tailwind at the 4h level. The 15m RSI sits at 52.47, meaning momentum is neutral-to-positive without being overextended, so you are not chasing exhaustion. The 1h ATR of 0.479453 tells us normal price movement is modest, making a push toward TP1 at 102.7 and TP2 at 103.2 realistic from the entry zone around 101.7 to 101.9. If price clos
SOL+0.25%
The protection level hasn’t been broken, so I’ll continue holding this trade. $CP The rebound reached the key-level zone but lacked follow-through, and failed to push higher at the key level, so I took a bearish position. After entry, there was a pullback, but its strength weakened each time, showing that selling pressure remains.

After the unrealized profit reached +1311.4%, I took profit on 80% first and let the remaining 20% run. As long as price does not reclaim the key level, the bearish structure remains intact; once it does, the original logic is invalidated, and I’ll close the remain
post-image
CP-8.11%
ETH+0.44%
SNDK-0.71%
VTHO is range-bound but a 15m RSI of 83 is screaming something most traders will ignore.

$VTHO /USDT - SHORT

Trade Plan:
Entry: 0.000755 – 0.000773
SL: 0.000873
TP1: 0.000682
TP2: 0.000628
TP3: 0.000546

Why this setup?
Why now? The 1h price sits at 0.000764 inside a tight entry zone between 0.000755 and 0.000773, and the daily trend is range which means this move is a breakout attempt. The 1h ATR of 0.000035 shows volatility is compressed, so a RSI at 83.1 signals exhaustion rather than continuation. We are targeting TP1 at 0.000682 and TP2 at 0.000628 with the invalidation level at 0.00
VTHO+55.76%
$AT I’m bearish on this structure. The whale position ratio is 15.71 times the retail account ratio, while futures open interest is only $9M—plainly put, a few people have fully committed to one direction. The market is too thin: DEX liquidity is already limited, and with holdings so concentrated, there’s simply no one below to catch it when the whales exit. $HUMA Same problem, with a 6.37x ratio alongside $12M ’s OI. The performance of these coins also speaks for itself: 23 out of 206 have retraced more than 70% from their 90-day highs, with a median decline of -35%. I think the more extreme
post-image
AT-2.43%
HUMA+4.94%
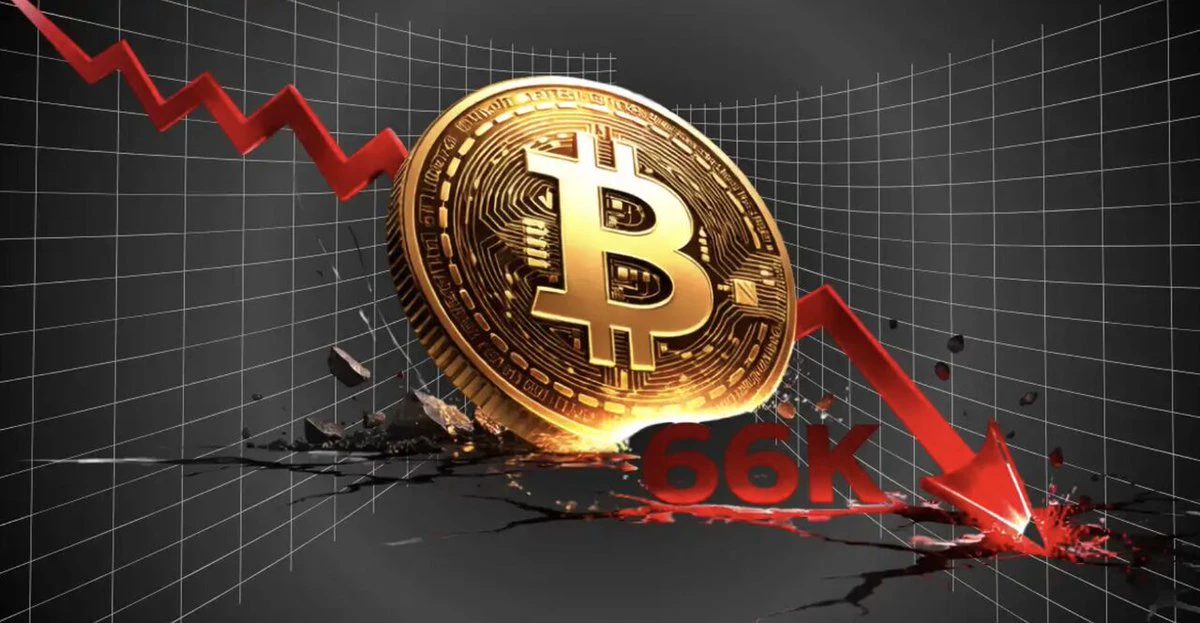
BTC Update
live-cover
LIVE1,666
#OracleQ1EarningsBeatStockUpOver5% Oracle Q1 Earnings Beat — Stock Jumps Over 5%
Oracle has delivered a strong fiscal Q1 FY2027 performance, beating Wall Street expectations and showing that its aggressive expansion into AI and cloud infrastructure is gaining serious momentum. The company reported $19.3 billion in revenue, up 30% year over year, while non-GAAP EPS reached $1.92, ahead of analysts’ expectations.
☁️ Cloud Growth Takes Center Stage
Oracle’s total cloud revenue surged 62% to $11.6 billion, while Cloud Infrastructure revenue jumped an impressive 121% to $7.4 billion. This triple-d
post-image
ORCL-1.87%
#SenateReleasesNewCLARITYAct
🔥 Senate Releases New CLARITY Act Is U.S. Crypto Regulation Entering a New Phase?
The U.S. Senate has released a revised 630-page version of the Digital Asset Market CLARITY Act, putting crypto regulation back at the center of the market narrative just ahead of the expected September 15 procedural vote.
For me, this is not simply another political headline. The bigger question is whether the United States is finally moving toward a regulatory structure that can clearly define how digital assets, exchanges, DeFi protocols and financial institutions should operate
post-image
  • 3
  • 1
I was just about to go in and curse it a little, but then I looked at my account and decided to let it pump however it wants while I keep quiet.
While $MAGMA was grinding out a bottom intraday, it held its key level and moved sideways at the bottom. I reminded everyone not to rush into longs and to wait for a pullback to hold before entering. Stronger buying is the real signal; those in a hurry are more likely to lose their chips.
From 0.17163 to 0.23796, +762.89% secured. No logic, no technical analysis—just didn’t close the position, and happened to catch the moment it wanted to pump.
The pr
post-image
MAGMA-3.09%
SNDK-0.71%
BNB-1.11%
#AugustCoreCPIBeatsExpectations Core CPI Beats Expectations, A Fresh Signal for Markets
The latest August Core CPI reading has delivered a result that deserves close attention from traders across both traditional and crypto markets. Core inflation came in above expectations, showing that underlying price pressures remain stronger than many market participants were hoping to see.
This matters because inflation data continues to play a major role in shaping expectations around monetary policy, interest rates, liquidity, bonds, stocks, and ultimately risk assets such as Bitcoin and other cryptoc
BTC+0.02%
ETH+0.44%
  • 7
  • 1
You have 24 hours
Drop your $SOL address
Like & RT
Must Join TG:
post-image
SOL+0.22%
10-year government bond yields fall below 1.7% again, and the bond market is starting to heat up
A relatively clear signal has emerged again in the domestic bond market recently.
The 10-year government bond yield has returned below 1.7%, reaching around 1.69% at one point during the session. The market had previously been repeatedly battling around the 1.7% level, and the latest break below it indicates that demand for bonds is picking up again.
This level is worth noting.
Because when yields move lower, bond prices are essentially rising.
What this reflects is not just bond market sentiment,
post-image
GLDX-1.11%
PAXG+0.09%
  • 4
  • 1
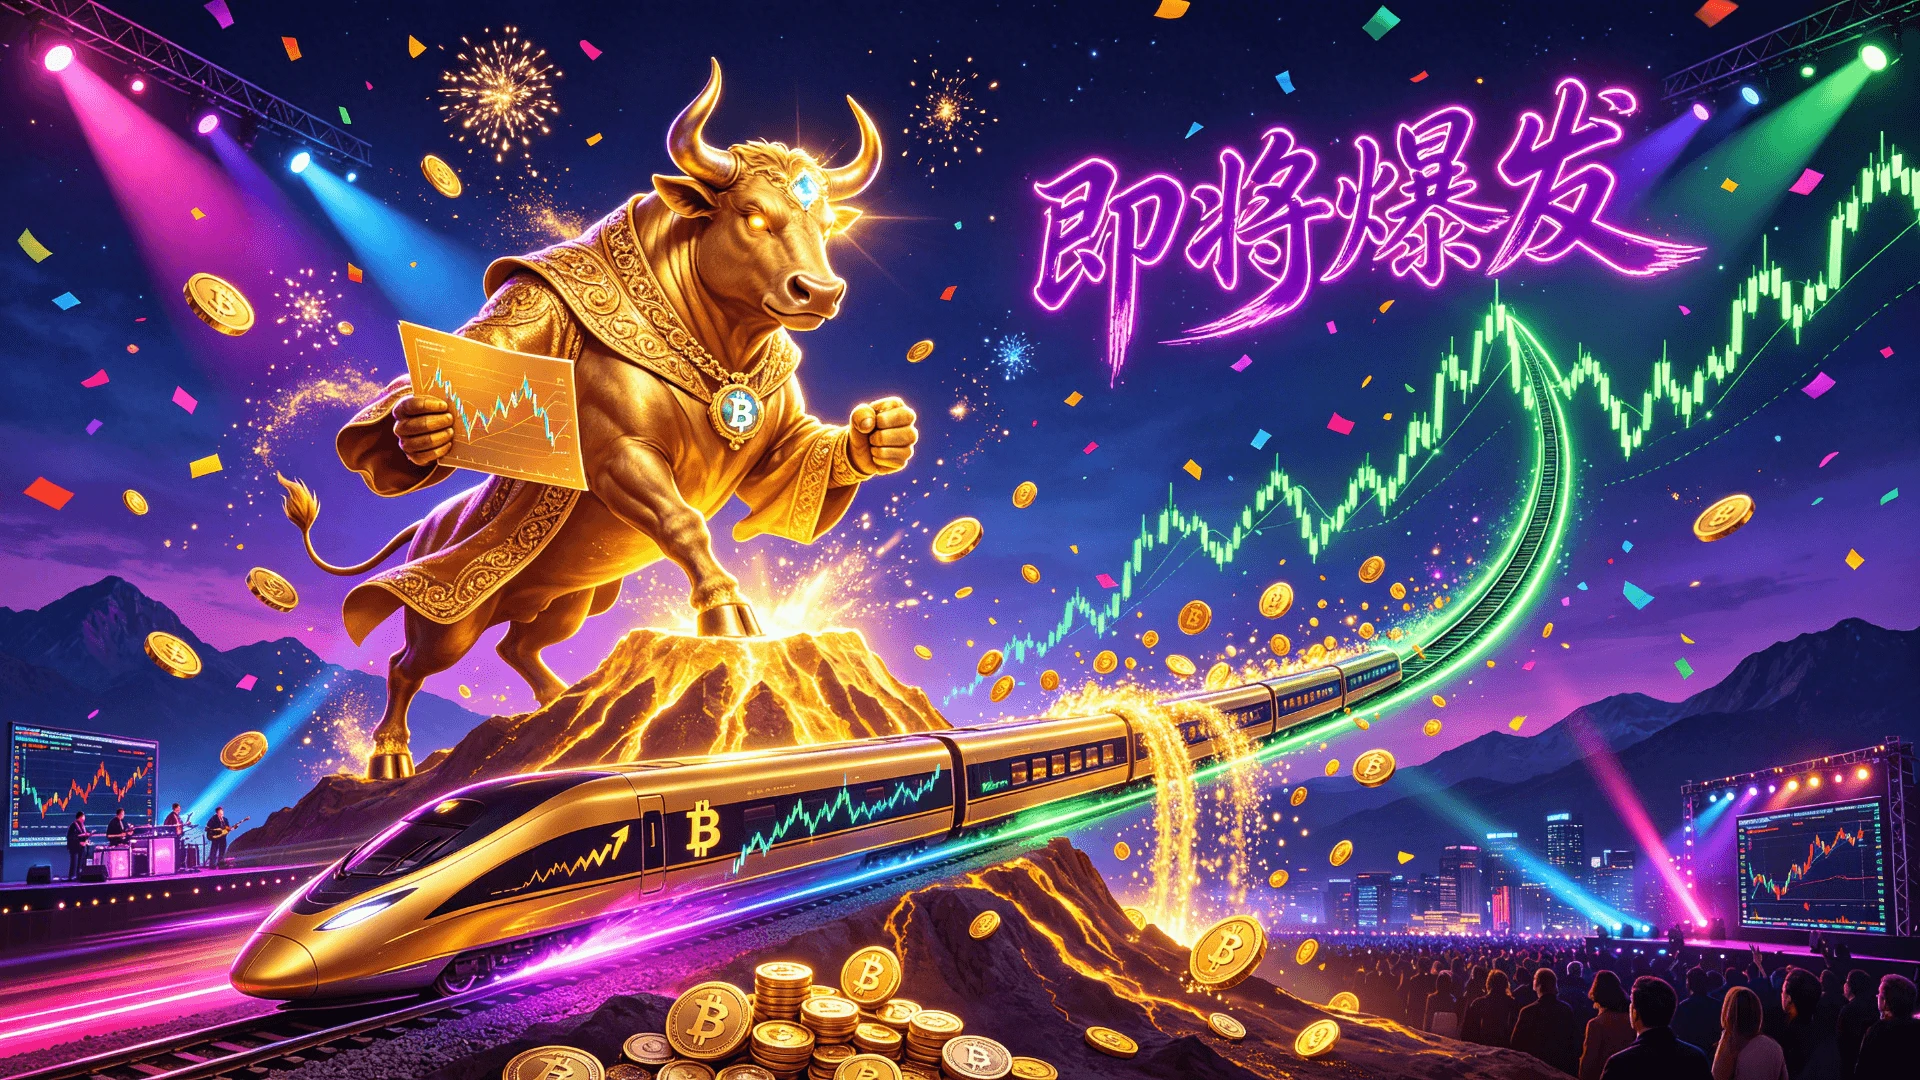
Boarded a high-speed rail train$LSK
post-image
LSK+414.40%
$1000 to $100,000 Crypto Trade Challenge Today
live-cover
LIVE560
I’m handling this short position with an 80/20 approach: take most profits off the table first, and let the remaining 20% ride to see if the move continues. $BEAT repeatedly faced resistance at the key level, failed to hold the breakout, and then confirmed weakness on the retest, so I leaned bearish. There was a rebound while holding, but it failed to reclaim the key level, and I never moved the protection level.

The unrealized profit is now +603.99%, and I don’t plan to bet all the profits on an acceleration. As long as the previous low holds and price quickly recovers, the short side rema
post-image
BEAT-7.73%
SNDK-0.71%
BTC+0.02%
#weeklyshare #ShareWeekly
SUNDAY MARKET UPDATES: BTC AT $77,220, ETH HOLDS $2,520 — WHERE IS THE MONEY MOVING?
The crypto market did not deliver a simple bullish or bearish story this week. Instead, it produced something more interesting: a clear divergence between Bitcoin, Ethereum, institutional flows, leverage and the macro environment.
Bitcoin is now trading around $77,220, while Ethereum is around $2,520. The difference in performance between the two largest crypto assets has become one of the most important signals to watch.
Bitcoin has experienced meaningful weekly weakness, while Ethe
$POWR Signal】Long - 4H huge-volume bullish candle + negative-funding short squeeze
$POWR 1H single-candle volume was 224 million, versus 9.44 million in the previous candle, with volume jumping two orders of magnitude. The price moved above the Bollinger upper band at 0.0803, leaving the 4H upper band at 0.0700 far behind. RSI is 91.05 on 1H and 93.11 on 4H, holding at high levels without pulling back, while buyers continue pushing the price higher.
Funding rate: -0.6149%, pushing short-position holding costs extremely high. Order-book depth imbalance is -5.54%, with sell orders stacked more
post-image
POWR+28.16%
Tom Lee’s “Bottom Theory”: Someone Sitting on $5 Billion in Unrealized Losses Tells You It’s Time to Buy
5.93 million ETH. $5 billion in paper losses.
That’s the situation BitMine Chairman Tom Lee is in now.
And then what did he say?
“Over the next 12 months, the crypto market will be extremely bullish. The four-year cycle bottom will arrive next month.”
A bleeding man is telling you it’s time to buy.
Don’t you think something feels off?
Don’t rush to accuse him of letting his position dictate his thinking.
In August 2025, BitMine built its ETH position at an average price of $3,840 to $3,950,
post-image
BTC+0.02%
SOL+0.22%
ETH+0.43%
I switched to the background to reply to a message, and when I came back, it had already finished the job.

During the repeated intraday fluctuations, $JCT surged sharply but the volume failed to keep up, giving off a strong bull-trap vibe. I called for a short at 0.002429—don’t get fooled by that candlestick.

It’s at 0.001567 now, with +871.23% secured. What a satisfying meal.

Take profits when it’s time. Close 80% first, and protect the cost basis on the remaining position with +871.20%. If it keeps plunging, let the profits run—the cost basis is my protection level.

Being out of a p
post-image
JCT+4.12%
ZEC+1.31%
ETH+0.44%
To be honest, traps often follow unusual moves, and $LSK this market structure just does not look right. Open interest has rapidly shrunk from its highs, yet the price was pushed up directly by a strong bullish candlestick. I have seen this combination many times. It usually does not look like the start of a trend, but rather like leverage on one side being cleared out first. After the shorts are squeezed out, where will the momentum to keep pushing prices higher come from? That is the question I care about most right now. At this point, bullish sentiment has clearly been ignited, but the vol
post-image
LSK
Bullish, targeting 3.
Plunge to 0.5
1 Participants
Ends In 23 Hour
LSK+414.40%
JUST IN: Ampleforth’s Governor Bravo faces a $2.5M treasury risk from a self-drafted, malicious governance proposal; funds are not moved yet. If enacted, it could threaten treasury security and governance integrity. $FORTH / $USDC
post-image
USDC+0.02%
Load More

Join 40 M users in our growing community

⚡️ Join 40 M users in the crypto craze discussion

💬 Engage with your favorite top creators

👍 See what interests you