Square
Following
Hot
News
Profile
Share your thoughts
placeholder
Article
#FedSeptemberMinutesLeanHawkish #每周来晒 #美联储9月纪要偏鹰
The Fed’s Next Move Could Define Bitcoin’s Direction: Inflation, Treasury Yields, and Rate Hike Risks in Focus
The crypto market is entering a critical macroeconomic phase where Federal Reserve policy, inflation data, and Treasury yields could determine the next major move for Bitcoin. The September FOMC minutes released on October 7 have added uncertainty, reminding investors that the fight against inflation may not be finished.
The Federal Reserve has already raised its benchmark interest rate by 0.25 percentage points to 3.75%–4.00%. However
BTC+0.87%
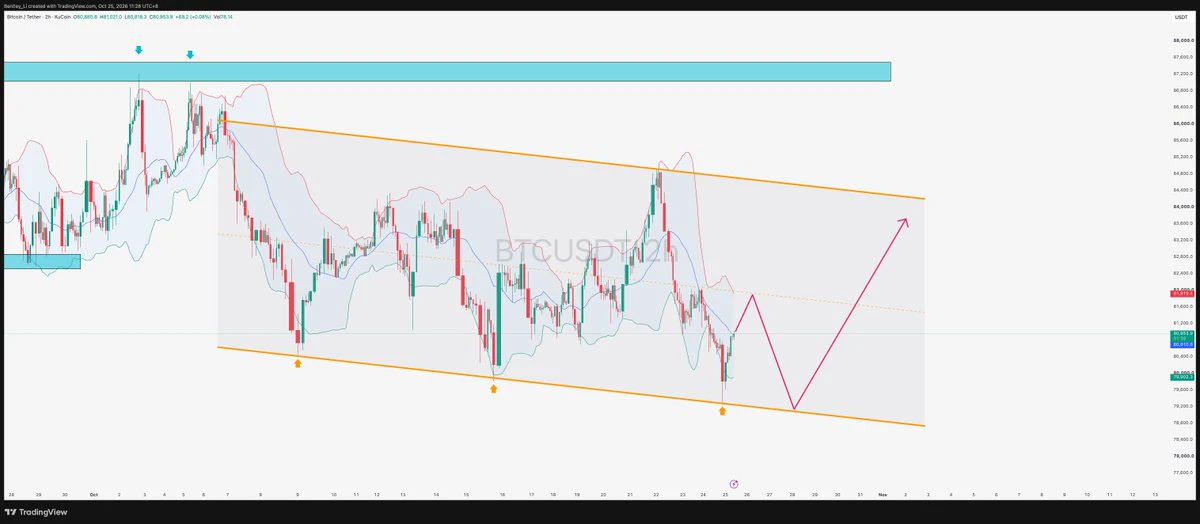
Those holding positions have been suffering these past few days, but if you’re only focused on how much it has fallen, you’re looking in the wrong place.
That CryptoPunk on my list is still standing by the 83000 level he mentioned yesterday—he didn’t mention the size of the drop, only one condition: if this week’s candlestick closes back up, we’re still in a range.
As for the more chilling part that followed: this is only the early stage of the bull market, and what we’re seeing now really doesn’t count for much; when the sharp drops come later, they’ll be larger than this—I’m not vouching for
post-image
BTC+0.87%
#Gate亮相TOKEN2049 Gate Shines at TOKEN2049: Driving Innovation and Global Crypto Connections
Introduction
The global cryptocurrency industry continues to evolve through innovation, collaboration, and the development of new financial technologies. TOKEN2049 is one of the major international events that brings together cryptocurrency leaders, investors, developers, entrepreneurs, and blockchain enthusiasts. Gate’s appearance at TOKEN2049 Singapore highlights its commitment to innovation, global expansion, and building stronger connections across the digital asset ecosystem.
From introducing new f
$W This 12% bullish candle, and I almost became that idiot chasing the pump again.
From 0.0151 to 0.0187, the 24-hour price swing was nearly 24 points, with $46.9M in trading volume. I entered at 0.0162 after seeing it rise from the bottom with increased volume, thinking it should at least test the previous high around 0.0175. It did reach it. I placed an order at 0.0183 and sold 70%, leaving 30% to bet on a breakout above 0.0187. You saw what happened next: it is now at 0.0173, and most of the profit on that 30% has been given back.
Let me explain my discipline: I only enter after a confirmed
#pi I just entered the Pi program and found that it had updated again. The update is exactly in line with my previous understanding of Pi’s cooperation with the stablecoin USDT: essentially, it is merely a return to the crypto community, with nothing new. As a result, everyone’s values have been desecrated. Who will pay for the official’s 20 billion? Stablecoin holders? 😕😕😕🌹🌹🌹♥️♥️♥️
PI+0.61%
Making money in U is hard; making money in U every day is even harder. Last year, I used 6,000 U in principal to trade BTC and ETH, growing it to 320k U. This year, with 2,600 U in principal, I have traded gold and grown it to 240k U so far. I’m Feiyang, a Sesame streamer who rose to prominence through a comeback PK. I specialize in BTC and ETH and don’t touch anything else; I don’t do short-term trading. I’m Feiyang, so brothers, call me Brother Fei. In this vast sea of people, meeting is fate. Let’s join hands to create a glorious future—first, let’s earn that first small goal!
BTC+0.87%
GLDX+1.11%
PAXG+0.97%
Financial News, Crypto Updates, Real Trading Strategies
live-cover
LIVE880
$ZEC is showing signs of a potential recovery after a sharp correction.
Price is currently holding around the $1,180–$1,220 support zone, which has become an important area for buyers. If this zone continues to hold, the next key level to watch is $1,300.
A clean reclaim of $1,300 with strong volume could open the way toward $1,400–$1,500.
However, losing $1,180 would weaken the structure and could expose the $1,100 area.
For now, I’m watching the reaction around support rather than chasing the move.
Key levels:
• Support: $1,180–$1,220
• Resistance: $1,300
• Next resistance: $1,400–$1,500
•
post-image
ZEC+2.00%
  • 1
The moving averages have formed a golden cross, but the MACD histogram is still negative. Which signal should you trust?
Answer: Look at the relative position of the moving averages and how well the price respects them, rather than relying on a single indicator. Taking $S as an example, MA5=0.044318 has crossed above MA20=0.044151, and the price of 0.04422 is holding above both moving averages, indicating a healthy short-term trend structure; however, the MACD histogram is -0.0001678, a typical “trend leads, momentum lags” phase, often representing consolidation after a rally rather than a to
post-image
INTC-2.28%
ZK+22.13%
Waiting for the hurricane 😅 ..
⚡️ #VOLT
post-image
$MAGIC It violently surged from 0.0655 to 0.1284 in 24 hours and is now at 0.1230, with an 86% gain burying all the shorts. The 321M trading volume shows this is not a retail game. I monitored the on-chain data all night, and large transfers into exchanges clearly increased around 0.12, suggesting early holders are rotating their positions.
Technically, 0.1284 is the high of this move and also the lower boundary of the previous dense accumulation zone. The price is now consolidating around 0.123. If volume picks up and absorbs the sell orders at 0.125 within half an hour, I’m looking directly
MAGIC+86.76%
A 6x volume ratio drove a 24.9% surge—$GMT longs are swimming naked; I’m bearish
$GMT 24-hour volume surged 24.9%, with the current price at 0.00987, an intraday high of 0.0111, and a volume ratio of 6.009x. The rise is fierce, but I’ll show my cards first: bearish, short into strength.

24h trading volume is 6.009x the 30-day average; the money has genuinely arrived. But the daily RSI is only 44.0, and the strength remains weak despite this surge. Volume and price have clearly diverged—the impulse is not a trend.

The derivatives side is even less supportive, with a funding rate of -9.086e-
GMT+27.90%
$ALEO This huge waterfall.
post-image
ALEO+6.58%
The president is personally going to the Supreme Court to watch the ruling on tariff authority, which is more outrageous than the ruling itself. He is treating the separation of powers like a live broadcast, and what the market fears most is not winning or losing, but this kind of uncertainty dragging on like a serialized drama.$SPY Is this assessment correct? Come back next week to confirm.
post-image
Don’t rush to assign a direction to $ADA . The 1-hour and 4-hour charts are still at odds, and this is when it’s easiest to mistake a rebound for a reversal. I’d rather lay out the bearish case first.
The bears see risk after a break below 0.2319, while the bulls need to prove that buyers remain after a breakout above 0.2458. Current volume is 1.85x.
The current price is 0.2452, about 5.42% from the 1-hour support at 0.2319 and about 0.24% from the resistance at 0.2458. Position determines which side is more urgent; the next level to watch is 0.2238.
Waiting for the boundaries to provide the a
post-image
ADA+5.38%
#HyperliquidPerpOIMarketShareHitsRecord11.9%
HYPERLIQUID'S FUNDAMENTALS ARE GETTING STRONGER — BUT HYPE JUST FELL TO $83.94. WHAT'S GOING ON?
This is exactly the kind of situation that can confuse crypto investors.
Hyperliquid has just reached a record 11.9% share of perpetual open interest, with roughly $200 billion in trading volume over the past 30 days.
Yet the HYPE token is now trading around $83.94.
So how can the platform be gaining market share while its token is losing value?
The answer is simple:
Fundamental adoption and short-term token price are two different things.
Hyperliquid's
Original content no longer visible
HYPE-0.02%
BTC+0.87%
What #Crypto are we watching
post-image
Layout: Bitcoin, Ethereum, Dogecoin
live-cover
LIVE1,356
  • 1
$STRK ’s strength is still intact, and crowding risk is rising
$STRK 24 hours +33.89%, current price 0.07463. The 1-hour and 4-hour RSI readings are 52 and 79, respectively. The strength is real, and so is the crowding. The question is not whether it can continue moving higher, but who will be willing to catch it on the first pullback.
Let’s return to the 24-hour range: the low is 0.05534 and the high is 0.07716. Where the current price of 0.07463 sits within this range will directly affect the meaning of the same signal. Near the high, the strength must prove that this is not a spike follo
post-image
STRK+30.02%
Load More

Join 40 M users in our growing community

⚡️ Join 40 M users in the crypto craze discussion

💬 Engage with your favorite top creators

👍 See what interests you

Trending Topics

GateAtTOKEN2049

38.07k Views21.19k Discussing

Gate brought a series of major events to TOKEN2049 Singapore! From the official launch of Gate Money to the F1 Red Bull driver meet-and-greet and the Gate Gala, we witnessed a new chapter of "One Gate, Borderless Finance." Which moment from TOKEN2049 stood out most to you?

GateWCTCS9GlobalTradingCompetition

32.87k Views3.51k Discussing

BTC Pulls Back to 81000

26.58k Views35.98k Discussing

View More