Square
Following
Hot
News
Profile
Share your thoughts
placeholder
Article
GM.
It’s my birthday today.
Well… another year older, haha.
Trenches
ZIG
Z
bade
b
ZIG
0x8c...1145
Market Cap
$.
Change
.
24h Vol
$.
Holders
.
BIRB
B
bade
b
BIRB
G7vQ...KNwG
Market Cap
$.
Change
.
24h Vol
$.
Holders
.
AGT
A
bade
b
AGT
0x5d...e274
Market Cap
$.
Change
.
24h Vol
$.
Holders
.
CNPY
C
bade
b
CNPY
0xc6...ddd2
Market Cap
$.
Change
.
24h Vol
$.
Holders
.
Moustache
M
bade
b
Moustache
J9WL...pump
Market Cap
$.
Change
.
24h Vol
$.
Holders
.
Trying to get myself more chickens.
Went to use relay, slippage is too high.
Went to official abstract bridge, routes to relay.
Went to the official-but-hidden native abstract bridge, frontend misquotes gas so bridging is broken.
Hand built a tx with proper gas and bridged ~1 eth.
Everyone who wanted a chicken went through hell and back to get one, thank you guys for that.
Anyway, I'm now the highest offer among any given trait, so if you were going to sell your chicken please do it now.
And man I can't wait until these things are on Ethereum.
post-image
ETH-0.94%
Market update BTC
live-cover
LIVE1,641
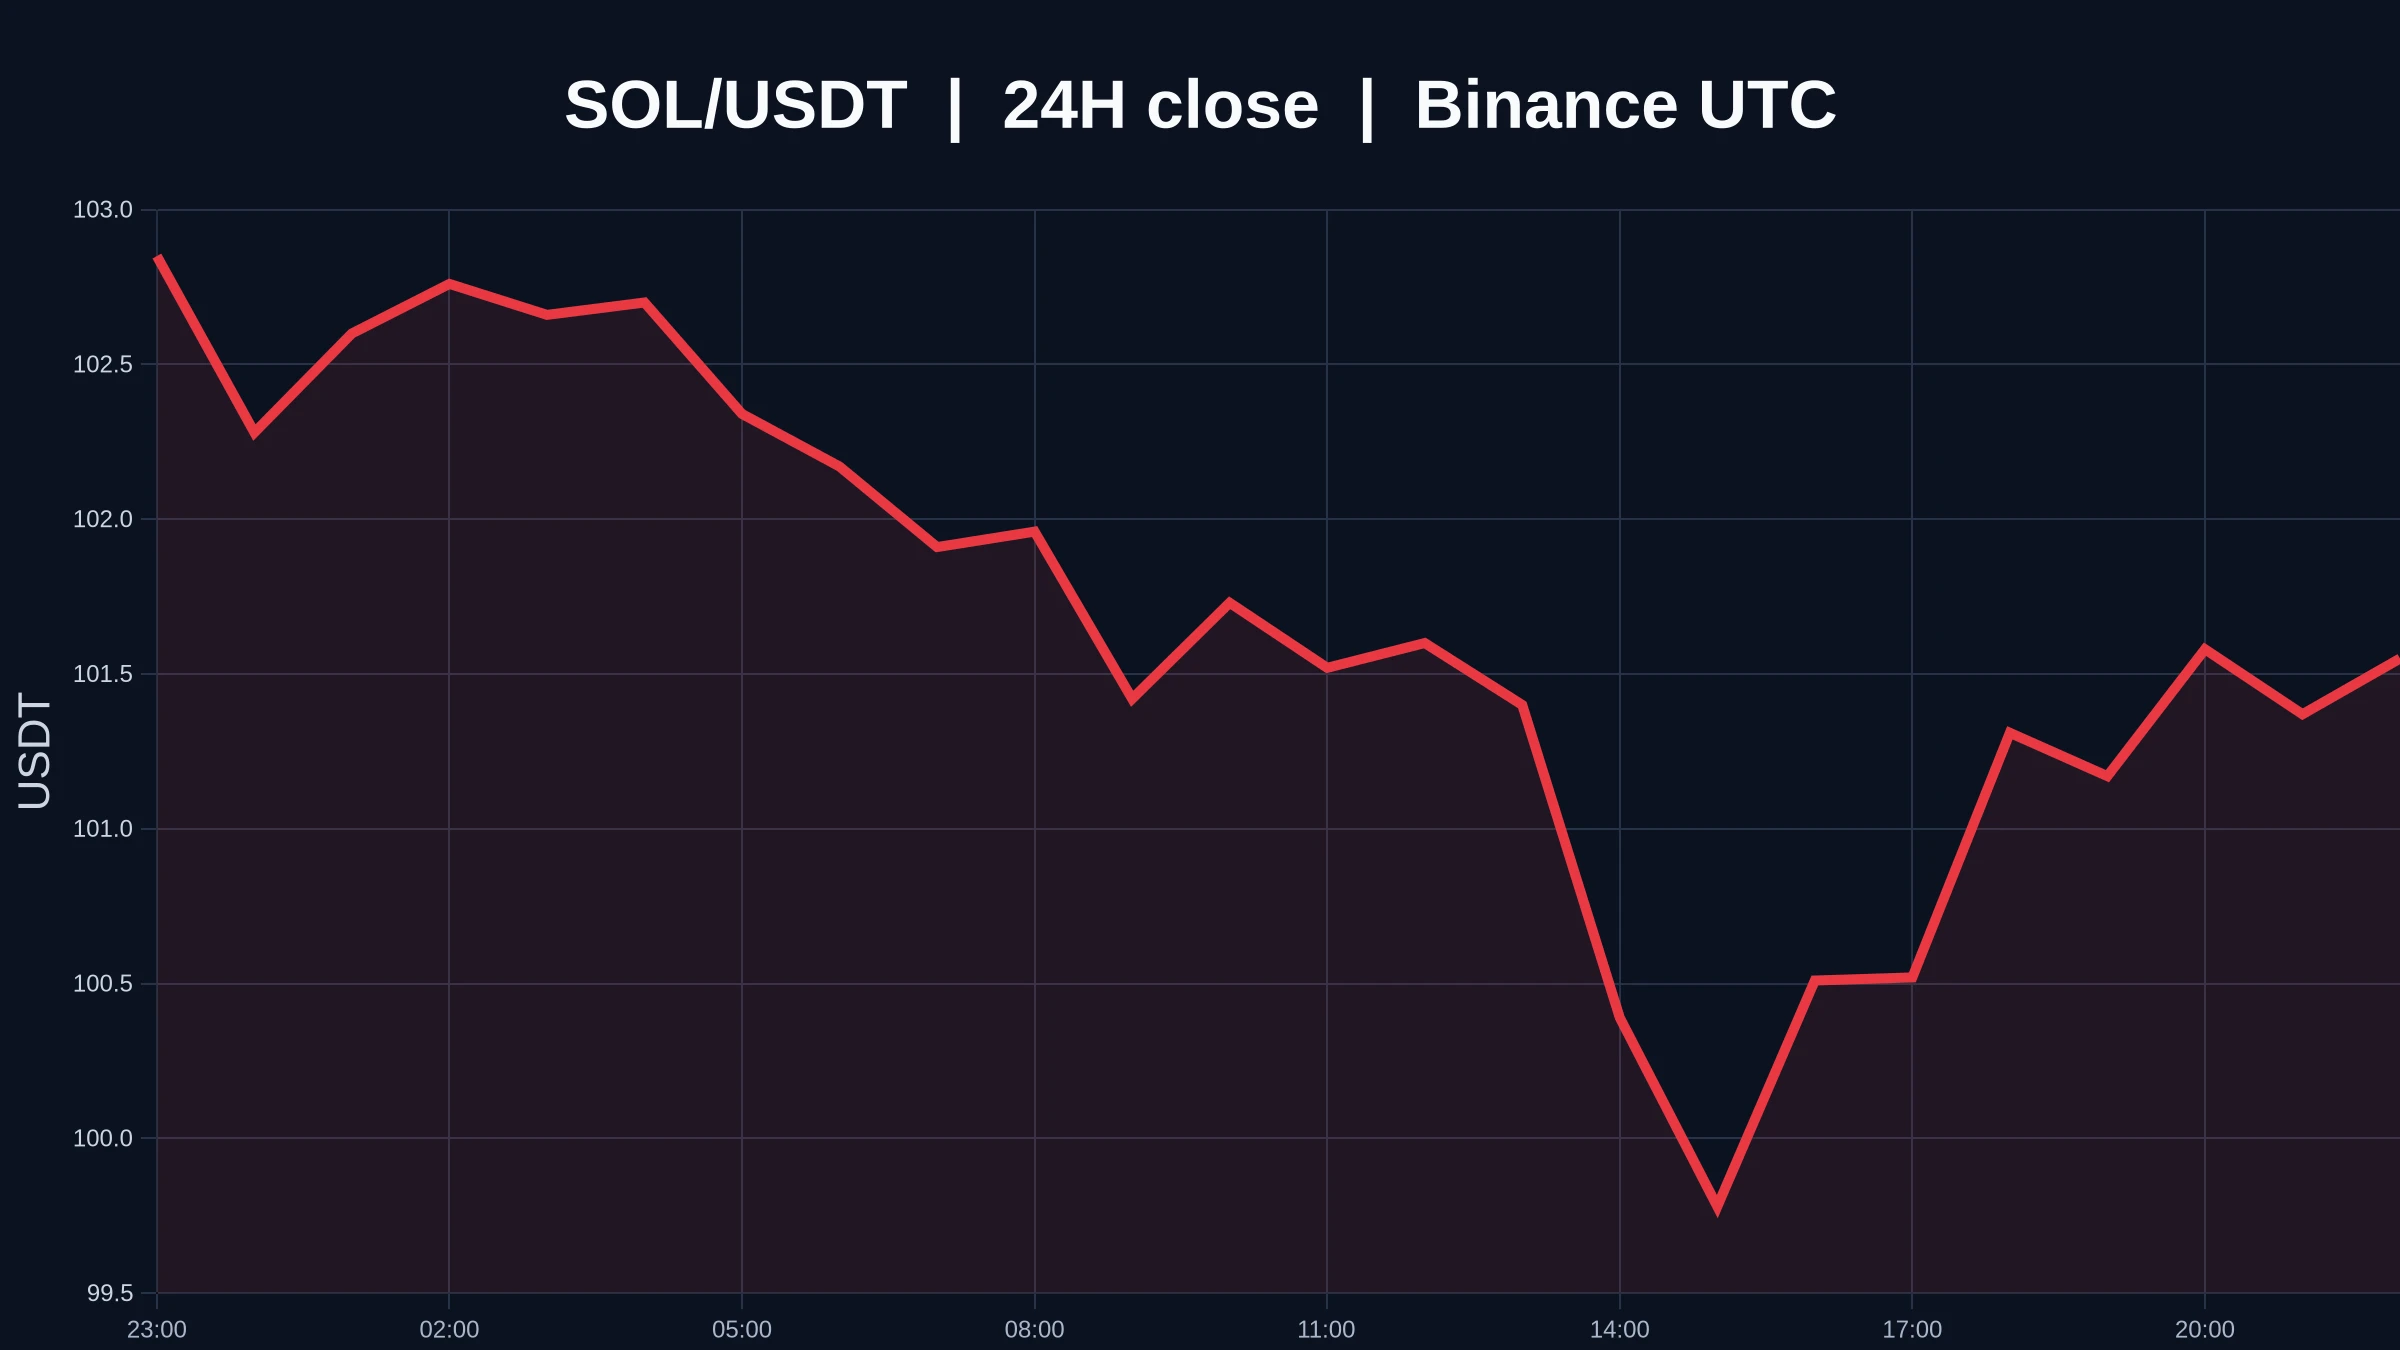
$SOL ’s 24-hour result is -2.27%, but that result is neither a cause nor a forecast. What we can confirm now is 101.4, 0.00x volume, and weakness on both the 1-hour and 4-hour timeframes.
The easiest mistake here is to look only at candle colors and ignore participation, mistaking a test move for a genuine breakout. You can tentatively trust the direction, but not its continuation; a move without follow-through can be reversed at any time.
Reading the chart can be simple: below 98.62 is one outcome, above 103.13 is another, with the broader boundaries at 98.62 and 109.2.
For the follow-up revie
post-image
SOL-0.52%
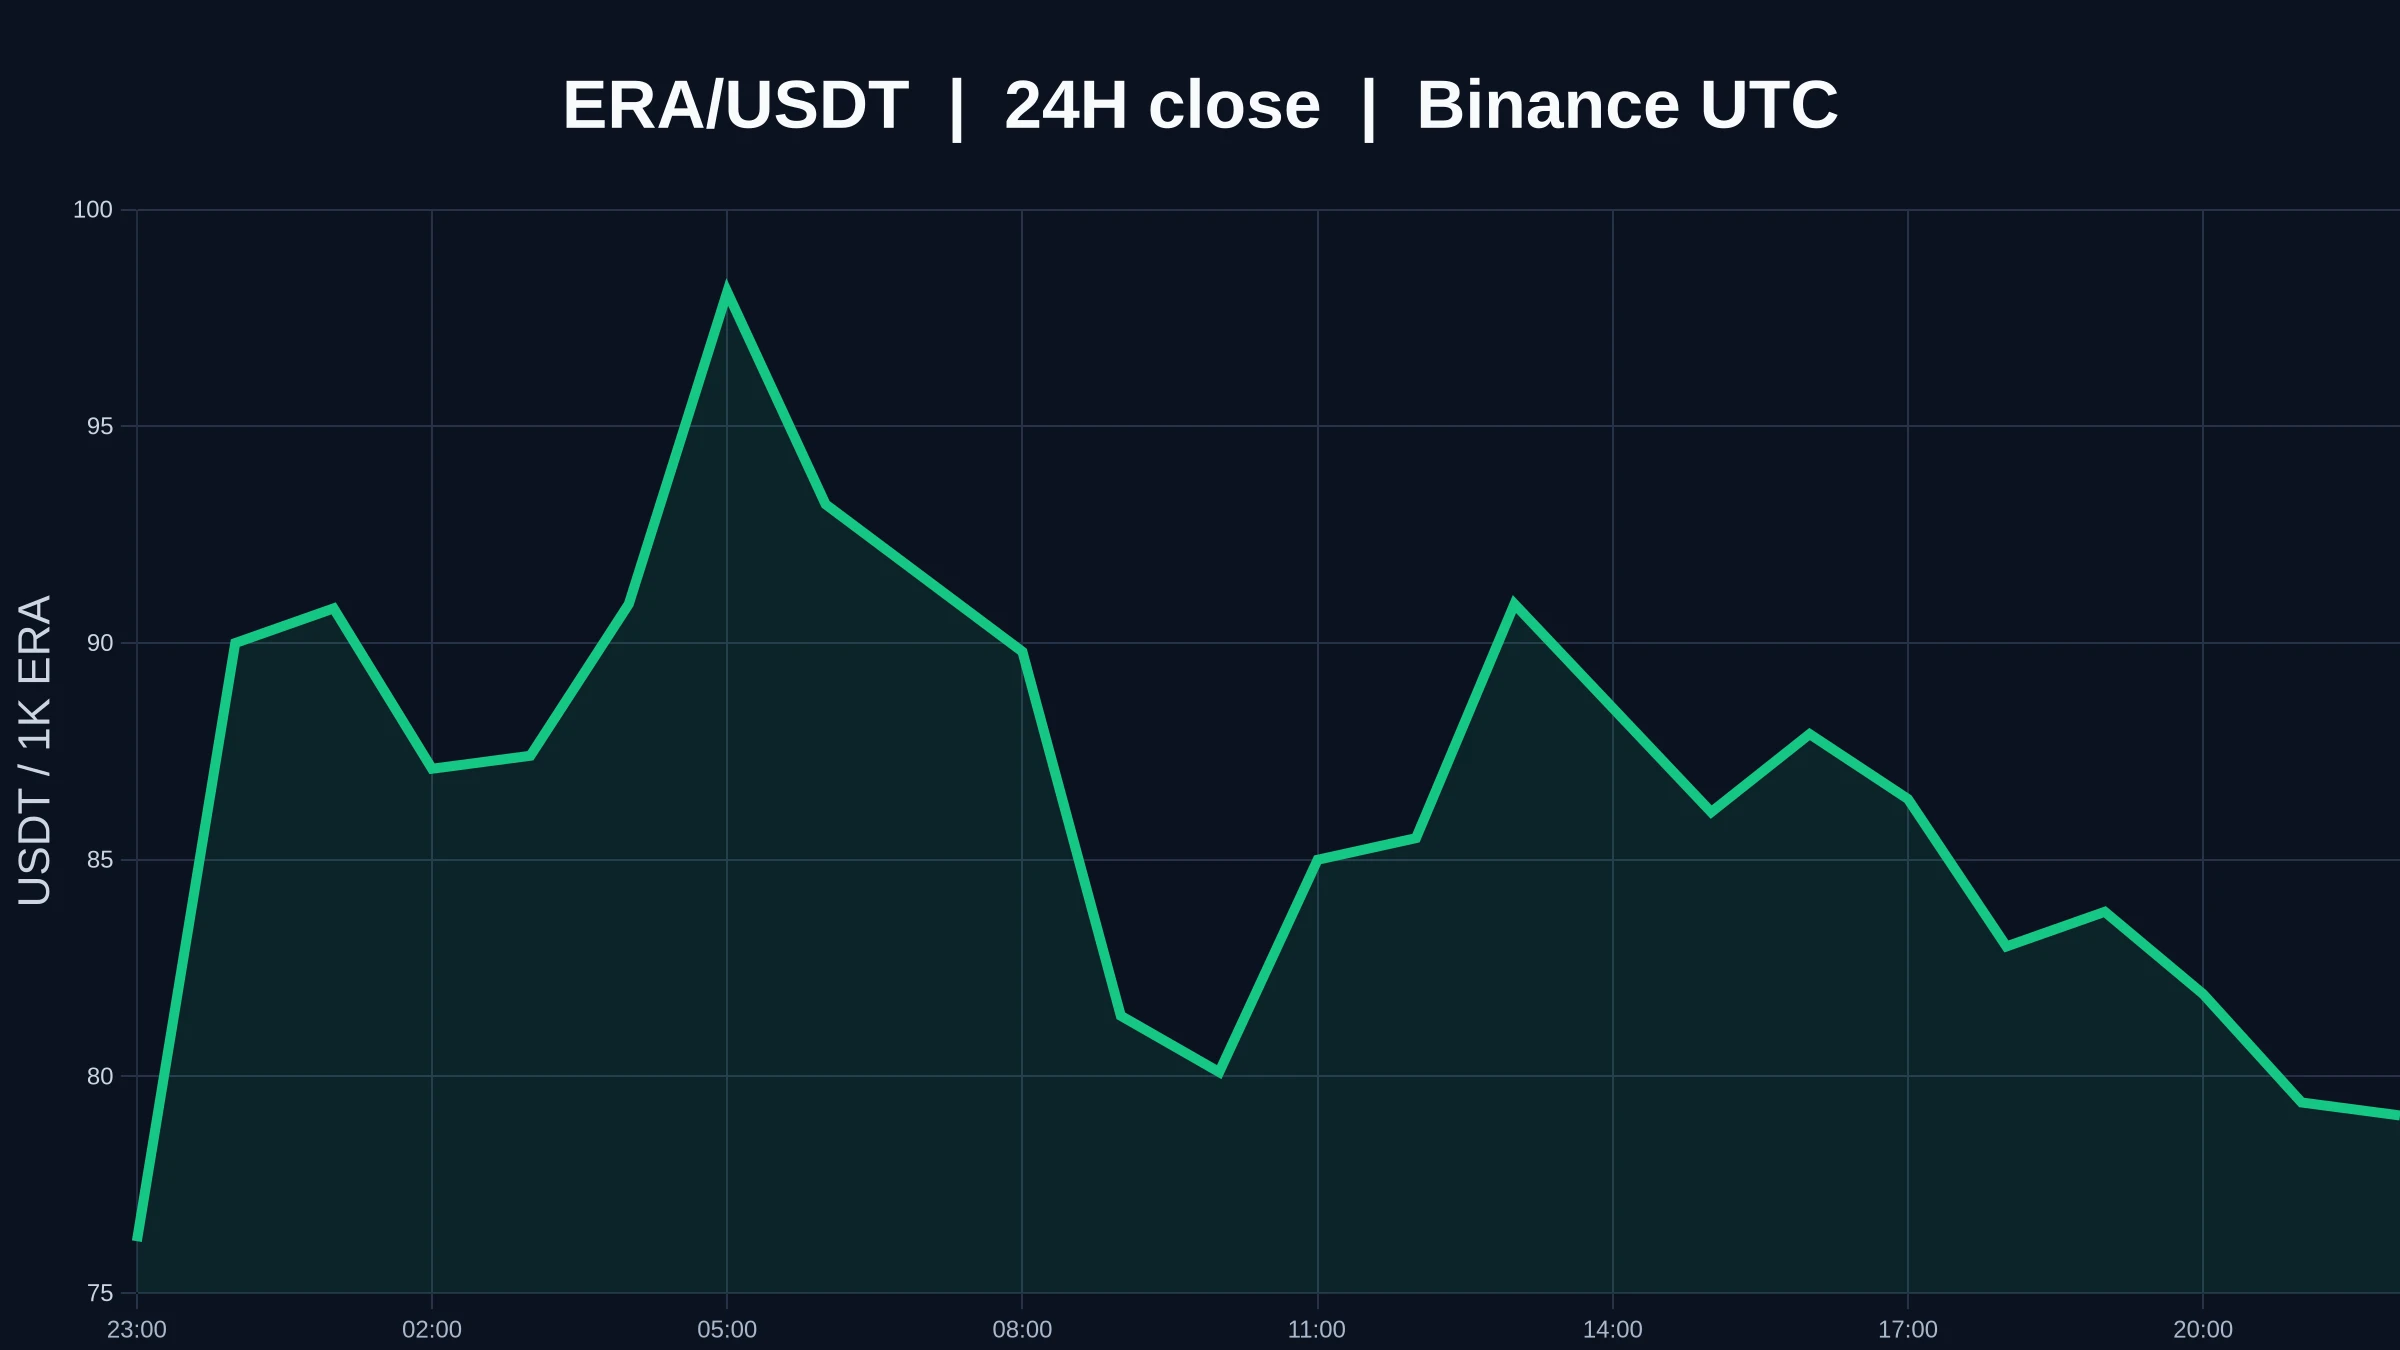
$ERA is currently priced at 0.0792, up 1.80% over 24 hours, with volume at 0.15x the average of the last 20 bars. Taken together, these figures make the key point to clarify: $ERA has moved on the 1-hour timeframe, but the 4-hour timeframe has yet to confirm it.
I treat the shorter timeframe as a signal, not a conclusion; if the larger timeframe doesn't follow, the direction can still reverse. The 1-hour timeframe reflects short-term capital flows, while the 4-hour timeframe reflects the broader structure. When the two timeframes point in opposite directions, it only means the market is choosi
post-image
ERA+2.43%
Finally I can export a list of mutuals by city. This would have cost like $500 with the API
post-image
(new streamer)market update
live-cover
LIVE1,339
need moar lil guys
chat help me, remilio vs retardio?
#美股财报季
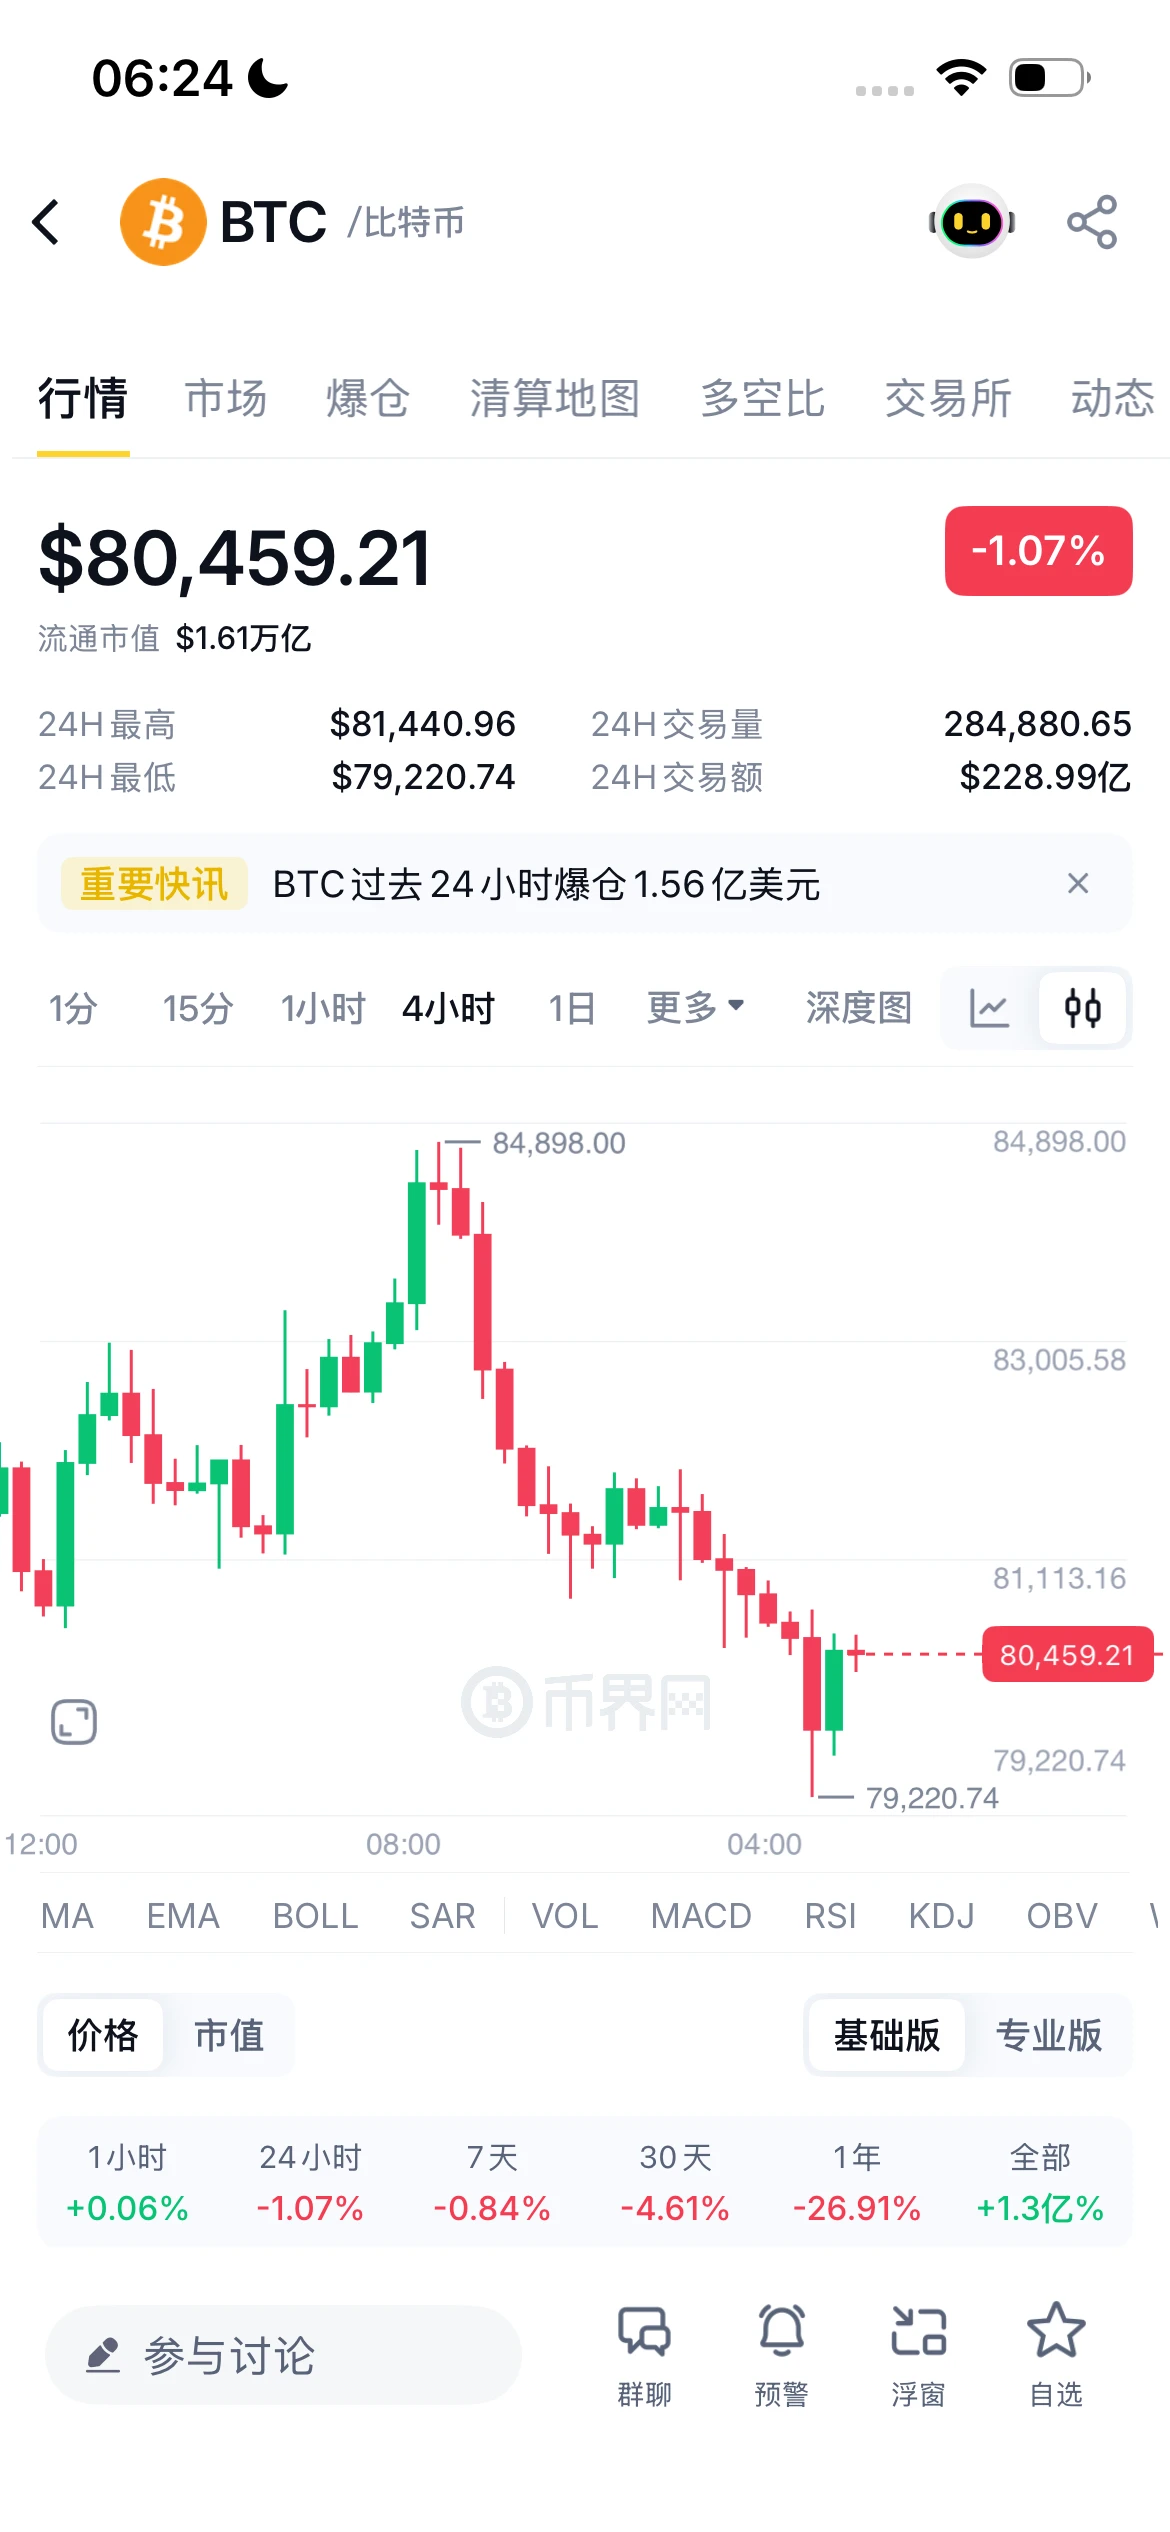
BTC short position at 83626: current price 80459.21, unrealized profit 3166.79
Market: 4H has declined in consecutive bearish candles from the previous high of 84898, probing down to 79220.74 before a weak rebound; overall, it remains weak after breaking down. Clear resistance around 82370-83626, with no signs of a bottom or bullish engulfing reversal yet. 24h liquidations totaled $156 million; volume and price action are bearish, and bullish support is weak.
Key levels:
• Support: 79220.74 (24H low) / 79732.3
• Resistance: 82370 (near-term defense) / 83626 (reduce-position alert) / 84
post-image
BTC-0.16%
Gm everyone ☀️
Never drinking again
post-image
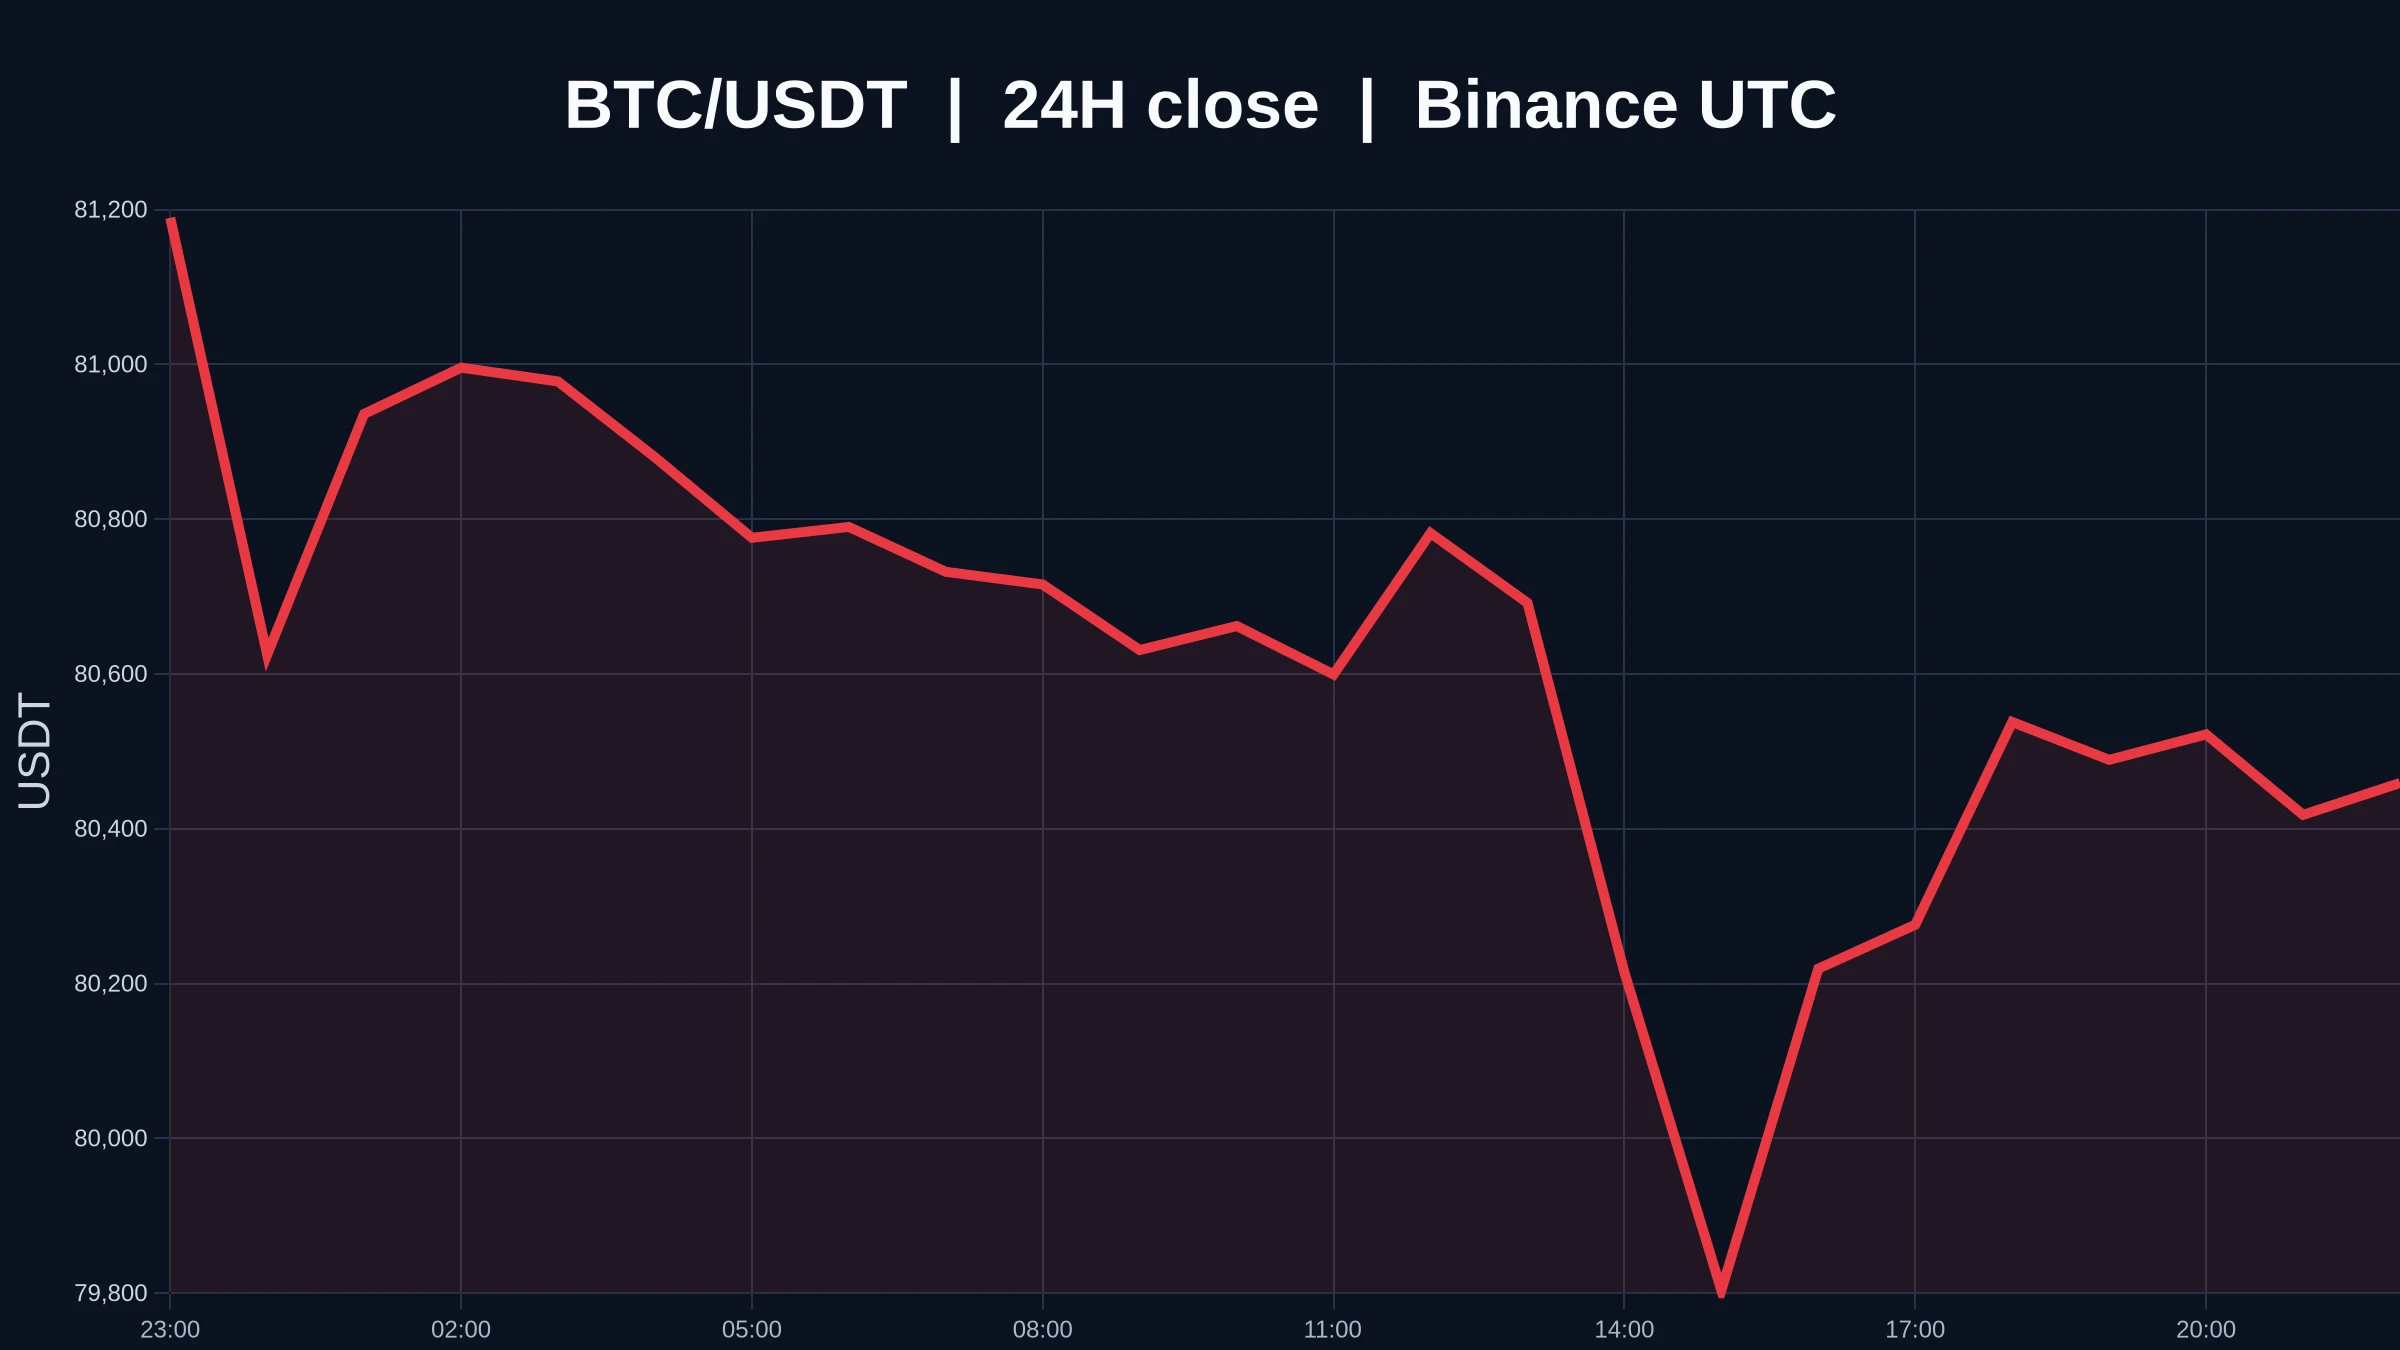
$BTC direction and volume are in conflict; wait for volume and boundary confirmation
$BTC Now at 80,459.21 USDT, down 1.14% over 24 hours, trading between 79,220.74 and 81,386.01. The 1-hour bias is weak, and the 4-hour bias is also weak, while trading participation is only 0.10x. This snapshot gives no long-or-short answer, only a set of questions that need answering. Price, time, and volume are presented without any preset hierarchy. This process takes patience, but it avoids many misjudgments.
The current price has moved away from the vicinity of the 24-hour high and low, but these numbers
post-image
BTC-0.08%
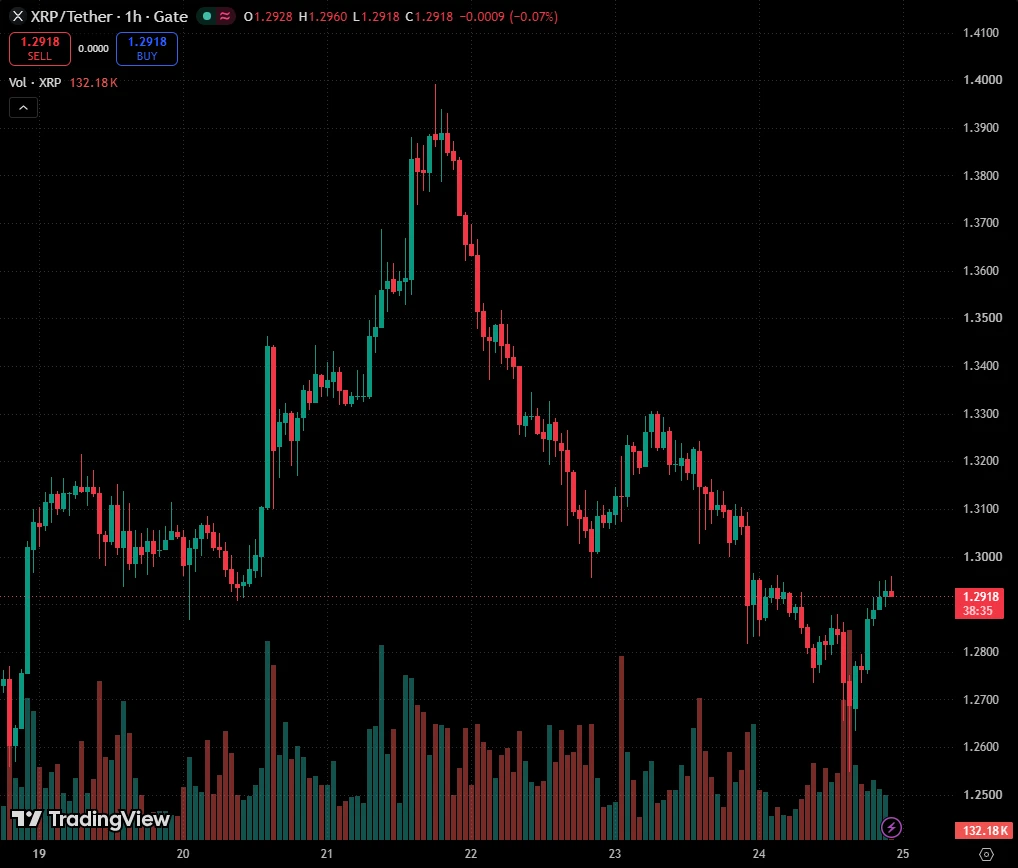
$XRP XRP LONG above 1.284: last week's low swept, 1.322 next
Bias: LONG XRP above 1.284. Expected: 1.304 (this week's POC), then 1.322 (this week's VWAP). Invalidation: a 1h close below 1.274.
3-month profile from 1h candles. Levels plotted with VWAP & Volume Profile Order Flow Map [AK FlowBook].
Why long:
1) A clean sweep of last week's low.
Last week (Oct 12-18) bottomed at 1.2562. Saturday flushed to 1.2546 at 15:30 UTC during the day's heaviest selling: delta about -833K XRP in the 13:00 hour, -730K at 14:00 and -1.33M at 15:00. Not one 1-minute candle closed below 1.2562. The stops under
post-image
XRP+0.36%
The data looks off. $APR is currently at 0.0347, up 48.46% in 24 hours, with a low of 0.0226 and a high of 0.0351—closing almost right at the ceiling, on 27.0M in trading volume. This kind of volume paired with this kind of gain isn't something retail traders can pull off.
I've been watching the markets on Gate for a long time, and this kind of move usually means one of three things:
First, real money is getting in early. The 40%-plus swing from 0.0226 to 0.0351 had almost no meaningful pullbacks along the way, which suggests buy orders kept coming in rather than this being a one-off pump. 27
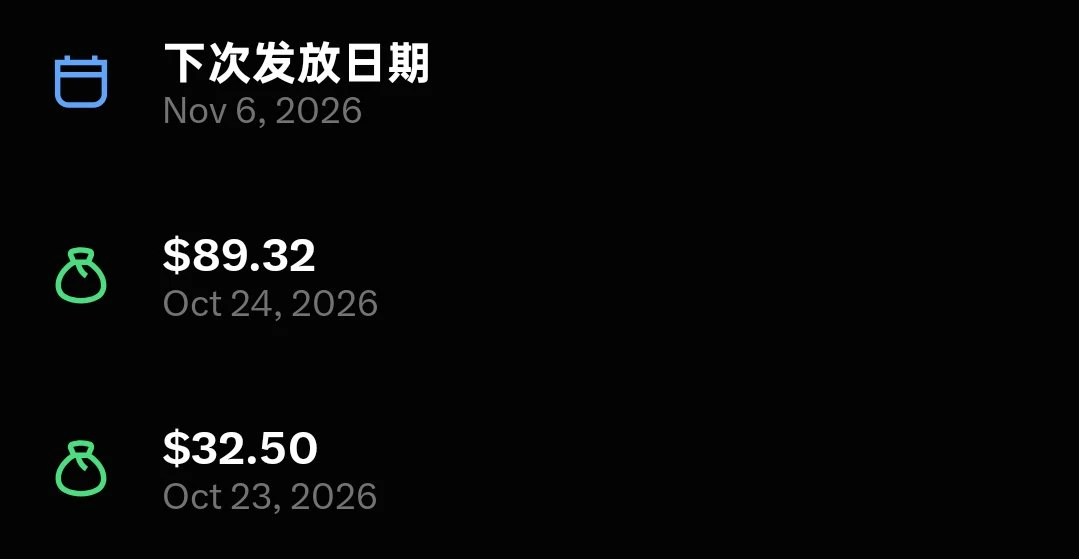
What’s going on? Why are they paying salaries in two installments?
post-image
#USEarningsSeason
U.S. Earnings Season: AI Investment, Profit Margins, and Cash Flow Will Decide the Next Market Move
The U.S. earnings season is entering a phase where investors must look beyond impressive headlines and focus on business fundamentals. Revenue growth, earnings per share, and company valuations still matter, but the growing cost of artificial intelligence is changing how markets evaluate corporate performance.
My view is that the next major market move will depend less on how much companies spend on AI and more on how effectively they convert that spending into sustainable pro
TSLA-0.62%
AAPL-0.17%
NVDA-0.60%
MSFT+0.56%
AMZN-0.97%
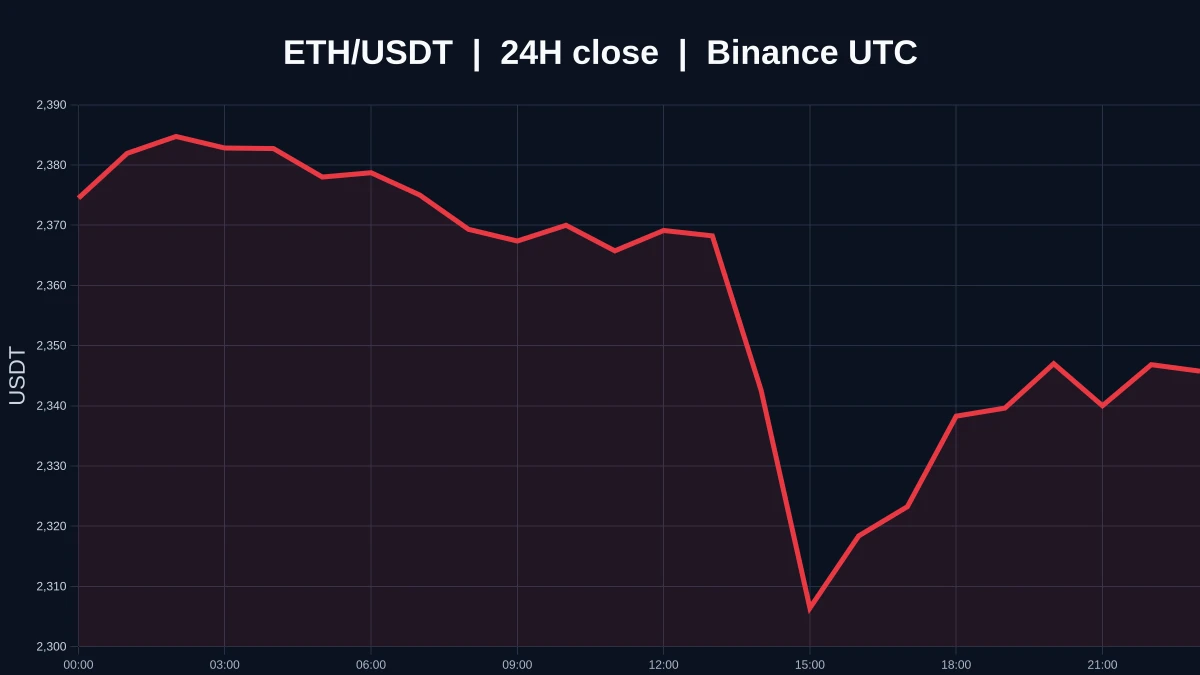
$ETH Currently trading at 2345.76, down 0.64% over 24H (range: 2282.46–2390.24). The 1H EMA20 at 2352.60 is acting as resistance, with RSI at 41.6, indicating weakness; the 4H EMA20 at 2385.04 is overhead, with RSI at 36.1, indicating greater weakness. Volume is only 0.15x the average. Going forward, watch whether price can hold above resistance at 2390.24, and whether it can reclaim support at 2282.46 if that level breaks. Market volatility is high; for observation only.
post-image
ETH-0.94%
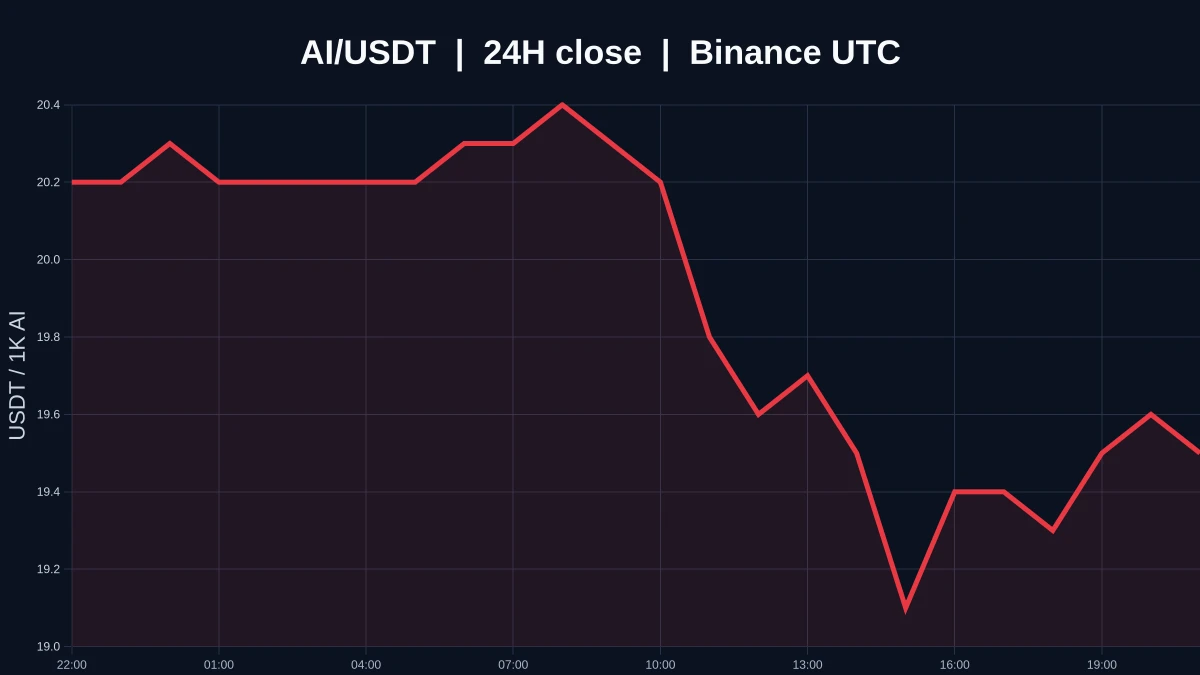
$AI is currently trading at 0.0195, down 3.465% over 24H (range: 0.0191–0.0212). The 1H and 4H charts are both weak, with EMA20 acting as resistance and RSI near lows. Watch whether price can hold above resistance at 0.0212, and whether it can reclaim 0.0191 after losing that level. Volume is only 0.00x the average, so any move past these levels needs confirmation from participation. If price holds above resistance, keep an eye on it; if it breaks support, beware of further weakness. The market is highly volatile; for observation only.
post-image
Who else can relate
post-image
Ethereum Developers Cancel Oct. 26 Glamsterdam Upgrade on Hoodi
Node operators are being instructed to deploy software that excludes the scheduled fork, while the date and conditions for mainnet activation remain unresolved. The decision to decouple the client update from network launch leaves the timeline and activation criteria open, with no consensus yet reached among stakeholders on when or how the mainnet will go live.
⚠️ Personal market analysis only. NFA — manage risk and DYOR.
Educational content, not investment advice or a recommendation to buy, sell, deposit, or withdraw any asset. N
post-image
ETH-0.94%
Load More

Join 40 M users in our growing community

⚡️ Join 40 M users in the crypto craze discussion

💬 Engage with your favorite top creators

👍 See what interests you

Trending Topics

USEarningsSeason

63.44k Views3.29k Discussing

The U.S. Q3 earnings season is in full swing, with major tech companies including Tesla and Meta reporting results. Market focus is shifting beyond revenue and profit toward AI spending, capital expenditure, margins and forward guidance. Which company’s earnings are you watching most closely?

GateWCTCS9GlobalTradingCompetition

605.38k Views7.89k Discussing

USConsumerSentimentNearRecordLow

5.63k Views214 Discussing

View More