Share your thoughts
placeholder
Article
Bull-Bear Divide Deepens Around $82K! B.TOP Founder Sells All His BTC
live-cover
LIVE39
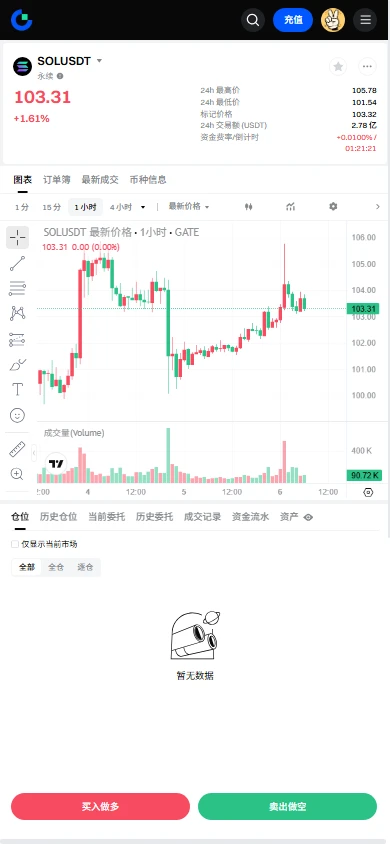
$SOL Signal】At the end of 1H convergence, go long on a pullback to 103.3
$SOL At the end of the 1H triangle convergence, the price is 103.6, with order-book sell pressure exceeding buy pressure by 4%. The 4H MACD histogram at 0.125 is still expanding, while short-term upward momentum shows no increase. EMA20 and EMA50 are intertwined around 102.5, with the funding rate at 0.002%; shorts have no advantage.
🎯Direction: Long
⚡Entry/Limit Order: 103.3091 - 103.6200
🛑Stop-loss: 102.5838
🚀Target 1: 105.1743
🚀Target 2: 105.9515
🛡️Trade Management:
- Execution strategy: After reaching Target 1,
post-image
SOL+1.72%
15 years ago today, Bitcoin was $8
Me 15 years ago :
post-image
BTC+0.17%
  • 1
Leverage magic unfolds, with $AKE long-position returns exceeding 11x.
The logic stems from an oversold rebound in early September; accumulation at 0.013 was followed by trend continuation as risk appetite recovered.
Technically, the price broke above its previous high, while the RSI is overbought. The 0.0189 support level is crucial in the short term, so chasing the rally is advised against. $ETH
AKE+42.64%
ETH+1.23%
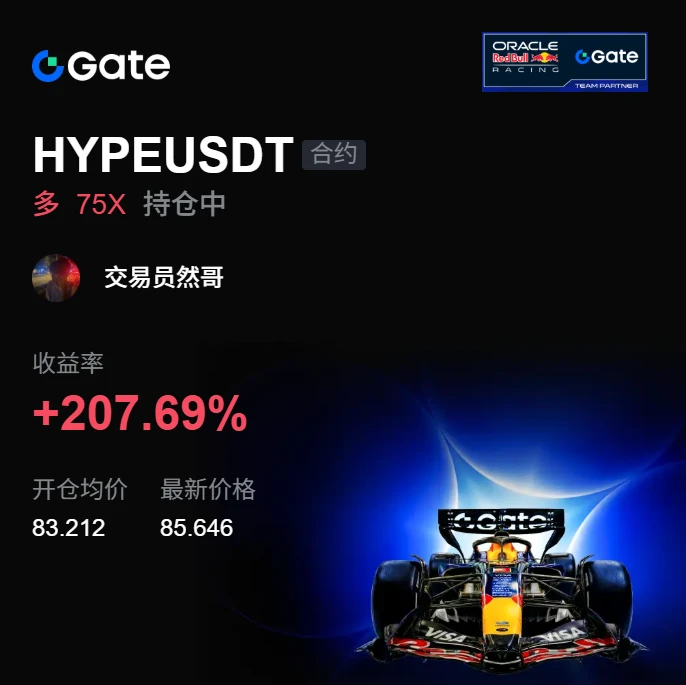
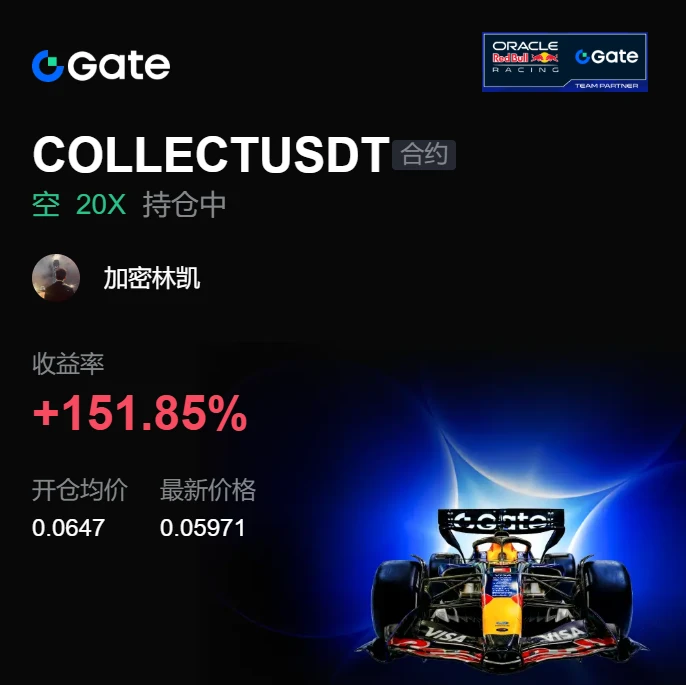
This trend doesn’t even require me to think—the account is dancing on its own. When I checked the charts after lunch, the price-volume action was already looking off. The price was rising without volume, with no one stepping in higher; every push upward was just short of breaking through. I’m most wary of this kind of inflated-looking market, so I decisively followed the rhythm.

From 83.212 to 85.643, +207.44% secured—those already on board should be laughing in their sleep. I didn’t panic at all while everyone else was running, because the logic had been right there in plain sight: volume f
post-image
SNDK+1.73%
XRP+1.27%
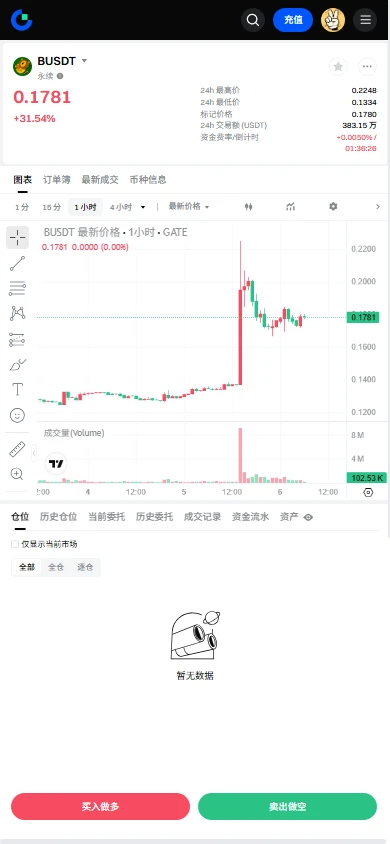
【$B Signal】Long | 1H pullback to Bollinger midline + bid support
$B 1H pullback to the Bollinger midline, bid-side depth imbalance at 12.02%, current price 0.1733 holding just above the midline.
🎯Direction: Long
⚡Entry/Limit order: 0.172780 - 0.173300
🛑Stop-loss: 0.171567
🚀Target 1: 0.175900
🚀Target 2: 0.177199
🛡️Trading management:
- Execution strategy: After reaching Target 1, reduce the position by 50% and move the stop-loss up to breakeven. If the price falls back to the entry level, exit automatically to protect the principal.
Depth logic: The 4H MACD is above the zero line; the hist
post-image
BTC+0.17%
ETH+1.23%
SOL+1.68%
Gate reaches 60 million users—it's time to update your “crypto youth archive”!
What does 60 million users mean?
I think that rather than representing the platform's scale, it means 60 million crypto journeys have been connected. According to Gate's official data, the platform currently supports 5,000+ digital assets and continues to expand its diverse asset services, including stocks, ETFs, and RWAs.
But what may truly be worth remembering is the moment we first encountered the crypto market.
Were you a little nervous when you made your first deposit?
Did you stare at the candlestick chart for
RWA+3.54%
BTC+0.17%
  • 33
Everyone’s chasing the 15m RSI bounce—but that’s exactly where ESPORTS traps breakout traders.

$ESPORTS /USDT - SHORT

Trade Plan:
Entry: 0.01492 – 0.01500
SL: 0.01533
TP1: 0.01468
TP2: 0.01450
TP3: 0.01423

Why this setup?
- 1D trend is bearish; 4h bias is SHORT with 95% confidence—not a guess, a weighted edge.
- Price is stalling at 0.01496, right on the 1h reference, while RSI 15m at 68 screams overbought *into* resistance.
- ATR (0.000153) shows tight coils—breakdowns here snap fast, not crawl.
- Why now? The “waiting” status means the setup is armed; invalidation at 0.01530 is a
ESPORTS+1.29%
Everyone’s staring at NEAR’s breakout, but the 15m RSI says you’re already late to the quiet part.

$NEAR /USDT - LONG

Trade Plan:
Entry: 2.1736 – 2.1968
SL: 2.0737
TP1: 2.2688
TP2: 2.3246
TP3: 2.4082

Why this setup?
- 4h structure is screaming LONG at 95% confidence, anchored at 2.1852 while the daily trend stays bullish.
- The pullback zone (2.1736–2.1968) is where wallets get filled—not after TP1 prints.
- RSI 15m at 45.64 means room to run before overbought, and ATR 0.0465 gives you a tight 4.5% stop buffer to 2.0737.
- Why now? Because waiting for TP3 (2.4082) is a luxury only
NEAR+1.93%
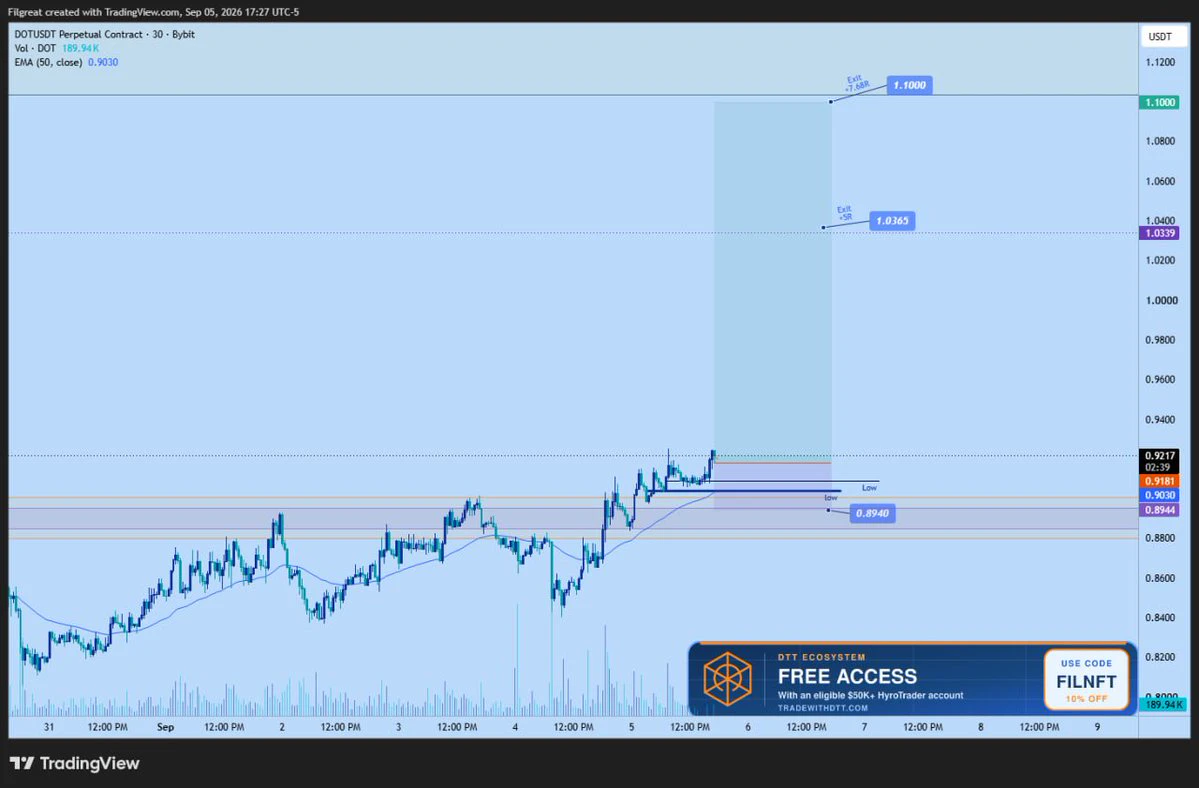
🟢HIGH RR $DOT LONG
🛑 SL: $0.8940
🎯 TP1: $1.0365—70%
🎯 TP2: $1.1—30%
⚖️ R:R: 7.68R
🛡 Hyro risk: 0.6%
✅ Confirmations: 9/10
You witnessing now the moment before an epic trade and the power of Direction Target and Timing methodology for reading price action. I sized up.
Not financial advice
— DTT
post-image
DOT+5.49%
Liquidation at its peak 🥺😂
post-image
Nonfarm payrolls rewrote the script overnight! The Fed’s rate-cut calculations thrown into disarray by 162k jobs?
The market had originally been looking forward to: cooling employment → slowing economy → Fed rate cuts → liquidity returning → risk assets continuing their celebration.
Instead, August nonfarm payrolls delivered a direct “plot twist.”
The US added 162k nonfarm jobs, far exceeding market expectations of just over 50k, while the unemployment rate held at 4.1%. More importantly, June and July employment figures were revised up by a combined 55k.
What does this mean?
At the very least
NVDA+0.87%
  • 46
The opportunity is still there, be patient.

$ADA $SOL
post-image
ADA+3.98%
SOL+1.72%
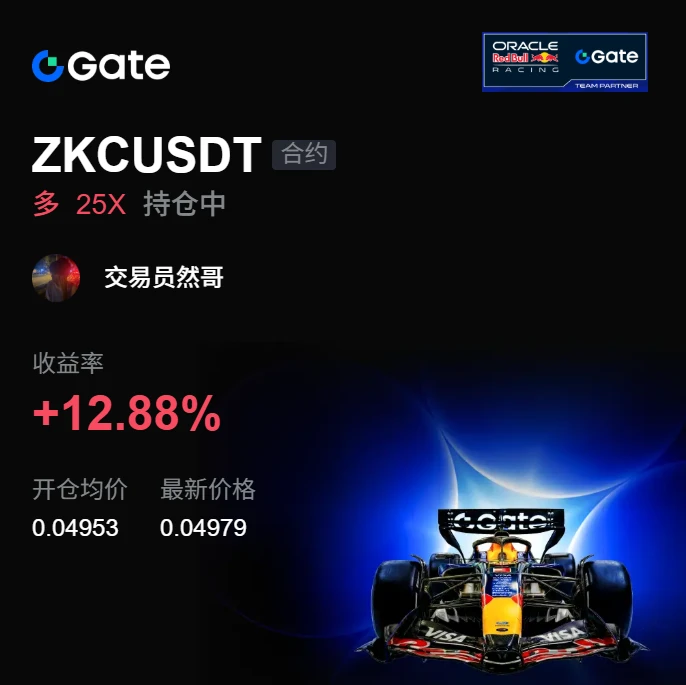
Is this even a rebound? It’s CPR for my account, isn’t it? $ZKC It just touched 0.0497, with +12.88% secured. I stared at the screen for several seconds to make sure I had the right account.

When I opened the charts this morning, buying pressure had clearly strengthened, and each pullback was getting smaller and smaller. This was obviously not an ordinary dead-cat bounce. Around 0.04953, I put it plainly: the risk-reward at this level was good enough; if wrong, take the loss, and if right, it’s a big payday.

Looking back now, the timing was spot-on. As for the position management: I took 7
post-image
ZKC+1.94%
XRP+1.27%
BTC+0.17%
#美国8月非农超预期 $TSLA 62,000 nonfarm payrolls—is it too good to be true? Not so fast, this employment data may be “bloated”
The US added 162,000 nonfarm jobs in August, while the market had originally expected just over 50,000—nearly a threefold difference. The unemployment rate remained unchanged at 4.1%, while the labor force participation rate rose from 61.4% to 61.6%. Judging by the numbers alone, the US labor market looks like it suddenly took a “miracle pill.”
But the most interesting part of the data is precisely hidden in its industry composition.
Restaurants and bars added 59,000 jobs in A
TSLA-5.96%
  • 53
Everyone’s watching the 1D trend—but 95% confidence shorts on $LAB /USDT are the quiet exit liquidity.

$LAB /USDT - SHORT

Trade Plan:
Entry: 0.07491 – 0.07539
SL: 0.07742
TP1: 0.07345
TP2: 0.07232
TP3: 0.07062

Why this setup?
Why now? The 4h structure is breaking, and the 1D trend is already bearish—this isn’t a guess.
- RSI 15m at 58.79 shows a weak bounce, not a reversal.
- Entry zone 0.07515–0.07539 aligns with the last defense before TP1 at 0.07345.
- ATR 1h (0.000944) says volatility is compressing—breakouts punish late longs.

Debate:
If the 1D trend is bearish and confidenc
LAB+2.03%
Most traders are staring at SNDK wrong—this 4h signal says the range is about to break ugly.

$SNDK /USDT - SHORT

Trade Plan:
Entry: 1760.48 – 1765.58
SL: 1794.81
TP1: 1739.20
TP2: 1723.31
TP3: 1699.48

Why this setup?
Why now?
- Price pinned at 1763 with RSI (15m) at 43.65—momentum is fading, not building.
- 1D trend is *range*, but SHORT bias at 77% confidence means the floor is cracking.
- Targets are stacked: TP1 1739 → TP2 1723 → TP3 1699—that’s a 3.6% drop from entry, with ATR (1h) at 10.18 confirming room to run.
- If longs can’t hold 1765.58, the trap door opens. This is a
SNDK+1.73%
Why is HYPE's 1D trend screaming bullish while its 15m RSI is frozen at 47.58?

HYPE/USDT - LONG

Trade Plan:
Entry: 85.18 – 85.46
SL: 83.93
TP1: 86.36
TP2: 87.06
TP3: 88.10

Why this setup?
The market is coiling, not reversing.
- 4h setup: LONG with 95% confidence—this isn't a guess.
- Pullback to 85.32 sits right on the 1h reference, with ATR (0.58) signaling low volatility = compressed spring.
- TP1 at 86.36 is only 1.2% away; TP2 at 87.06 and TP3 at 88.10 are within a single 4h candle's range on a bullish day.
- The 15m RSI is neutral, not overbought—meaning buyers haven't exhau
HYPE+1.61%
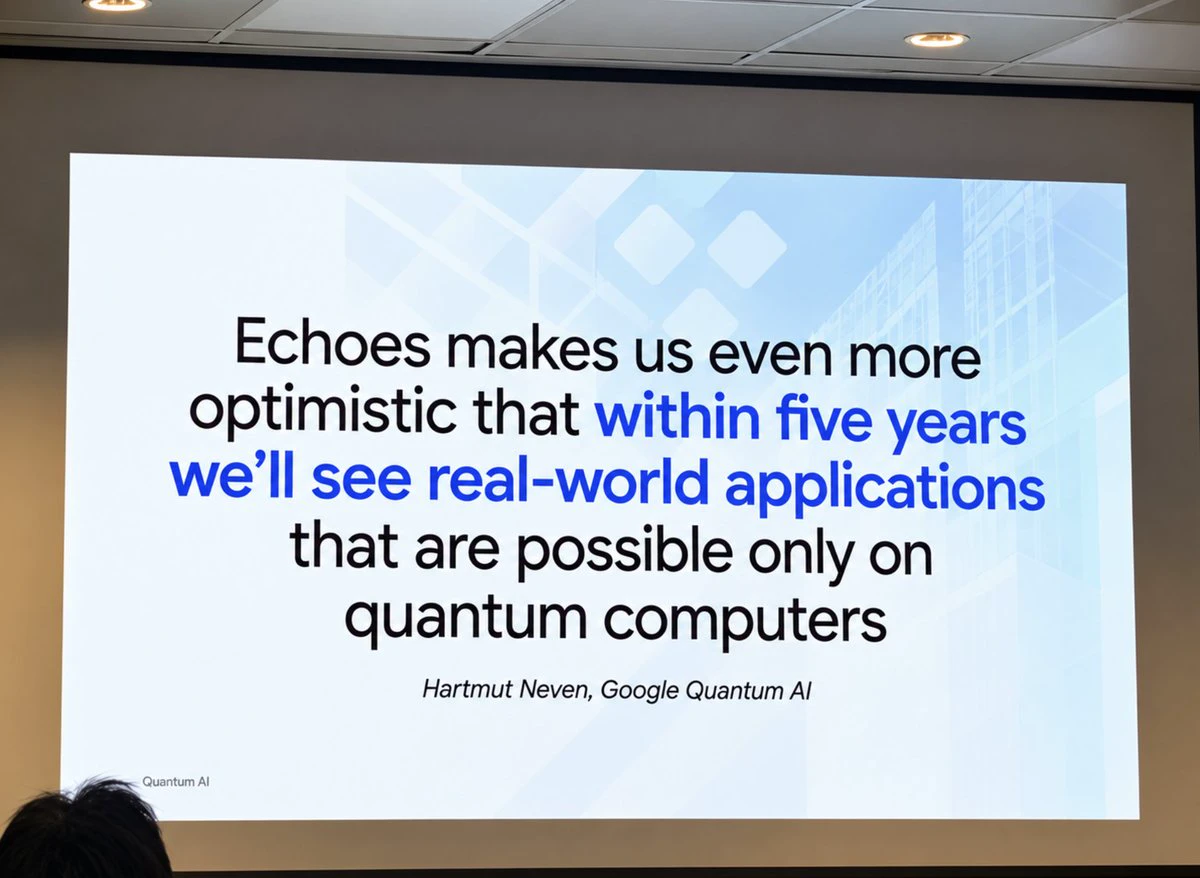
Ping Yeh, a software engineering manager at $GOOG Quantum AI, believes useful quantum computing is more than five years away
Hartmut Neven, who heads Google Quantum AI, has said recent results leave him confident that useful applications only quantum computers can handle will arrive within five years
“He is very confident,” Yeh said at the SEMICON forum. “I am a little skeptical. I want to be more conservative.”
post-image
GOOG-1.06%
GOOGL-1.12%
Load More

Join 40 M users in our growing community

⚡️ Join 40 M users in the crypto craze discussion

💬 Engage with your favorite top creators

👍 See what interests you

View More