Share your thoughts
placeholder
Article
Ethereum is sitting at a critical crossroads.
ETH is consolidating near $2,540 after a 30.91% rally, while exchange balances have fallen from 20M+ to ~14.7M ETH and ~43M ETH remains staked.
Tightening supply could support a move toward $3,000, but growing AI-agent risks may become a quiet bearish catalyst for crypto in Q4.
ETH breakout or rejection?
#ETH
ETH+1.48%
I originally wanted to cut my losses and sacrifice to the heavens, but the heavens never got their offering—the meat roasted itself. The last thing I saw before bed was $EDGEX at 0.3653. It stayed flat all day without breaking through, and the bottom structure looked exceptionally clean. I thought, if it still falls from here, that would truly make no sense, so I went long and then turned off my phone and went to sleep.
This morning, when I opened the chart, the price had already reached 0.6028, +646.39%. I got the timing right, and the profits naturally followed. The sleepless night paid off.
post-image
EDGEX-0.73%
BNB+0.41%
XRP+5.84%
$ETH Signal】4H EMA20 retest + order book depth imbalance, longs lying in wait
$ETH The 1H price is trading below EMA20 (2521.7), while 4H EMA20 at 2507.86 is providing support, with the current price hugging the lower edge of the 4H Bollinger mid-band at 2513. Order book depth imbalance is 96.84%, with buy orders stacking below and selling pressure being quickly absorbed. The 4H MACD histogram is -0.2966, and the fast and slow lines remain in a bearish crossover without converging; 1H RSI is 45.97, momentum is weak, and oversold conditions have not yet been reached. The funding rate is 0.001
post-image
ETH+1.39%
Layout for Bitcoin, Ethereum, and Dogecoin
live-cover
LIVE2,277
  • 2
$BTC Signal】Go long + lie in wait for a 1H pullback to EMA20
$BTC On the 1H timeframe, price is tracking EMA20 at 77524, while the Bollinger middle band at 77452 is providing support below. The 4H MACD histogram has expanded to 137, so bullish momentum is still continuing; the 1H histogram has narrowed from its high to 23, indicating that the short-term upward push is slowing. This is precisely the window to lie in wait in the pullback entry zone. The order book buy/sell ratio is only 0.01, with extremely low buy-order accumulation density; a single sell order could produce a long lower wick,
post-image
BTC+1.57%
Spot Ethereum ETFs have attracted more than $2B in net inflows in just a month and a half.
August recorded $1.85B in net inflows—the highest level since August 2025—followed by $328M in the first half of September. Last year, ETF inflows of $5.43B in July and $3.87B in August drove ETH’s price from $2,000 to $4,000.
The return of institutional capital is restoring a key catalyst, paving the way for a new growth phase for ETH if this accumulation continues.
post-image
ETH+1.48%
market prices updaes of $MEME COINS
live-cover
LIVE1,111
Transfer fees waived — +20% boost on transfers in. https://www.gate.com/campaigns/6208?ref=VLARBF1YAG&ref_type=132
post-image
CryptoChampion
Transfer fees waived — +20% boost on transfers in. https://www.gate.com/campaigns/6208?ref=VLARBF1YAG&ref_type=132
repost-content-media
Nobody is talking about the obvious short setup forming in WLD right now.

$WLD /USDT - SHORT

Trade Plan:
Entry: 0.3811 – 0.3835
SL: 0.3939
TP1: 0.3736
TP2: 0.3678
TP3: 0.3591

Why this setup?
Why now? The 1h price is pinned at 0.3823 inside a narrow range while the 15m RSI sits at 52.18, showing just enough momentum to push but not enough to break structure. The 1h ATR of 0.004829 confirms the market is compressing before a decisive move, and the daily trend remains bearish, which favors downside continuation. We are watching the entry zone between 0.3811 and 0.3835 for a short trigger to
WLD+0.55%
Bullish on Bitcoin—can it break $80k this time?
post-image
BTC+1.57%
Overnight overseas markets: Middle East geopolitics drove oil prices higher. Inflation expectations resurfaced. The 10-year US Treasury yield approached the 5% threshold. US stocks were volatile and weak, with semiconductor and AI hardware stocks leading declines. The Nasdaq Golden Dragon China Index held up relatively well. The dollar strengthened, gold came under pressure and retreated, and overall risk appetite cooled.
Biggest highlight: The Philadelphia Semiconductor Index plunged nearly 5.9%. Optical communications and memory chip stocks tumbled across the board, with TSMC and Micron post
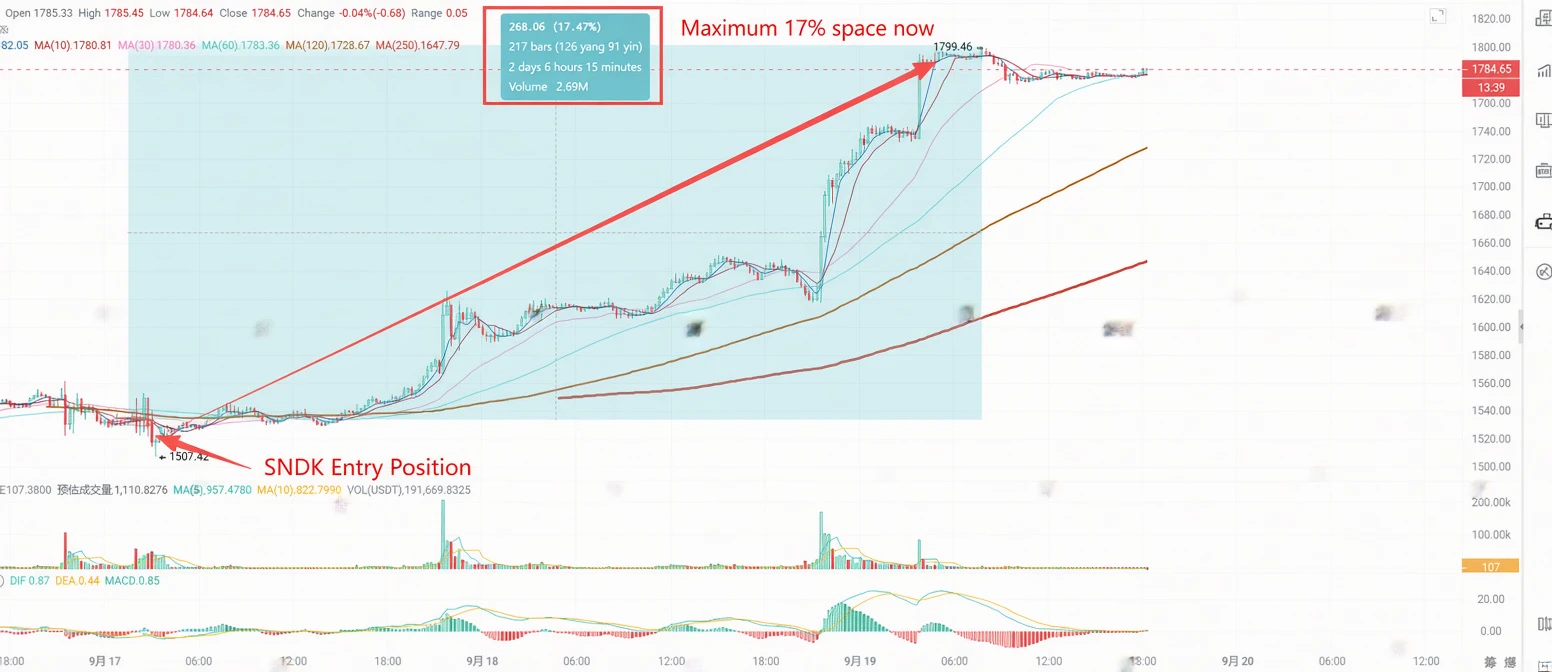
SNDK+0.10%
LIT made it onto the trending searches but only rose 7.1% in 24 hours: don’t chase the rally; buy on a pullback to 4.13
$LIT made it onto CoinGecko’s trending searches, rising only 7.1% in 24 hours, with the current price at 4.413—plenty of hype, but momentum hasn’t caught up. Don’t chase; buy the dip at 4.13.

Multiple timeframes are bullish. The 1-hour ADX is 22.1, with the trend just taking shape, while the daily ADX is 0, indicating no trend. However, the 1-hour SAR at 4.6382 has flipped above the price, signaling fading momentum, so chasing the price could easily result in a shakeout.

LIT+4.19%
September 15 15-minute short-term strategy:
ETH: Aggressive short at 2538, stop loss if it breaks above 2350; conservative short entry around 2585-2602, take profit around 2505--2495, stop loss if it breaks above 2620 or exit on a retest.
BTC: Short around 79267-79467, take profit around 77820-77680, stop loss if it breaks above 79800.
SOL: Short around 103.26--104.05, take profit around 101.43-101, stop loss if it breaks above 105 or exit on a retest.
For ETH, account for a $1-$3 price difference on the platform when entering; for BTC, account for a $50-$100 difference.
The breakouts and brea
ETH+1.48%
BTC+1.57%
SOL+2.90%
Reviewing last night’s market action, Bitcoin formed a bottom and stabilized around 77500, after which bullish momentum continued to build. The price fluctuated upward all the way, reaching a high near 79570 and recording a nearly 2000-point one-way rally, demonstrating strong buying support. The price has now pulled back slightly to around 78000, which is a normal technical correction after the rally, while the overall bullish structure remains intact.
From a technical perspective, support around 77500 was confirmed as effective after repeated tests. This level has shifted from previous resis
BTC+1.51%
#ShareWeekly #GateMeme
This is not just a hype correction, it's a shakeout. And shakeouts are the best buying opportunities - if you pick the right coin.
What's Happening with Robinhood Chain Memes?
Robinhood launched the chain in July for tokenized stocks, but what took over the chain was memes.
The data is very clear:
• The Pons platform generated $5.95M in fees in a single day. With this figure, it ranked 4th among all protocols on DefiLlama - leaving Pump.fun ($4.64M) behind and even surpassing the Robinhood Chain it runs on. • On the same day, 25,000 new tokens were launched on Robinhood
discovery
#ShareWeekly #GateMeme
This is not just a hype correction, it's a shakeout. And shakeouts are the best buying opportunities - if you pick the right coin.
What's Happening with Robinhood Chain Memes?
Robinhood launched the chain in July for tokenized stocks, but what took over the chain was memes.
The data is very clear:
• The Pons platform generated $5.95M in fees in a single day. With this figure, it ranked 4th among all protocols on DefiLlama - leaving Pump.fun ($4.64M) behind and even surpassing the Robinhood Chain it runs on. • On the same day, 25,000 new tokens were launched on Robinhood Chain, with daily DEX volume reaching $544M. • In the correction on September 7th, MEME fell 25.8% in 6 hours, PONS fell 14.8% in 24 hours.
So the hype hasn't cooled down, only leverage and quick profits were flushed out.
What Do the Charts Say? $PONS vs $MEME
$PONS/USDT - Currently: $0.62924 +11.37%
The run that started from $0.10357 on 08/27 topped at $0.97332 on 09/05. Then it had a healthy 46% correction down to the $0.52095 support. Now it has given the first recovery signal by climbing above EMA5 (0.60204) and EMA10 (0.58894). MFI 54.61 - neither overbought nor oversold, a perfect accumulation zone. With 24h volume of 32.67M PONS and $18.4M turnover, it is still the most liquid asset on the chain.
$MEME/USDT - Currently: $0.0005353 -1.62%
A more speculative structure. After the $0.0005789 top, it had a sharp wick to $0.0004906 (15%+ flash crash) and is still struggling to recover. 7-day performance is -4.51%, today is also -0.50% negative. There is volume (36.98M) but turnover is only $19.81K - meaning whale exits create deep drops.
My Pick: $PONS for Buying the Dip - Why?
There are two types of coins in the meme market: Story and Infrastructure.
$MEME is a story. The community is strong but it has no revenue, no burn, no utility. It's purely sentiment-driven.
$PONS is infrastructure. What Pump.fun did on Solana, Pons is doing on Robinhood Chain.
1. It charges a 1% fee on every transaction, leaving 70% to the creator and 30% to the protocol. 2. With the money left in the protocol treasury, it buys back PONS from the market and burns it. According to its documentation, 29% of the circulating supply (293M PONS) has already been burned. 3. The platform has produced 646,000 tokens from 167,000 unique creators. This means a new wave can come after every dip.
That's why choosing $PONS in this dip is like buying shares of the meme coin factory, not a meme coin itself. Even if the hype ends, the factory keeps printing money.
This is a shakeout. Weak hands have been washed out, fees are still in the millions. I'm not staying on the sidelines, I'm gradually accumulating the dip on the PONS side.
Note: Not financial advice. Do your own research.
$MEME $PONS
repost-content-media
PONS+24.32%
MEME+0.07%
PUMP+4.80%
gm What’s the difference between an Americano with no ice and traditional Chinese medicine?
post-image
Register to Get 5 USDT, Up to 240 USDT per User https://www.gate.com/campaigns/event/6234?ref=BVIRBA8M&ref_type=132
post-image
discovery
Register to Get 5 USDT, Up to 240 USDT per User https://www.gate.com/campaigns/event/6234?ref=BVIRBA8M&ref_type=132
repost-content-media
I originally wanted to cut my losses and sacrifice the position to the heavens, but the sacrifice never happened—the meat roasted itself. When the screen was glowing green, $VTHO plunged along with everything else. While everyone else was running, I instead watched it for five minutes—insufficient buying support, heavy signs of a bull trap, and every rebound was fake. I decisively followed, shorting at 0.0008862. This is a game for the bold and the careful.

Just after reading the bearish news, I posted an update: Don’t rush to catch a falling knife. It’s now at 0.0006126, +757.07%; those who
post-image
VTHO-26.80%
SNDK+0.10%
ZEC+8.46%
Load More

Join 40 M users in our growing community

⚡️ Join 40 M users in the crypto craze discussion

💬 Engage with your favorite top creators

👍 See what interests you

Trending Topics

GateTopsGlobalGrowth

24.6k Views610 Discussing

According to the latest CryptoQuant data, Gate's spot trading volume ranks top 3 globally, with the fastest growth worldwide, while futures trading volume growth also ranks top 3 globally. Market activity is accelerating back, and Gate's growth momentum continues to lead. Market heat is back — are you mainly trading spot or futures these days? [👉 Full report:](https://cryptoquant.com/insights/research/6aa7aaca26ed15760f9ca834)

GateUSExpandsTo37StateLicenses

22.77k Views374 Discussing

AnthropicPicksNasdaqForIPO

72.62k Views2.75k Discussing

View More