










#BTC大跌 #ShareWeekly
Bitcoin at $77,768: Is the Market Preparing for a Recovery or Another Major Correction?
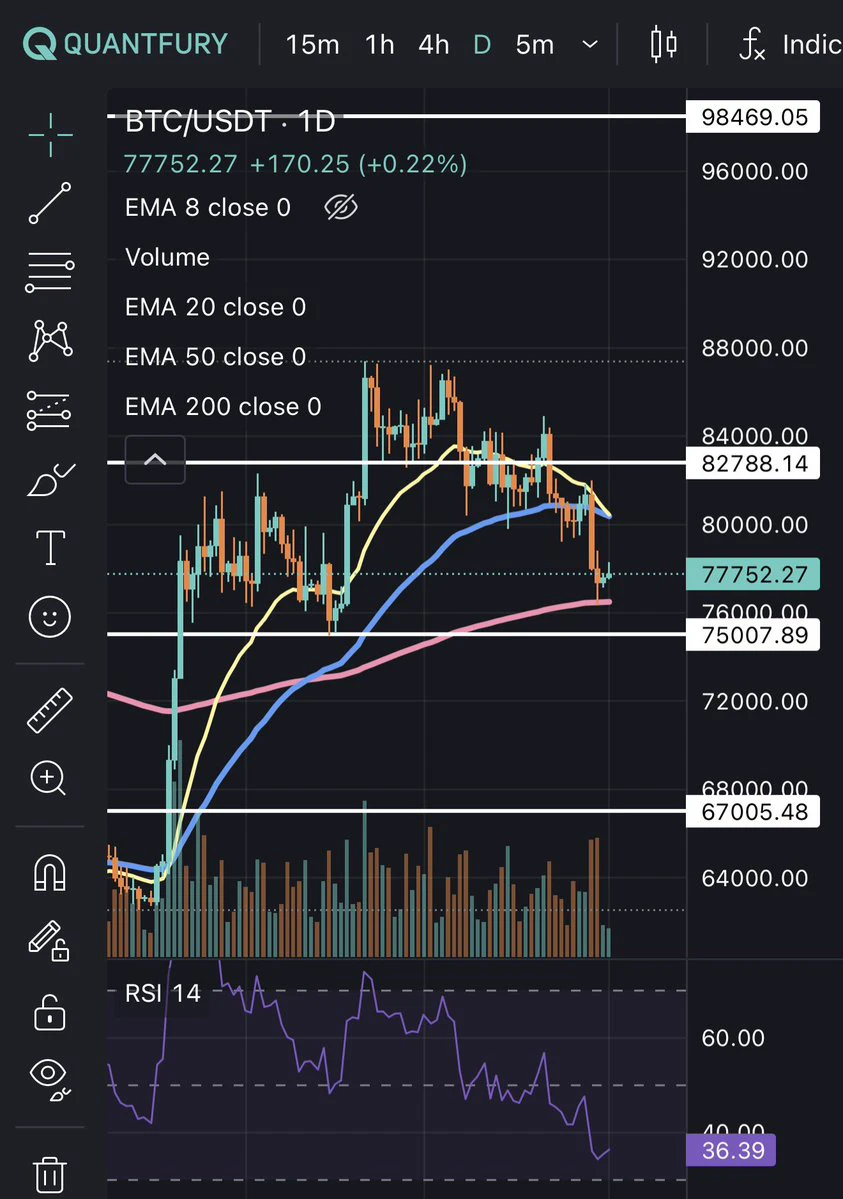
Bitcoin is currently trading around $77,768, following a sharp decline that arrived earlier than many traders expected. The sudden bearish move has changed the short-term market outlook and brought important support and resistance levels into focus.
After spending much of October developing a bearish right-shoulder structure, Bitcoin finally experienced the downside movement that many technical analysts had been anticipating. The decline accelerated as negative market sentiment and a reported security incident added further pressure.
However, the most important question now is whether Bitcoin is preparing for a sustainable recovery or simply experiencing a temporary relief bounce before another downward move.
In my view, the market is entering an important decision-making phase. At $77,768, BTC is trading above the previously identified $76,300 support area, but buyers still need to prove that they can regain control.
1. Bitcoin at $77,768: Can Buyers Defend the Current Structure?
The $76,300 region remains an important daily order block and potential demand zone. Bitcoin's ability to remain above this area could encourage short-term buyers to enter the market.
At the current price of $77,768, BTC is approximately 1.9% above that support level.
This creates an important opportunity for buyers, but confirmation is essential. If Bitcoin maintains its position above $76,300 and develops stronger buying momentum, the possibility of a recovery could improve.
However, losing this support could bring renewed selling pressure and expose lower price levels.
2. $79,200 Is the First Major Recovery Test
The next important resistance is $79,200.
This level deserves attention because reclaiming it could indicate that Bitcoin is beginning to reverse its short-term bearish structure.
A convincing breakout followed by a successful retest would strengthen the recovery scenario.
If buyers manage to establish $79,200 as support, the next potential target would be the $81,000–$81,300 resistance zone.
However, a rejection around $79,200 could indicate that sellers are still controlling the market. Traders should avoid treating every upward movement as the beginning of a new bullish trend.
3. What Happens If Bitcoin Falls Below $76,300?
The bearish scenario cannot be ignored.
If BTC loses the $76,300 support area with strong selling volume, the market could begin searching for liquidity at lower levels.
The $72,500–$73,300 region remains an important downside area from the previous technical analysis.
Beyond that, the broader potential bottoming zone remains between $70,000 and $73,000.
These levels should be considered potential areas of interest rather than guaranteed reversal points.
A deeper correction would also depend on overall market liquidity, derivatives positioning, investor confidence, and Bitcoin's ability to attract fresh demand.
4. Ethereum: Recovery Depends on Market Confidence
Ethereum also needs to demonstrate strength before the broader altcoin market can establish a convincing recovery.
The important levels remain:
- $2,275: Initial resistance and recovery reference.
- $2,355: Next major resistance to monitor.
If ETH reclaims these levels with stronger volume, market confidence could gradually improve.
However, continued weakness in BTC could prevent Ethereum and other major altcoins from sustaining their recovery attempts.
5. Why the Bottom May Require More Time
One important lesson from this correction is that a market bottom rarely develops exactly when traders expect it.
The bearish shoulder structure took weeks to develop, and a complete recovery may also require time.
Bitcoin could experience several temporary rebounds, liquidity grabs, and retests before establishing a reliable bottom.
Therefore, I would not assume that holding $76,300 for a short period automatically confirms the end of the correction.
Patience and confirmation are more valuable than trying to predict the exact lowest price.
6. Storage Stocks: Important Resistance Levels
The recent weakness has also affected technology and storage-related stocks.
Two levels worth monitoring from the previous analysis are:
- Micron (MU): $952 resistance.
- SanDisk (SNDK): $1,360 resistance.
These levels could help traders evaluate whether the stocks are recovering or continuing to face selling pressure.
After experiencing losses in an earlier short position, the better approach is to remain selective rather than immediately attempting another trade.
Capital preservation should always come before recovering previous losses.
7. My Strategy at the Current Bitcoin Price
At $77,768, I would focus on three possible scenarios:
- Bullish recovery: BTC holds $76,300, breaks $79,200, and moves toward $81,000–$81,300.
- Sideways consolidation: BTC continues fluctuating between $76,300 and $79,200 while the market searches for direction.
- Bearish continuation: BTC breaks below $76,300 and potentially moves toward $72,500–$73,300, with $70,000 remaining part of the wider downside scenario.
I prefer waiting for a confirmed breakout and retest instead of chasing sudden price movements. Keeping risk controlled and avoiding unnecessary leverage are particularly important during uncertain market conditions.
Final Thoughts
Bitcoin at $77,768 is approaching a critical technical decision point. The market has already experienced significant selling pressure, but the next move will depend on whether buyers can defend support and reclaim important resistance levels.
For now, $76,300 is the key support to watch, $79,200 is the first recovery hurdle, and $81,000–$81,300 represents the next major upside resistance zone.
If support fails, $72,500–$73,300 could become the next important area of interest.
My overall view remains cautious but open to a recovery. I believe traders should focus on confirmed market structure rather than emotional reactions to every green or red candle.
The bottom may not form overnight. Sometimes the smartest trading decision is simply waiting until the market reveals its next direction.
Not financial advice. Always do your own research.
#每周来晒 #BTC跌至7.7万美元 #WCTCS9 @Gate_Square $BTC