Square
Following
Hot
News
Notifications
Profile
Share your thoughts
placeholder
Article
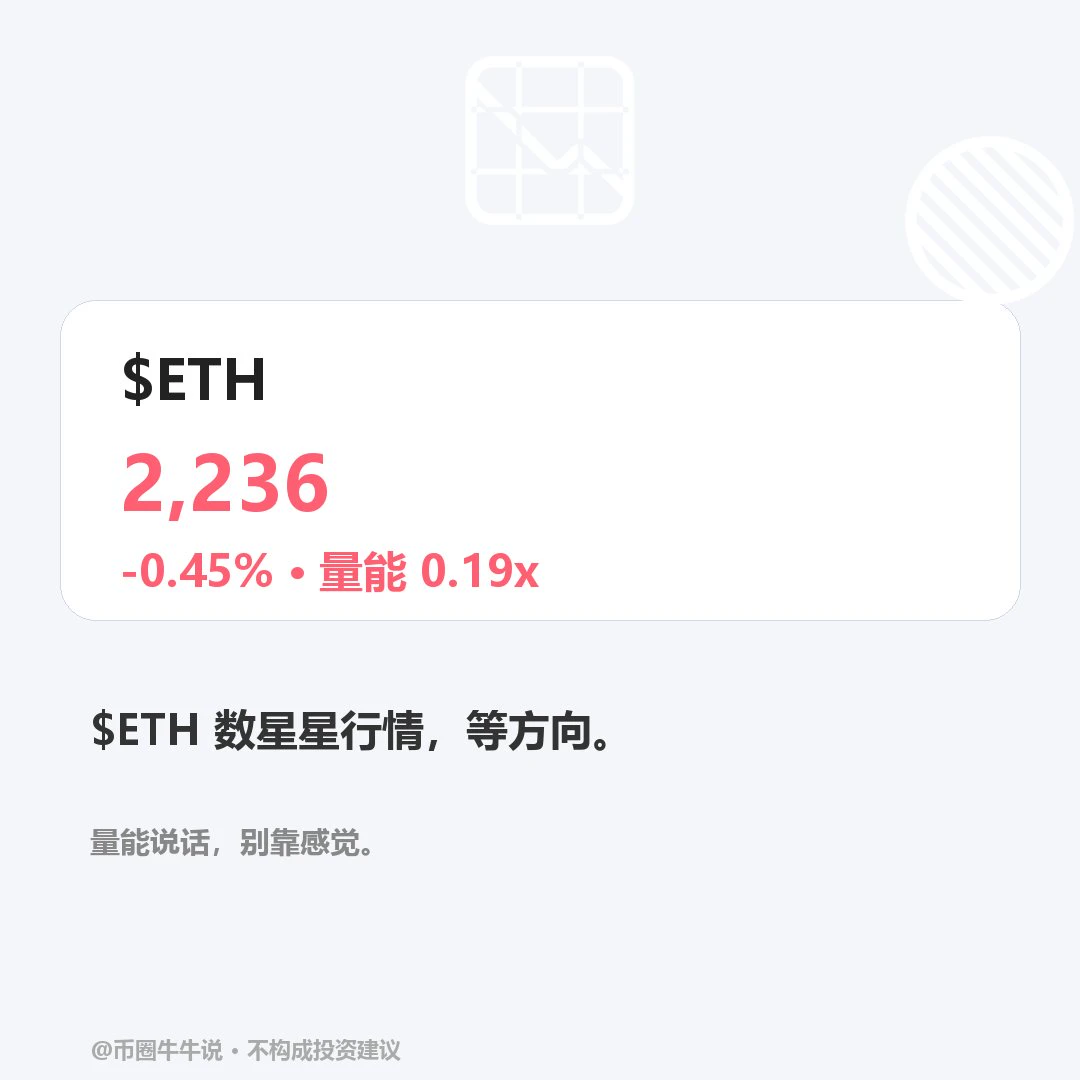
$ETH Current price: 2236.13, 24H -0.45% (2222.58–2251.52). 1H is weak: RSI 53.12 / EMA20 2237.37, support at 2222.58 / resistance at 2251.52; 4H is weak: RSI 48.72 / EMA20 2258.38, support at 2206.00 / resistance at 2450.79. A sustained move above resistance at 2251.52 is meaningful; a break below support at 2222.58 would signal further weakness. Review whether price holds above 2251.52 and reclaims 2222.58 after breaking below it; the volume ratio is 0.19x. Without confirmation from trading activity, or if price fails to reclaim the level, the setup is invalidated. High market volatility; for
post-image
ETH-1.26%
A new wallet withdrew 3,100 ETH from a mixer, split it into 6.92 million USDC, and deposited it on an on-chain contract platform. It then opened a hedge: a 169.47 BTC long and a 5,740 ETH short, with nearly equal notional values—$12.84 million versus $12.83 million—both at 20x leverage. This position is betting not on whether prices rise or fall, but on BTC’s relative strength against ETH. The problem is that the funds came from a questionable source, and both legs are fully leveraged. If ETH spikes upward, the short side will be liquidated first. The approach looks like it came from a veteran
post-image
ETH-1.23%
BTC-0.65%
USDC+0.01%
Trenches
ZIG
Z
bade
b
ZIG
0x8c...1145
Market Cap
$.
Change
.
24h Vol
$.
Holders
.
STONK
S
bade
b
STONK
6GmA...UNgx
Market Cap
$.
Change
.
24h Vol
$.
Holders
.
IDOL
I
bade
b
IDOL
0x3b...ab07
Market Cap
$.
Change
.
24h Vol
$.
Holders
.
CLAUDIA
C
bade
b
CLAUDIA
2j5S...W2ZM
Market Cap
$.
Change
.
24h Vol
$.
Holders
.
MAGGIE
M
bade
b
MAGGIE
8rHo...PmZV
Market Cap
$.
Change
.
24h Vol
$.
Holders
.
#70%山寨币跌破200日均线 70% is a high proportion, but still far from extreme oversold territory. For now, it looks more like the market is continuing to weaken; there is no clear sign that a reversal is near.
The proportion has rebounded quickly: At the beginning of October, only about 10% of altcoins were below this line, but it has since risen to 70%, showing that the decline came quickly.
Still far from extreme oversold territory: At the end of June, this proportion once reached about 84%. Some analysts believe that only a reading above 90% counts as an extreme oversold signal.
The drivers are macr
USDC+0.01%
BTC-0.67%
ETH-1.26%
SOL-0.77%
  • 2
How can you develop an effective stop-loss strategy for BTC trading? Don’t let one mistake snowball into a major loss!

In BTC trading, many people know the importance of stop-losses, but often hesitate when it comes time to place an order. Some set their stop-losses too close and get taken out by normal price fluctuations; others keep moving their stop-losses after suffering obvious losses, hoping the price will rebound.

So how can you build a truly effective stop-loss strategy?

First, determine stop-loss levels based on market structure. When going long, you can look at key support levels
post-image
BTC-0.67%
How do you read the balance of bulls and bears in BTC trading?

In BTC trading, when the price rises, many people think bulls have the upper hand; when the price falls, they think bears have taken control of the market. But the real battle between bulls and bears is not as simple as looking at whether a candlestick is red or green. You need to observe the relationship between price, trading volume, and market structure.

So how can you tell which side is currently in control?

First, observe the price structure. If BTC keeps forming higher highs and higher lows, it means buyers are continuousl
post-image
BTC-0.67%
BTC News Analysis: How Can Market News Improve Trading Decisions?
In BTC trading, many people study candlestick charts, MACD, and RSI every day, yet overlook an important factor that can significantly affect market movements: news.
Sometimes, BTC suddenly rises or falls in a short period, not because technical indicators signaled it in advance, but because of new policies, economic data, or changes in capital flows. Shifts in the news can quickly change investor expectations and, in turn, affect the balance between buyers and sellers.
So, how should you use news analysis when analyzing BTC?
Fi
post-image
BTC-0.67%
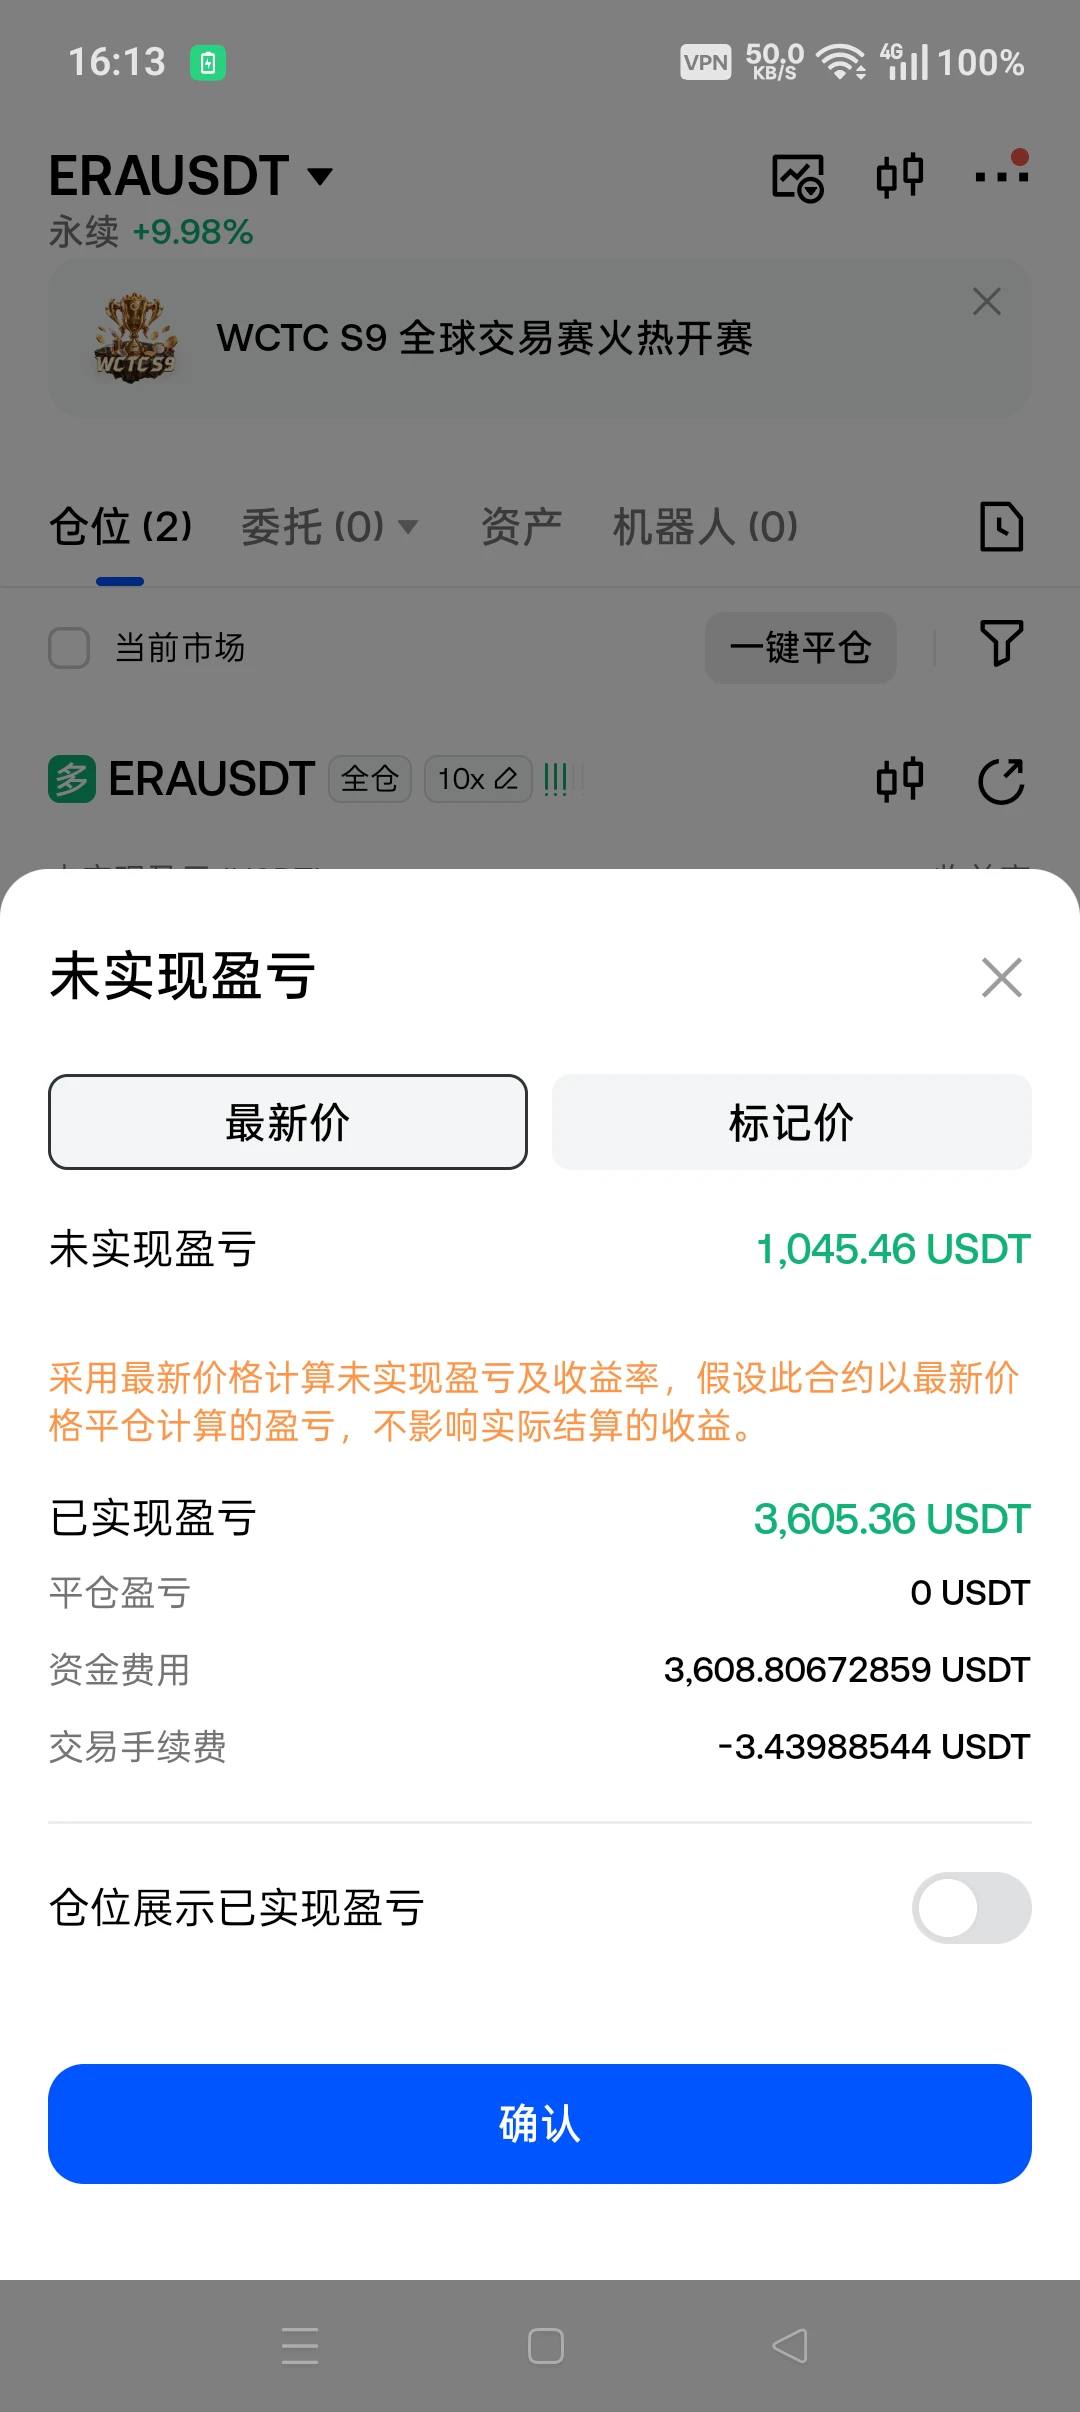
$ERA It has been listed for a month😅😅
post-image
ERA+24.21%
Profiting first and losing later is one of the most toxic ways to die in futures trading.

Here’s the conclusion first: a trade that pulls back before turning profitable (you enter with an unrealized loss, then eventually reach your target) is a healthy trade. A trade that profits first and loses later is the most damaging kind.

Why is “profit first, loss later” so toxic? It shifts your psychological anchor. When you’re up $300 in unrealized profit, you feel like that money is already yours. Giving it back to zero feels unbearable; falling to -$200 feels even worse. Eventually, you start hold
$BNB Bullish setup: Entry zone set at $697, first target at 704, second target at 710, with a stop at 692.
ETH bullish setup: Entry zone 2,230–2,238, first target 2,250, second target 2,265, stop-loss at 2,218.
SOL bullish setup: Entry price 89.14, stop-loss 87.80, first target 90.39, second target 92.00, third target 94.00.
Three long positions are being opened simultaneously; pay attention to position sizing. Contract trading carries extremely high risks, so participate cautiously based on your own risk tolerance. (The above is solely a personal opinion and does not constitute investment adv
post-image
700
700Flight700
Pump.Fun
MC:$2.61KHolders:2
0%
BNB-0.72%
ETH-1.23%
SOL-0.74%
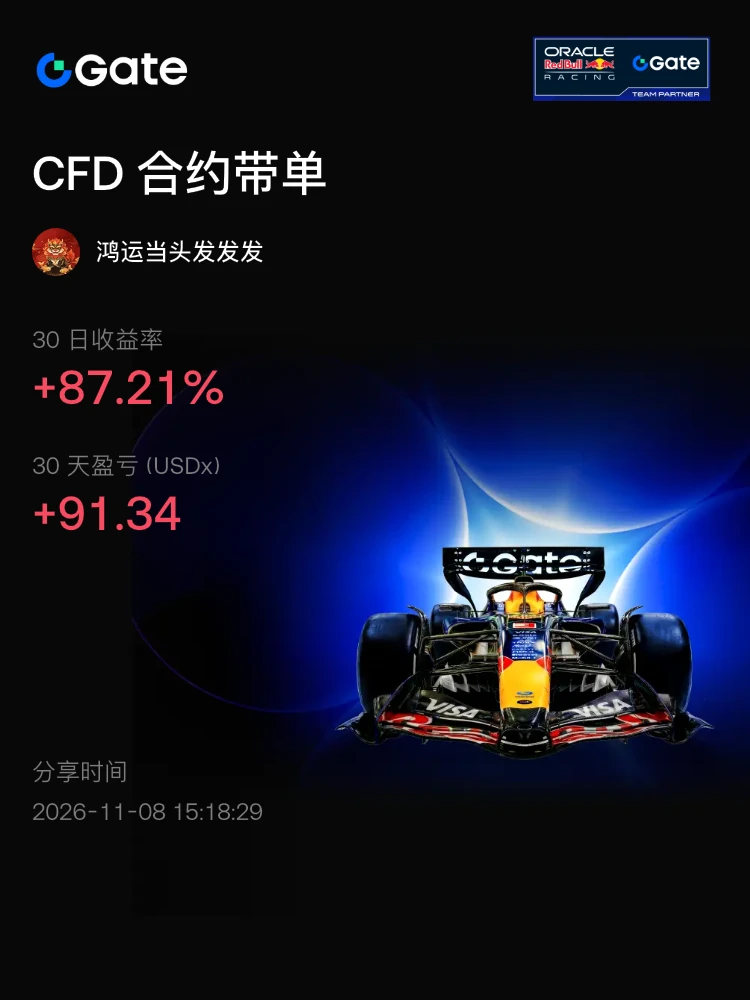
We’re starting tomorrow. Your funds should ideally match mine or be slightly higher; if you have less, I recommend using fixed copy-trading mode!
post-image
  • 1
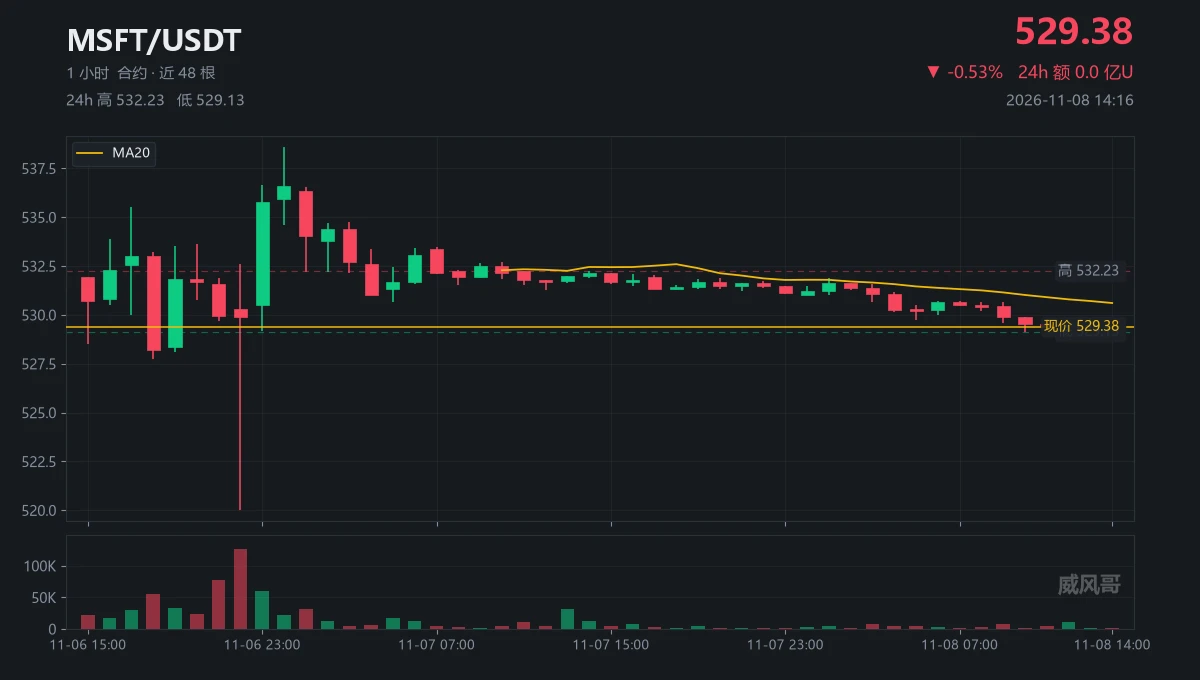
At 14:00, that candle had 1,110 lots, 30% of average volume. I checked twice.
· Position cost: stop-loss at 520.02, a $9.36 distance from 529.38.
· Reward cost: only 9.22 to 538.6, for odds of 0.98.
· Time cost: until Monday 22:30, the price won’t be determined by the market for thirty-two hours.
· Sweep cost: 1,110 lots move it $0.32; 11,541 lots move it $0.08.
· Trend cost: even after thirty-eight hours, it only recovered 9.22; it hasn’t touched 537 since 538.6.
With all five costs laid out, the gain is less than the loss. No need to run the numbers twice.
$MSFT 24-hour trading volume is $4
post-image
MSFT+0.59%
  • 1
#Ahr999EntersBottomBuyingZone #ShareWeekly
AHR999 Enters Bottom Buying Zone: Is Bitcoin Approaching a Major Accumulation Opportunity?
The Bitcoin market is attracting renewed attention as the AHR999 indicator reportedly enters its bottom buying zone. This development has become an important discussion point among cryptocurrency investors who use on-chain indicators and historical market data to evaluate Bitcoin's long-term valuation.
Bitcoin is known for its high volatility, and identifying potential market bottoms has always been challenging. However, indicators such as AHR999 can provide add
BTC-0.67%
The banter between these two is so vivid—it’s the ultimate showdown between “self-made” and “money talks”! 😂
Gates mocked Musk for only knowing how to buy companies, and Musk fired back: “Don’t make me buy Microsoft and fire you.” The funniest part is that the Altair Basic code that got Microsoft off the ground was actually copied from someone else...
But here’s the big twist: the screenshot of this exchange was actually photoshopped by a netizen (X officially debunked it), but that doesn’t stop it from being the internet’s best joke of the year.
#马斯克 #比尔盖茨 #InternetHallOfFame
#BTCETF资金持续流出 For now, continued ETF net outflows look more like short-term risk aversion and deleveraging than institutions collectively exiting Bitcoin. But the concentration of outflows in BlackRock's IBIT also shows that some large investors are adjusting their allocations.

Why this doesn't look like a collective institutional retreat
Outflows were highly concentrated: From November 2–5, cumulative outflows were about $869.8 million, of which IBIT alone accounted for about $806.5 million.
There were both inflows and outflows: On November 4, there was a net inflow of about $128 million, wi
BTC-0.31%
#Crypto Market Under Pressure$BTC and $ETH are following global risk assets lower. Is now the time
live-cover
LIVE2,078
#Gate股票畅聊季 AI Market Collapse + Stagflation Looming: U.S. Stocks Enter a Period of Volatility

The market is seriously misjudging the AI sector’s ability to deliver on earnings and the macroeconomic pressure from stagflation. The risk-reward profile of one-way bets on U.S. stock indexes has deteriorated sharply.

I. Root of the Risk: Global Liquidity Imbalances and an Unsustainable AI Capex Bubble
The source of this market risk lies in the long-term structural imbalance in global cross-border capital flows. Overseas funds have continued pouring into dollar assets, steadily pushing up valuation
CRWV+6.18%
TSLA+4.26%
ORCL+0.84%
VST+10.47%
SPY+0.06%
When Judging BTC’s Trend, Should You Look at the Daily or 4-Hour Chart?
In BTC trading, many people look at candlestick charts every day, yet often run into this problem: the daily chart seems to be rising, while the 4-hour chart has already started falling; the 4-hour chart shows a buy signal, while the daily chart is still in a downtrend.
Which timeframe should you trust?
Actually, the daily and 4-hour charts are not contradictory; they serve different purposes.
First, the daily chart is mainly used to determine the overall direction. It can help us see whether the market is in an uptrend, d
post-image
BTC-0.67%
#AITechSelloffPutsCryptoUnderPressure #ShareWeekly #WCTCS9

AI Stock Selling Is Spreading Risk-Off Pressure Into Cryptocurrency: What Investors Need to Understand
Artificial intelligence and technology stocks have suffered a sharp correction, and the shock has reached digital assets. When investors reduce exposure to high-growth technology shares, they may also cut positions in Bitcoin and other cryptocurrencies. This does not mean that AI stocks directly control crypto prices, or that every technology decline must produce a Bitcoin crash. The connection often comes through investor confidenc
SUNDAY CEYPTO MARKET UPDATE BTC
live-cover
LIVE1,122
When your account is small, the biggest mistake is “trying to grow it fast.” Doubling 100U only gets you 100U; even a tenfold gain gets you just 1000U, but you’re risking blowing up your account. At this stage, the priority isn’t making money—it’s staying in the game. ① First, accept that you’re here to pay tuition. The greatest value of 100U isn’t how much you can earn, but the discipline you build by practicing with real money. Don’t trade with the mindset of “I need to make my money back.” Trade with the mindset of “I’m going to practice for three months without getting wiped out.” ② Levera
post-image
BTC-0.65%
Load More

Join 40 M users in our growing community

⚡️ Join 40 M users in the crypto craze discussion

💬 Engage with your favorite top creators

👍 See what interests you

Trending Topics

USCPIDataIncoming

4.99k Views1.53k Discussing

The U.S. October CPI report will be released on November 10 at 8:30 a.m. ET. September CPI came in at 3.7% year over year, and markets will be watching closely for signs that inflation is cooling, especially in core CPI. A softer-than-expected reading could strengthen rate-cut expectations, while hotter inflation may pressure risk assets through higher Treasury yields and a stronger dollar. How do you think this CPI print will move $BTC, U.S. stocks and gold?

USAIStocksHitHard

25.32k Views3.71k Discussing

USNonfarmPayrolls

46.11k Views4.44k Discussing

View More