Square
Following
Hot
News
Profile
Share your thoughts
placeholder
Article
$IDOL A death cross has appeared—get ready for a sharp drop
post-image
IDOL-6.71%
  • 8
I’ve been following @primus_labs lately, and its progress over the past few months is worth paying attention to.
I think Primus is trying to address a long-standing tension in onchain finance: finance needs transparency, but users and institutions can’t possibly make all their data public.
1️⃣ Starting with proof of reserves
Primus’s PoR is already being used in production, with projects like Unitas and XGLD using it to verify reserves.
With technologies like zkTLS, offchain data can be verified without exposing all sensitive information, such as account and asset details.
This means pro
UP-1.81%
BNB-0.76%
RWA-0.39%
Trenches
ZIG
Z
bade
b
ZIG
0x8c...1145
Market Cap
$.
Change
.
24h Vol
$.
Holders
.
BTC
B
bade
b
BTC
C5xp...pump
Market Cap
$.
Change
.
24h Vol
$.
Holders
.
HIGH
H
bade
b
HIGH
7ymF...high
Market Cap
$
Change
.
24h Vol
$.
Holders
.
STONK
S
bade
b
STONK
6GmA...UNgx
Market Cap
$.
Change
.
24h Vol
$.
Holders
.
LEEROY
L
bade
b
LEEROY
98HE...pump
Market Cap
$.
Change
.
24h Vol
$.
Holders
.
The market plunged 800 points, but it rose 4%—MediaTek is the most “out of step” of these 19 stocks
Taiwan stocks fell more than 800 points at their intraday low on November 2, while MediaTek surged to an intraday high of NT$4,070, up more than 4%, and closed at NT$3,970, bucking the trend. The next day, November 3, it plunged another 7.43%, with such extreme volatility that it made you question everything. But foreign brokerages collectively raised their target prices after the earnings call, to a range of NT$5,500–NT$7,300, with even the highest target still a long way above the current pric
ETH-1.23%
BTC’s daily chart shows a V-shaped reversal after a sharp wick down, holding above the Bollinger middle band, with a bullish MACD and KDJ golden cross signaling a recovery in the broader trend.
Four-hour momentum is strong, breaking above the Bollinger upper band, but KDJ is extremely overbought and substantial profits have accumulated. A technical pullback is likely in the short term to absorb profit-taking and confirm the breakout.
Overall, the broader outlook is bullish, but avoid chasing prices in the short term; it’s better to go long after a pullback confirms support.
🉑Go long near 7980
post-image
BTC-0.67%
ETH-1.26%
  • 2
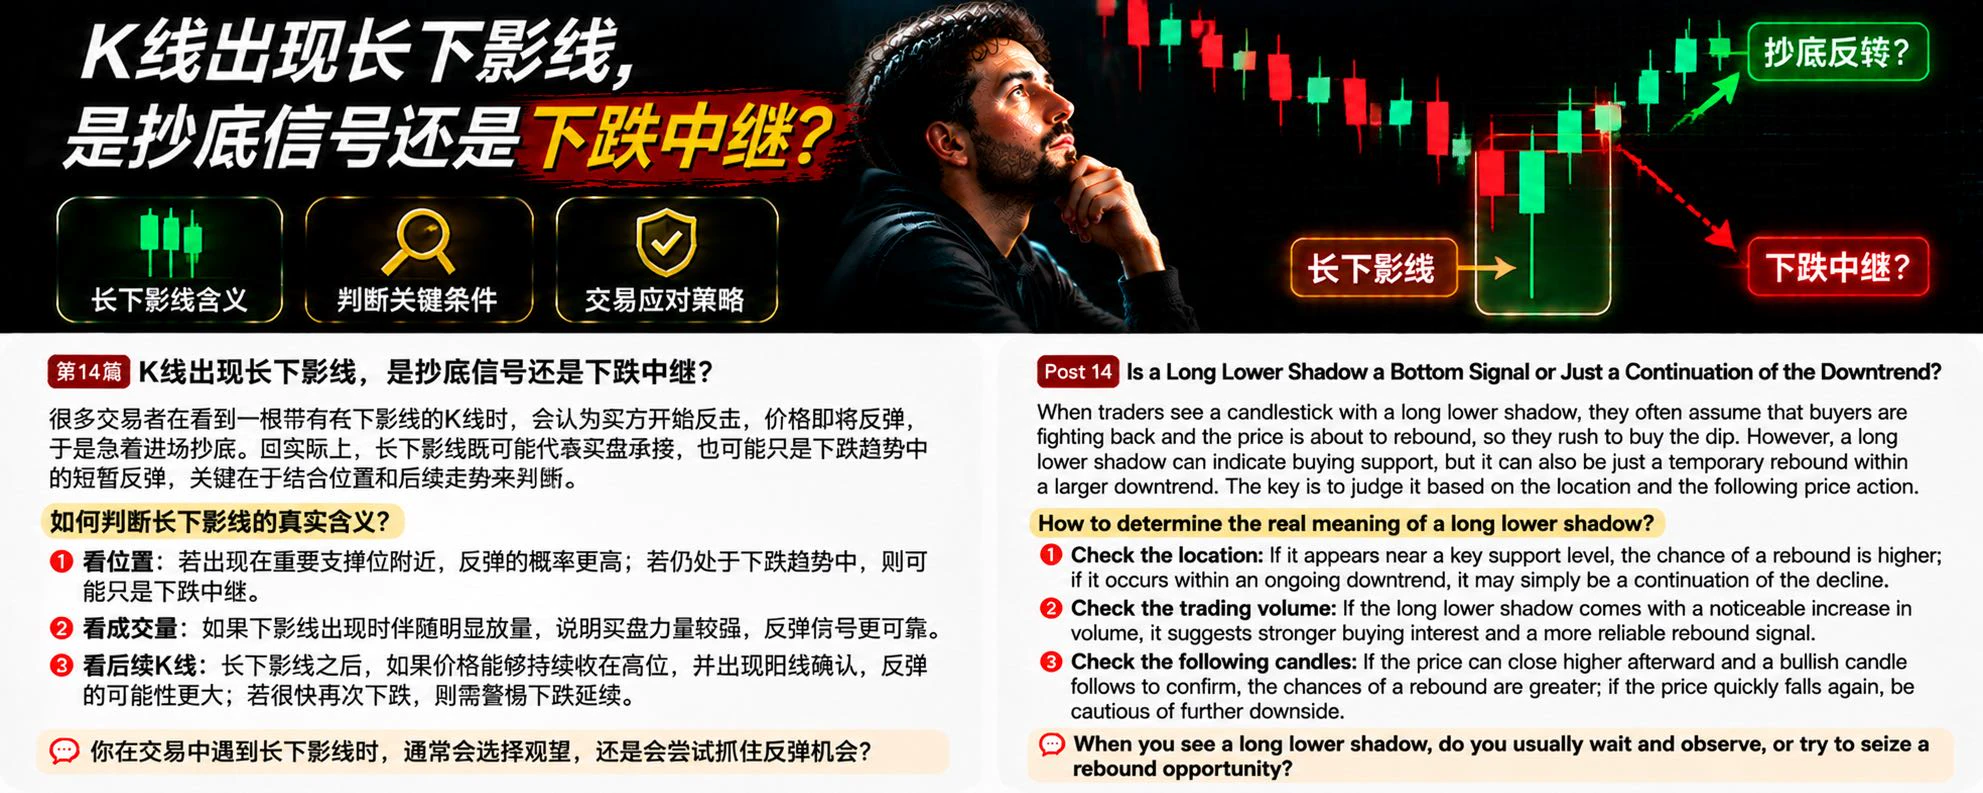
In BTC trading, many people see a candlestick with a long lower shadow and assume buyers are starting to fight back and the price is about to rebound, so they rush in to buy the dip. But in reality, a long lower shadow does not necessarily mean a trend reversal; it may simply be a brief rebound during a decline.
So how should you judge?
First, look at where it appears. If a long lower shadow appears near an important support level from earlier, it suggests that strong buying may have absorbed selling after the price fell into this area, making the rebound signal relatively more significant. Bu
post-image
BTC-0.67%
Saw this morning: 2 years of Pro for free
I tried it out with a small account, and based on my experience, I don't recommend doing it
Stacking perks: 1 year of free Pro + 6 months from a Pixel phone + 6 months from a Samsung S25
I only stacked two; I didn't dare stack the last one
You could get banned at any time
Those who are bold can give it a try; I don't recommend it for anyone who hasn't tried it
post-image
Zec market update
live-cover
LIVE2,256
Crypto market cap is down about 11% this year. Meanwhile:
- $HYPE +253%-
‍$PUMP +128%-
$UNI +29%
post-image
HYPE+0.24%
PUMP-1.06%
UNI+3.05%
$ETH
ETH surged like crazy yesterday
Has the trend reversed?
Where exactly is the trend headed next?
Long or short?
Damn
Guys
ETH went on a massive rally yesterday
Gaining more than 6.58%
It violently reversed
The situation is very clear now
Big Hammer was still saying yesterday that the downtrend had diverged
And that a reversal could happen at any moment
By evening, it had exploded upward
Now we can say it has reversed
First, on the daily timeframe
ETH has completed its pullback to the trendline
Meanwhile, on the 4-hour timeframe, it broke above the mid-term high
That was the bears' last li
ETH-1.23%
Morning market update
live-cover
LIVE1,726
Gold trading session: The market moved too much from yesterday to today. Those damn market makers taught me a lesson and liquidated me. I admit defeat.
PAXG+0.33%
XAU+0.38%
  • 2
No need to wait any longer—set up a short right now $ICNT
Entry: 0.23 TP: 0.2-0.21 SL: 0.26 Why short? The trend of forming a second top is beginning to show clear signs. The chart is forming a top. Buying and selling volume has declined slightly. Longs significantly outnumber shorts, making the likelihood of a decline liquidating longs very high
post-image
ICNT-10.32%
Fishing and trading are both, at their core, about waiting for the right opportunity.
A stablecoin is not the same as cash.
A price peg does not mean you can always redeem it at the target price; on-chain transfers do not mean there are no fees or risks.
Before using one, check the issuer, redemption rules, network compatibility, and liquidity.
If you hold a stablecoin long term, what do you check first?
post-image
  • 5
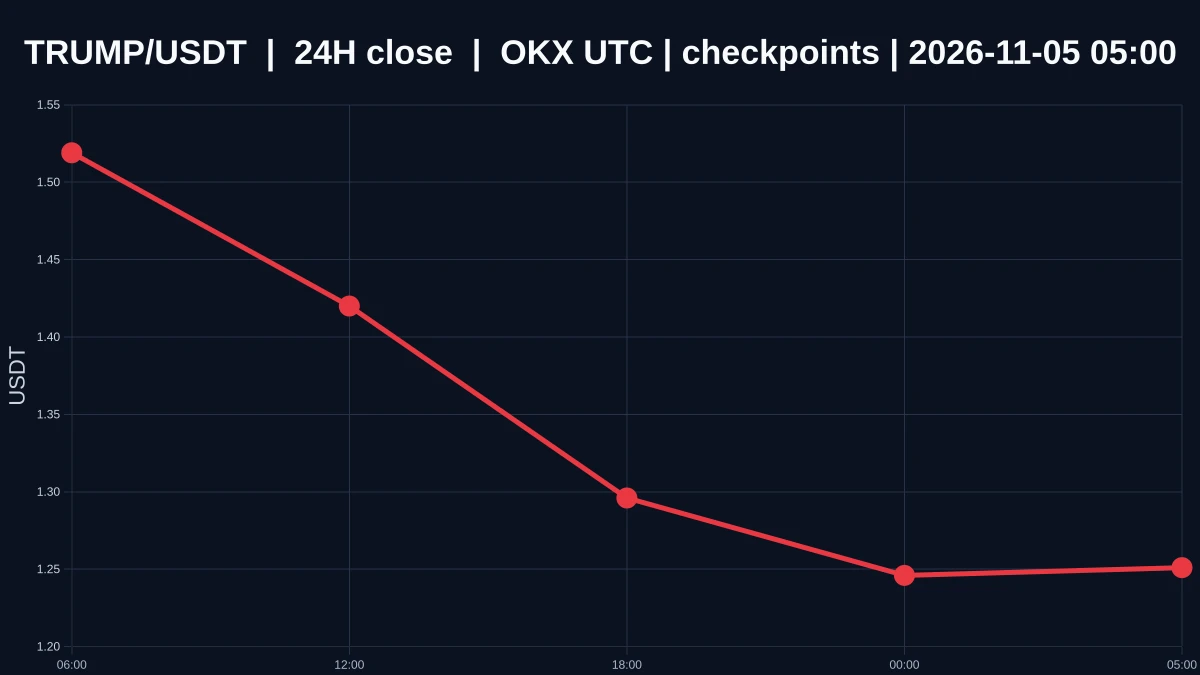
$TRUMP : Oversold vs. Bottoming—The Difference Isn’t the Size of the Drop
$TRUMP is currently priced at 1.25, down 17.65480895915679% over 24 hours, with an intraday high of 1.538 and a low of 1.218. The 1-hour and 4-hour trends are both weak, and the 1-hour volume ratio is just 0.017747325714257734. The price has fallen from 1.538 to around 1.218—a deep enough drop for oversold conditions to start emerging, with demand for a rebound building. But oversold describes exhausted momentum; it does not confirm a reversal. Until the structure stops weakening, I won’t call oversold conditions a bottom
post-image
TRUMP-0.95%
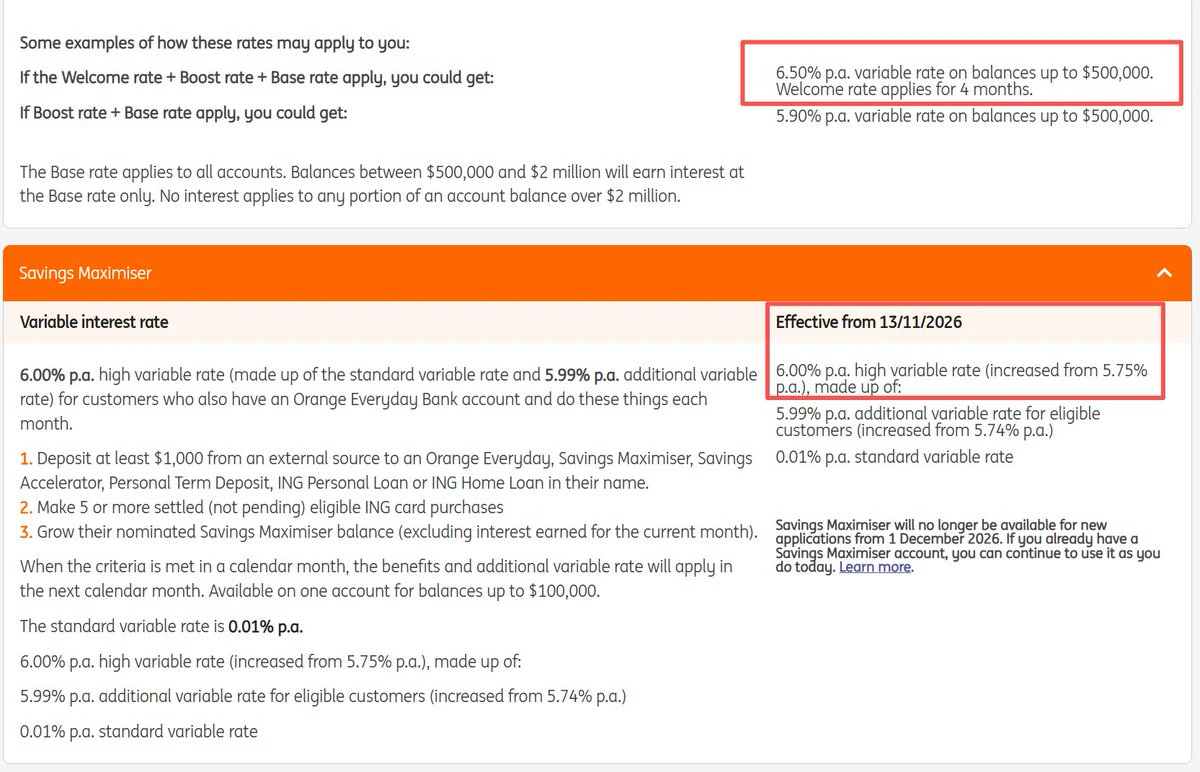
In October, I was still talking about ANZ Plus savings rates hitting 5.35%. Just one month later, Australian savings rates have climbed to 6%.
The RBA raised rates for the fifth time the day before yesterday, to 4.85%, the highest level in 18 years, and the banks were quick to follow suit.
Starting November 13, ING Maximiser is at 6%,
Westpac Life is at 6.2%, and even ING Booster is at 5.9%.
You can earn 6% just by leaving your money in the bank and doing nothing.
Is this really better than trading crypto now?🫣
post-image
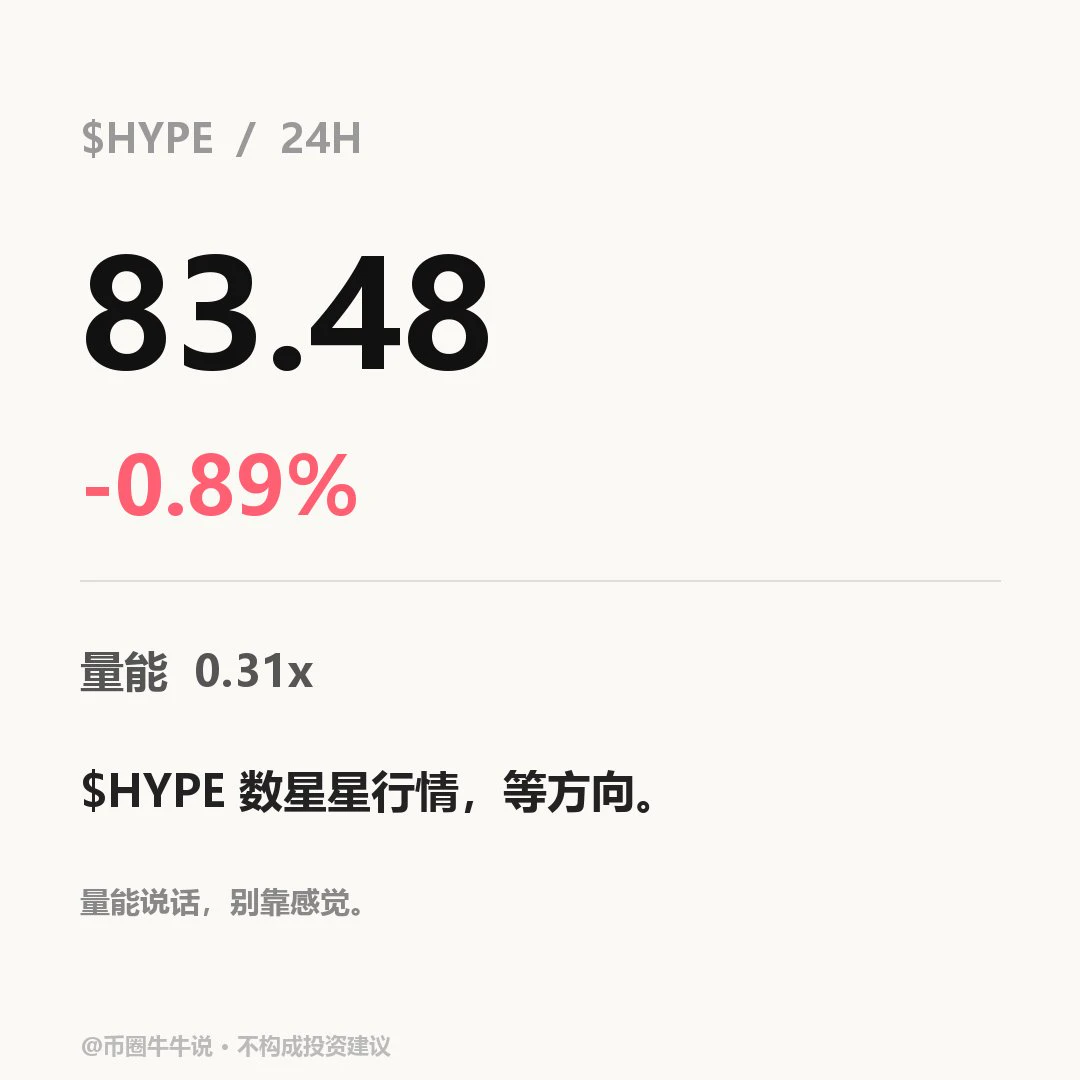
$HYPE Currently trading at 83.476, down 0.89% over 24H (82.775–88.861). The 1H outlook is weak: RSI is 29.51, and the current price is below the 1H EMA20 at 84.29. The 4H outlook is weak: RSI is 48.16, and the current price is below the 4H EMA20 at 84.97. The 1H volume ratio is 0.31, indicating insufficient participation. If the price holds above the 88.861 resistance level, watch for continued movement; if it breaks below the 82.775 support level, the short-term outlook may weaken. In the next review, check whether the price can hold above 88.861 and recover after losing 82.775. The volume ra
post-image
HYPE+0.24%
#CFDGlobalAssetsDual
📊 ROUND 6: TWO CFD LEADERBOARDS, ONE COMPETITION — CAN REWARDS REACH 10,000 USDT?
🔍 WHAT HAS CHANGED THIS ROUND?
Earlier competitions often focused attention on a single performance target. Round 6 takes a different approach by separating performance into two independent leaderboards: one measures trading profits, while the other measures total trading volume.
The difference matters. A trader who focuses on profitable results has a different objective from someone whose activity is measured by trading volume. This competition recognizes both categories separately, with
post-image
NAS100-0.07%
US500-0.44%
USDJPY-0.31%
EURUSD+0.06%
XAGUSD+0.84%
Load More

Join 40 M users in our growing community

⚡️ Join 40 M users in the crypto craze discussion

💬 Engage with your favorite top creators

👍 See what interests you

Trending Topics

BTCBackAbove80K

28.32k Views41.18k Discussing

After a sharp dip, Bitcoin climbed back above $80,000 on May 9 and is currently trading around $80,200. Over 50,000 traders were liquidated in the past 24 hours amid fierce long-short battles. The recurring Iran-U.S. tensions remain the primary short-term variable. Following U.S. airstrikes, Iran\'s Revolutionary Guard claimed to have breached the Strait of Hormuz defense line, leaving the ceasefire outlook uncertain. On the technical side, the daily SMA20 ,$77,970 serves as key support, with the RSI recovering from oversold levels to 43. The $80,000 level is both a psychological barrier and a bull-bear dividing line.Holding above it could lead to a challenge at $85,000, while a break may trigger a retest of the $77,000 area.

DemocratsWinBothChambers

17.63k Views438 Discussing

GateLaunchesTaiwanStockTrading

14.77k Views302 Discussing

View More