Square
Following
Hot
News
Profile
Share your thoughts
placeholder
Article
#布局本周交易 #每周来晒 The weekend market is usually in a consolidation phase with relatively weak liquidity, making it suitable to focus on “defense + testing the market with light positions” to prepare for next week’s potential trend shift. Combining the current market conditions, fund flows, and macro expectations, the following are the weekend positioning ideas and next week’s market forecast:
I. Weekend Positioning Ideas (Defense-Oriented, Testing the Market with Light Positions)
1. Bitcoin (BTC): Range trading, combining defense with testing long positions
Testing longs at support: BTC has recent
post-image
ThisIsTranslateContent:
#布局本周交易 #每周来晒 The weekend market is usually in a consolidation phase with relatively weak liquidity, making it suitable to focus on “defense + light-position probing” to prepare for a potential market shift next week. Based on current market conditions, capital flows, and macro expectations, the following are weekend positioning ideas and next week’s market forecast:
I. Weekend Positioning Ideas (Defense First, Light-Position Probing)
1. Bitcoin (BTC): Range trading, combining defense with cautious long positions
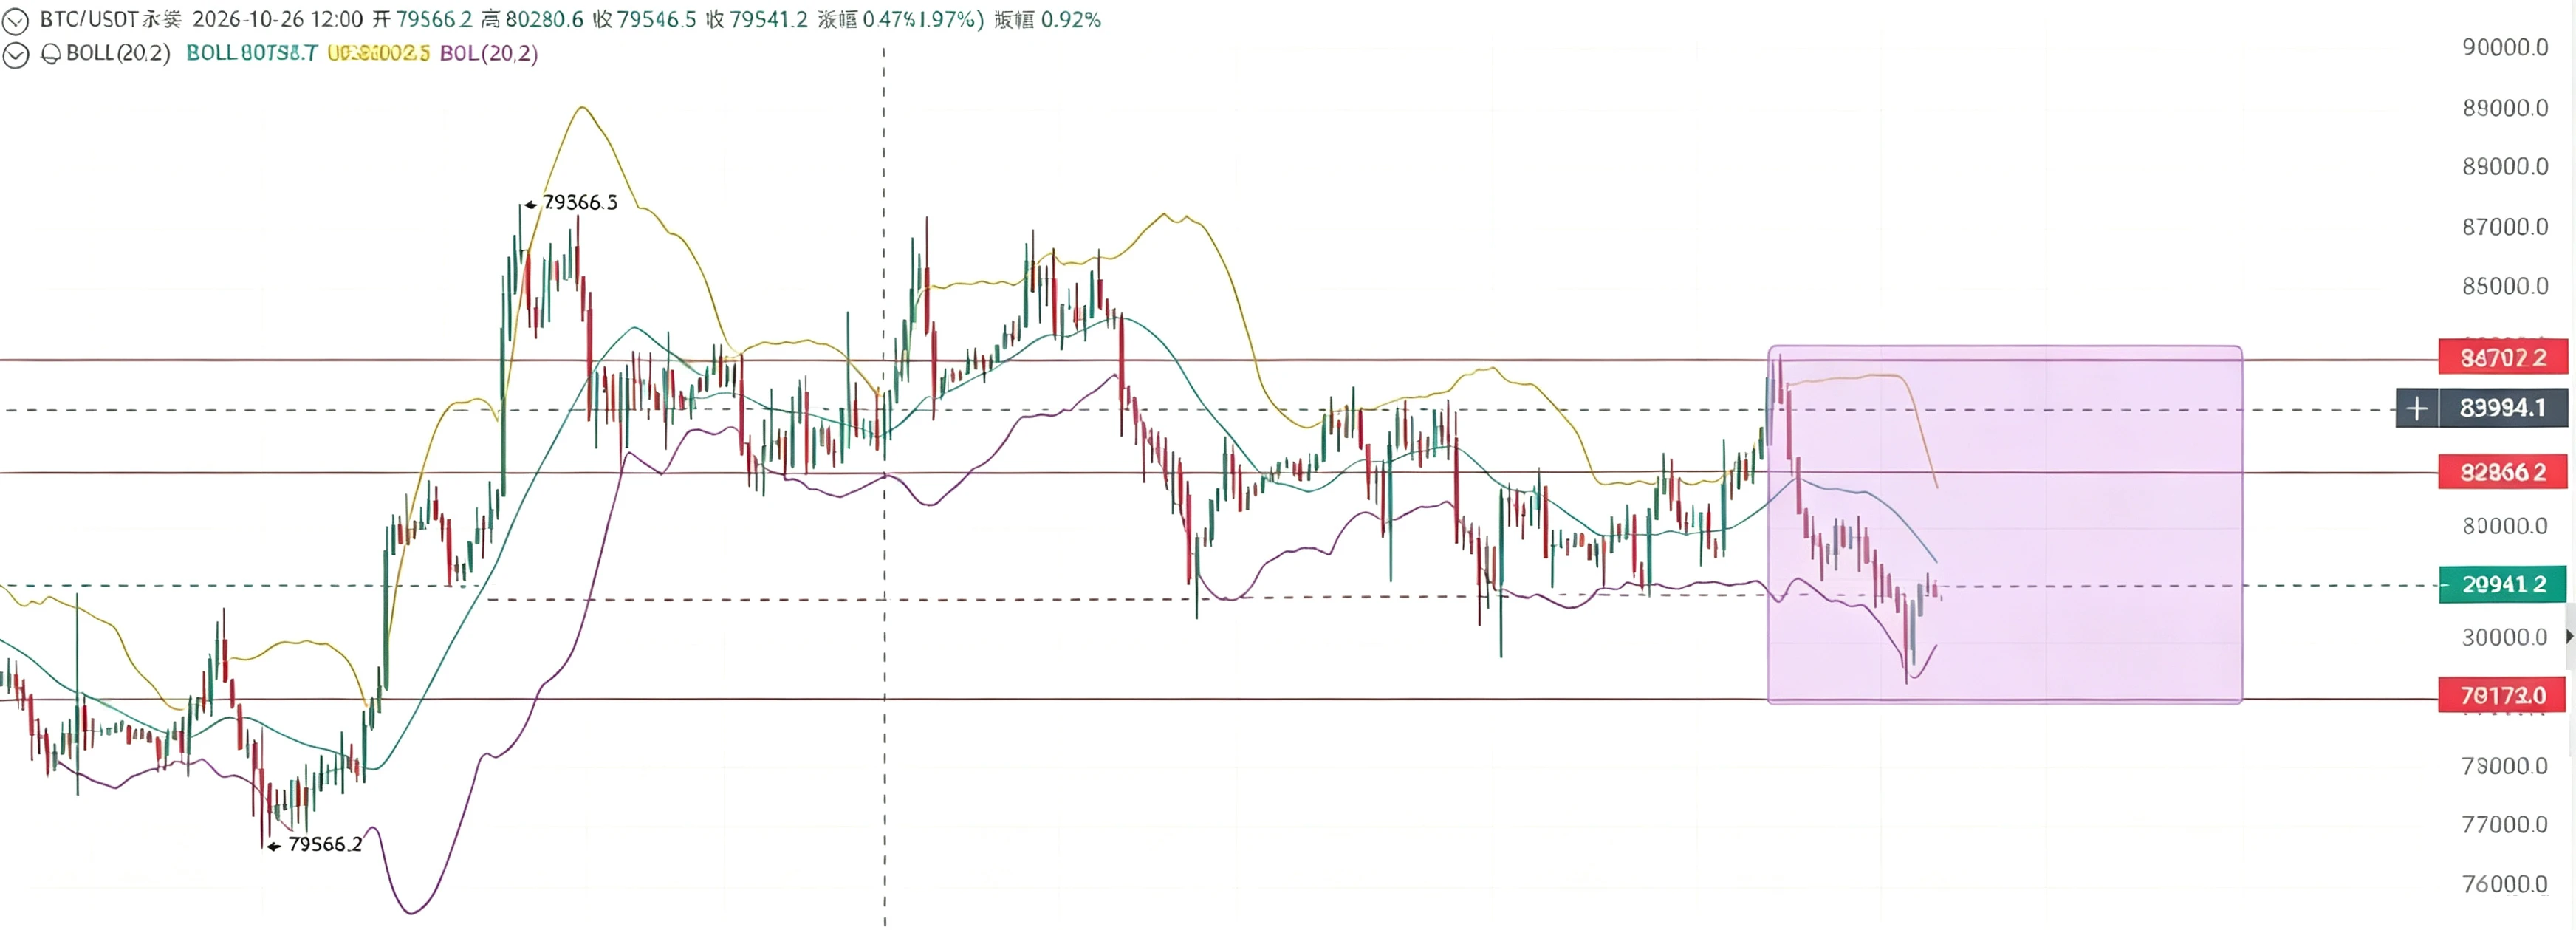
Long entry at support: BTC has recently been fluctuating narrowly in the $82,000-$83,000 range, while the 50-day moving average (approximately $80,400-$81,000) is an important medium-term support level. If BTC stabilizes after pulling back to $82,300-$82,500, consider cautiously opening a light long position, targeting $83,500, with a strict stop-loss set (such as below $82,000).
Sell into resistance: If BTC rebounds to the $83,000-$83,500 range and encounters resistance, consider partially reducing positions or selling into strength; do not chase the rally.
2. Ethereum (ETH): Weak in the short term; primarily stay on the sidelines
Cautious long entry: ETH has recently underperformed BTC (the ETH/BTC exchange rate hit a new low, while ETF outflows continue), so blindly increasing ETH positions is not recommended in the short term. If ETH stabilizes after pulling back to $2,470-$2,480, consider cautiously opening a light long position, targeting $2,530, with a stop-loss at $2,450.
Stay on the sidelines: If ETH encounters resistance after rebounding above $2,530, wait for a clearer stabilization signal.
3. Altcoins: Trade with light positions and exit quickly, whether for profit or loss. II. Next Week’s Market Forecast (Watch the Macro Market-Shift Window)
1. Market-shift window: Macro data and capital flows
Macro data (key): The US September PPI data will be released next Tuesday (October 14), and the Federal Reserve FOMC meeting minutes will be released next Wednesday (October 15). These two data releases will directly affect market expectations for the Federal Reserve’s rate-hike path and are important windows for a market shift next week.
Capital flows: Continue monitoring the US government’s BTC transfers (if large amounts continue to flow into exchanges, short-term selling pressure may persist) and outflows from ETH ETFs.
2. Market Direction Forecast
Bullish scenario: If macro data (PPI) shows that inflation continues to cool and the FOMC minutes send a dovish signal, short-term market pressure will ease. BTC may hold the $80,400 support level and move upward to test $83,500 or even higher.
Bearish scenario: If macro data rebounds above expectations or government selling pressure continues to intensify, BTC may retest the $80,400 support level. If it breaks below that level decisively, the medium-term trend will need to be reassessed.
Over the weekend, focus on controlling position sizes, maintaining a defensive stance, and probing with light positions. Wait for next week’s macro data to be released before making directional decisions on adding positions.
repost-content-media
BTC+0.75%
ETH+1.02%
Which one of those #Memecoins will you never sell, no matter what #_____🚀
post-image
Everyone is sleeping on SYMBOL while the 1h RSI whispers something dangerous.

$SOL /USDT - LONG

Trade Plan:
Entry: 110.32 – 110.66
SL: 108.85
TP1: 111.72
TP2: 112.54
TP3: 113.77

Why this setup?
Why now? The daily trend is bullish and the 1h ATR of 0.684327 shows the volatility is just starting to expand. The 15m RSI sitting at 34.25 proves the short term is oversold enough to catch a rebound. Entry is locked between 110.32 and 110.66 with the reference price at 110.49, giving a precise risk controlled spot. The first target sits at 111.72 and the second target is 112.54, but the trade di
SOL+0.81%
Last night, BTC rose first and then fell, stopping after climbing to around 84,200 at its peak before beginning another downward move. It fell to around 83,200 this morning at its lowest, marking nearly 1,000 points of one-way decline. It has now recovered to around 83,600 and is fluctuating.
From the market structure, the 83,000 level has been tested several times and quickly reclaimed, indicating buying support below this level and initial signs of a short-term bottom. The 84,000–85,000 area above is currently the zone with the densest concentration of recent positions, forming a core resist
post-image
BTC+0.77%
$STRK PUMPED 456%
THE TEAM WANTS TO MAKE IT A L1 AND THE FIRST QUANTUM PROOF L1.
This is still a proposal under consideration, not a finalized decision or governance-approved plan
Interesting times already. Bears still think we are in a bear market...
post-image
STRK+12.70%
( new streamer) marketoverview
live-cover
LIVE645
$LUMIA : Two timeframes are in conflict; the key is not guessing the direction
$LUMIA 24 hours +20.74%, current price 0.1246. On the surface, this is merely a rise or fall, but the real conflict is hidden in the timeframes: the 1-hour chart is weak, while the 4-hour chart is strong. When the two charts give opposite answers, the least useful thing to do is pick the chart you prefer and believe it completely.
The opposing view also has clear invalidation levels. A break below the 1-hour support at 0.1015 would show that short-term buying support has failed its test; if the 4-hour support at 0.07
post-image
LUMIA+19.99%
Selling Activity From Bitcoin Miners Is Decreasing
The selling pressure from $BTC miners has dropped, which indicates that they prefer to hold their bitcoins rather than sell.
post-image
BTC+0.75%
Market View for the week.
US OIL
XAUUSD
GBPCAD
EURNZD
UK 100
Let's goo 🏂💙
post-image
Top 15 Altcoins That Attracted Users This Week: Who's Leading?
Solana is pulling ahead of BNB Chain and Tron in weekly active users, according to fresh data.
Solana recorded 15.9 million weekly active users, a 56.3% increase over the previous period.
⚠️ Personal market analysis only. NFA — manage risk and DYOR.
Educational content, not investment advice or a recommendation to buy, sell, deposit, or withdraw any asset. No paid promotion or referral/affiliate links.
post-image
SOL+0.73%
BNB+0.35%
TRX-0.21%
#SimpleEarnUSDTLimitedTime11%APR
GATE IDLE EARN: WHY SMART CAPITAL MANAGEMENT MATTERS WHEN THE CRYPTO MARKET TURNS UNCERTAIN
A volatile crypto market creates a difficult decision for investors: should you deploy capital immediately, or wait for a clearer opportunity? Sometimes, the best move is not entering another trade but managing your available funds more efficiently.
Gate's latest Idle Earn and Simple Earn promotion introduces an opportunity for eligible users to explore potential returns on idle USDT, with advertised rates reaching 4% and 5% APR through qualifying Idle Earn tiers and up
BTC+0.75%
ETH+1.02%
GT+1.28%
$AVAX The higher it rises, the more people fear missing out, but what is truly lacking at elevated levels is not hype, but support when it pulls back.
This time, I’m not looking at the gainers and losers list, only the levels. The current price is 10.939, about 6.83% from the 1-hour support at 10.192 and about 0.56% from the resistance at 11.
My criteria are simple: only a breakout above 11 followed by continuation would count as follow-through higher; a break below 10.192 invalidates the original view. The 1-hour and 4-hour trends are both strong, with RSI at 84 and 72, respectively.
The deba
post-image
AVAX+5.45%
🐋 WHALE WATCH : Every time they tell you crypto is slowing down Saylor drops a chart update and reminds everyone what institutional accumulation actually looks like.
=> 848000+ $BTC locked in the vault
=> Zero intention of stopping
=> Theres always room for more orange.
The supply shock is coming for everyone who thinks they have all the time in the world. Position accordingly.
BTC+0.75%
$FET FETUSDT: Bullish Setup Toward $0.508, Invalid Below $0.204
FET is consolidating around $0.23 after its recent advance. The chart outlines a possible pullback before another move higher, with $0.508 marked as a potential target.
The bullish scenario is invalidated below $0.2041. This is a technical scenario, not a guaranteed outcome or financial advice.
post-image
FET+6.38%
🔹 Robinhoods on-chain activity cools down: Daily active users down 31 from mid-September, DEX tradi
live-cover
LIVE16
Bitcoin hedge funds face liquidation trap when collateral is split across markets
A profitable hedge fund can still get liquidated on one exchange because the profit sitting on another exchange is out of reach.
Here's the setup: Bitcoin falls, the fund's short position on CME is in the black, and its matching long on Hyperliquid is bleeding cash. The two positions were designed to cancel each other out, but Hyperliquid can't see or use the profits held at CME to cover the loss on its own books. The fund has to find additional collateral before the exchange closes the position for it.
⚠️ Person
post-image
BTC+0.77%
HYPE+1.18%
$APT The most important thing to watch is not whether the price rises or falls, but whether participation has kept up after the price moved.
This time, I’m not looking at the gainers and losers ranking—only the key levels. The current price is 0.9009, approximately 7.05% above the 1-hour support at 0.8374 and approximately 7.17% below the resistance at 0.9655.
My criteria are simple: only a breakout above 0.9655 followed by continued strength would count as an upside continuation; a break below 0.8374 invalidates the previous view. The 1-hour and 4-hour trends are both strong, with RSI at 70 a
post-image
APT+4.31%
$SPY $Q
🦇 Market Maestro | The AI Bull Market Is Entering Its Fifth Year
The S&P 500’s current bull market began on October 12, 2022, based on its closing low. I entered in November 2022. We made the real money through 2025 amid all the shouting about recession and crisis. So tomorrow, we enter its fifth year. The index’s approximately 118.4% price gain through the October 9 close is a strong performance, but it does not by itself indicate that the cycle is nearing its end.
History tells us longer cycles are possible. The 1987-2000 bull market, which included the dot com boom, lasted approxi
post-image
Insiders are fading the bullish trend on $NEAR /USDT right now.

$NEAR /USDT - SHORT

Trade Plan:
Entry: 5.7767 – 5.8363
SL: 6.1785
TP1: 5.5275
TP2: 5.3415
TP3: 5.0625

Why this setup?
Why now? The daily trend remains bullish, yet the 1h price is pinned at 5.8065, creating a contradiction that favors a short. The 15m RSI reading of 64.08 shows the bounce lacks momentum, while the 1h ATR of 0.119238 confirms the move is volatile enough to target 5.5275 and 5.3415. The entry zone between 5.7767 and 5.8363 offers a precise setup, and the invalidation level at 5.1940 is the line in the sand tha
NEAR+9.60%
$TRX TRX | Wave C Points At The Flip Zone Below
By analyzing the TRX (TRON) chart on the Daily timeframe, we can see a market that broke its bullish structure in June and has spent four months building a corrective pattern that is now close to its final leg.
━━━━━━━━━━━━━━━━━━━━
DAILY TIMEFRAME
━━━━━━━━━━━━━━━━━━━━
The uptrend. The move began with the MSS in February and was confirmed by two BOS events through March and April, carrying price from $0.2700 to the May high at $0.3760.
The break. That ended in June. The CHoCH near $0.3200 took out the structure that had held the entire advance — t
post-image
TRX-0.21%
Load More

Join 40 M users in our growing community

⚡️ Join 40 M users in the crypto craze discussion

💬 Engage with your favorite top creators

👍 See what interests you

Trending Topics

GateAtTOKEN2049

41.5k Views21.87k Discussing

Gate brought a series of major events to TOKEN2049 Singapore! From the official launch of Gate Money to the F1 Red Bull driver meet-and-greet and the Gate Gala, we witnessed a new chapter of "One Gate, Borderless Finance." Which moment from TOKEN2049 stood out most to you?

LedgerLossesNear90Million

39.56k Views303 Discussing

GateWCTCS9GlobalTradingCompetition

34.67k Views5.17k Discussing

View More