Share your thoughts
placeholder
Article
🚀 20x leverage secured 590% returns, $CLO this short was incredibly precise!
As an Ethereum-compatible smart contract chain, CLO has recently seen on-chain activity decline 30% and significant capital outflows amid delays to the mainnet upgrade and a wave of ecosystem project migrations. The short thesis is closely tied to the dual drivers of “technological stagnation + liquidity withdrawal,” rather than being purely sentiment-driven.
The current price is 0.09792, below the previous low of 0.105. The MACD green bars continue to expand, while the RSI is not oversold, indicating strong short-t
CLO-8.46%
ETH-0.13%
🚨 JUST IN: Sam Bankman-Fried asks the U.S. Supreme Court to overturn his fraud conviction. 🇺🇸
OpenCode-Go: For the next three days, we will give everyone 4x ds-4.1 quota😆
CommandCode-GOAT: For the next seven days, we will give 6x quota🥹
post-image
4-6.71%
GOAT-4.64%
today crypto live markets updates
live-cover
LIVE341
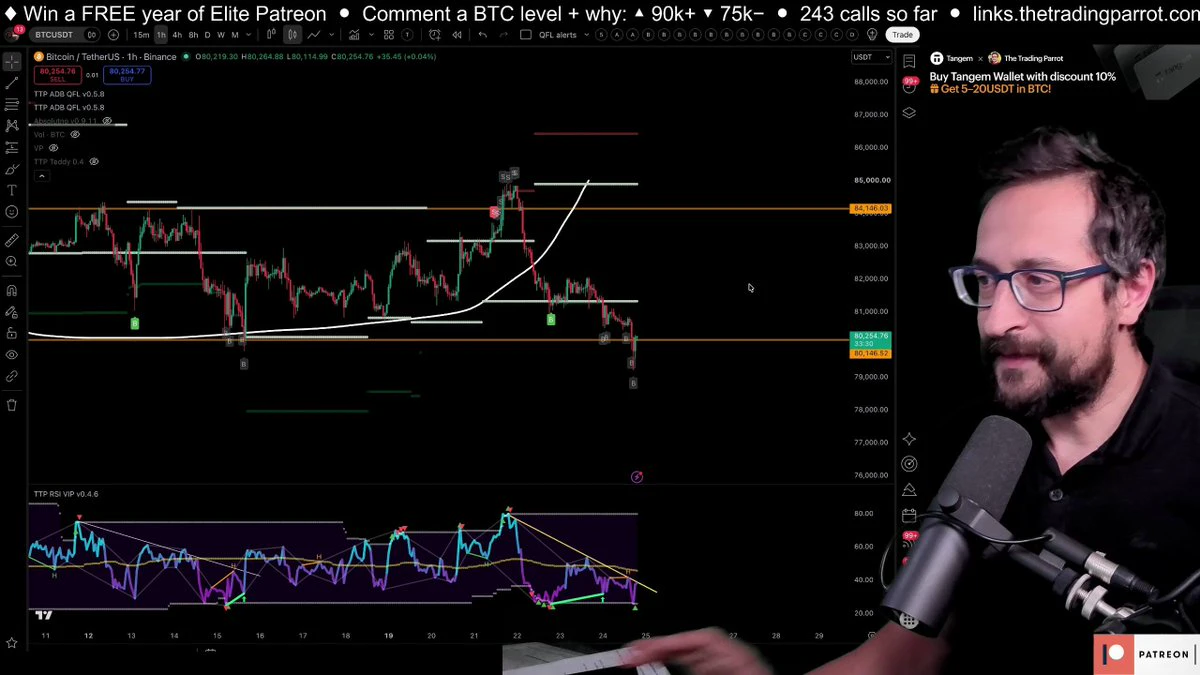
Some of the cleanest channel-bound price action you will ever have the pleasure to witness
And yet some will have misplayed it
By turning bullish at resistance
And bearish at support
$BTC
post-image
BTC-1.19%
Insiders are calling this the exact reversal setup SYMBOL needs.

$SUI /USDT - LONG

Trade Plan:
Entry: 0.7390 – 0.7460
SL: 0.6989
TP1: 0.7752
TP2: 0.7970
TP3: 0.8298

Why this setup?
Why now? The daily trend is bearish, but the 1h RSI at 27.37 shows extreme oversold conditions, signaling a potential exhaustion of sellers. The 1h ATR of 0.013983 confirms enough volatility is present for a decisive move, while the 4h setup points to a structured LONG entry near 0.7425 within the 0.7390 to 0.7460 zone. The first target of 0.7752 is within reach, but the real test is pushing toward 0.7970 befo
SUI-5.42%
I had just switched the app to the background when it suddenly shot up, which honestly caught me a bit off guard. A few days ago before bed, I was watching the chart form a bottom. The key level held, and buying pressure was gradually building, so I issued a long signal around 0.4775.
Today, I looked back at the market and $PONS had already climbed to 0.5748, with floating profit at +401.1%. We clearly caught the rhythm. Staying up wasn't for nothing—the kind of move that wears people down first and then delivers is the easiest way to wreck their mindset.
Those already on board, don't rush to
post-image
PONS-8.42%
SNDK-4.05%
ADA-1.92%
Getting liquidated on a futures contract isn't scary—just switch tracks and keep moving. On one side, a candlestick waterfall; on the other, taking orders on Meituan😮‍💨$MU$SNDK
post-image
MU-4.62%
SNDK-4.01%
LDO pump pump bigpump ath
post-image
LDO-1.38%
PUMP-11.05%
BIGPUMP-5.45%
$SAGA $STONKBROKER
【Application Chain Expansion × On-Chain Trading Desk】
SAGA: This move looks more like infrastructure rotation amplified by low-level liquidity. Saga’s core is to split applications onto independent Chainlets, allowing developers to use dedicated blockspace for scenarios such as gaming and DeFi; Pegasus further incorporates staking and shared security into the mainnet architecture. Going forward, what is truly worth tracking is whether Chainlet deployments and application usage can generate sustained demand. The current price is 0.017637 USDT, up 20.21% in 24H, with trading
post-image
SAGA+18.27%
Why is everyone suddenly eyeing $SLX /USDT for a short setup?

$SLX /USDT - SHORT

Trade Plan:
Entry: 0.06676 – 0.06732
SL: 0.06972
TP1: 0.06503
TP2: 0.06369
TP3: 0.06167

Why this setup?
Why now? The 1h price is sitting at 0.06704, right inside the entry zone between 0.06676 and 0.06732, while the daily trend is range-bound, giving us a clean mean-reversion backdrop. The 15m RSI is 48.74, meaning momentum is neutral and not overbought, so we are not chasing a move. The 1h ATR is 0.001118, which sets realistic price waves and shows this is not a low-volatility trap. The first target is 0.06
SLX-1.37%
Ethereum 2473 precisely shorted
Secured 20 points of profit🥩
ETH-0.13%
Insiders are watching $SLX /USDT like a short squeeze is about to collapse.

$SLX /USDT - SHORT

Trade Plan:
Entry: 0.06684 – 0.06742
SL: 0.06994
TP1: 0.06502
TP2: 0.06362
TP3: 0.06151

Why this setup?
Why now? The 1h price sits at 0.06713, right on the entry_ref line, giving us a precise short setup. The 1h ATR of 0.001171 shows the hourly move is small enough to target a clean 1R+ exit. The 15m RSI at 45.08 confirms bearish momentum without oversold exhaustion. The daily trend being range means we expect mean reversion down from this level, not a breakout up. The invalidation level at 0.0
SLX-1.37%
What are the most underrated project on #Solana right now?
post-image
SOL-2.25%
  • 3
Everyone is missing the obvious bearish setup forming on $SKYAI /USDT right now.

$SKYAI /USDT - SHORT

Trade Plan:
Entry: 0.05083 – 0.05145
SL: 0.05412
TP1: 0.04890
TP2: 0.04741
TP3: 0.04518

Why this setup?
Why now? The daily trend is bearish with the 1h price at 0.05114, placing us inside a high-confidence short entry zone. The 15m RSI sitting at 52.56 shows neither overbought nor oversold, meaning momentum is neutral and ready to follow the lower timeframe trend. The 1h ATR of 0.001242 confirms volatility is compressed enough for a decisive move. We target TP1 at 0.04890 and TP2 at 0.04
SKYAI-9.25%
Smart money is quietly building a massive SHORT on SYMBOL while retail sleeps.

$LAPTOP /USDT - SHORT

Trade Plan:
Entry: N/A – N/A
SL: N/A
TP1: N/A
TP2: N/A
TP3: N/A

Why this setup?
Why now? The 1d trend is range, which often precedes explosive moves once a direction is chosen. With a confidence score of 55.4, the bias is clearly SHORT but not overbought on conviction. The 15m RSI is null, meaning there is no overbought signal to trap the shorts yet. The 1h ATR is null, so volatility has not expanded to confirm a breakdown. The entry zone is N/A, keeping position sizing undefined until pr
post-image
LAPTOP-55.93%
$CASHCAT
Daily looking good to scoop some up here after retrace💯😸
post-image
CASHCAT+3.53%
By the time I got back from the restroom, the candlestick chart had already wiped out my losses for me.
When I checked $ETH just after lunch, it had returned to around 1883.20. After several pullbacks failed to break through, with each key level higher than the last, I placed a long order. By the time I got back, the current price had reached 2461.92, with unrealized gains of +5341.23%. The wait was worth it.
I took 80% in profit first and moved the stop-loss on the remaining 20% above the entry price. If it keeps surging, I’ll hold it; if it comes back, I won’t give back the profits.
Experts
post-image
ETH-0.13%
DOGE-3.03%
SOL-2.20%
BTC and ETH Move Inside a Tight Range! Which Side Could Break First?
live-cover
LIVE1,271
Everyone is sleeping on SYMBOL while the 4h setup screams otherwise.

$SOL /USDT - LONG

Trade Plan:
Entry: 99.50 – 100.06
SL: 96.34
TP1: 102.36
TP2: 104.08
TP3: 106.66

Why this setup?
Why now? The daily trend is range, which means the market is coiling for a decisive move, and the 1h ATR at 1.10 shows volatility is expanding just as the 15m RSI sits at 36.13, signaling room for upside before overbought. The entry zone between 99.50 and 100.06 aligns with the 1h price of 99.79, giving a precise reference of 99.78 for a controlled long. TP1 at 102.36 and TP2 at 104.08 offer two clear target
post-image
SOL-2.20%
Load More

Join 40 M users in our growing community

⚡️ Join 40 M users in the crypto craze discussion

💬 Engage with your favorite top creators

👍 See what interests you