Square
Following
Hot
News
Notifications
Profile
Share your thoughts
placeholder
Article
CRYPTO MARKET UPDATE
live-cover
LIVE78
$GT ‌ Sideways Bearish The price is at 9.67. Both the MA10 and MA30 are weakening, while the MACD indicates growing bearish momentum. Resistance: 9.70–9.75 Support: 9.60 and 9.51 Conclusion: $GT has the potential to continue its decline toward 9.60 if selling pressure persists. A breakout above 9.75 would open the door for a rebound.

Note: Crypto and stock transactions carry the risk of loss. Please conduct your own research (DYOR) before trading. This information is for general purposes only and does not constitute a solicitation, recommendation, or investment advice. You are solely respons
post-image
GT-2.24%
Trenches
ZIG
Z
bade
b
ZIG
0x8c...1145
Market Cap
$.
Change
.
24h Vol
$.
Holders
.
BTC
B
bade
b
BTC
C5xp...pump
Market Cap
$.
Change
.
24h Vol
$.
Holders
.
STONK
S
bade
b
STONK
6GmA...UNgx
Market Cap
$.
Change
.
24h Vol
$.
Holders
.
IDOL
I
bade
b
IDOL
0x3b...ab07
Market Cap
$.
Change
.
24h Vol
$.
Holders
.
scamsem
s
bade
b
scamsem
41Wp...pump
Market Cap
$.
Change
.
24h Vol
$.
Holders
.
📊 How long have you guys been active on X?
What challenges are you facing?
I’ll go first: My niche isn’t clearly defined, so my conversion rate is too low.
Share what’s been troubling you in the comments. Stop by each other’s pages and see if you can find some inspiration for a solution.
​
Everyone’s welcome to comment—great content deserves to be seen by more people! 🚀
post-image
🎁 5,000 USDT in rewards up for grabs—the 2️⃣ 6️⃣ Growth Points Lottery is now underway!
Spend 300 Growth Points per draw, up to 10 draws a day. Everyone wins, and new users don’t need any trading volume! 🤩

💫 Interact every day and earn Growth Points with ease
🔹 Explore Square: post, like, comment, and share to earn up to +600 per day
🔹 Watch livestreams: watch, schedule, like, comment, and share to earn up to +300 per day
🔹 Join Hot Chats: take part in discussions and share trading cards to earn up to +90 per day
🔹 Creator bonus: publish content featuring designated tokens or trading c
GateSquare
🎁 5,000 USDT in rewards up for grabs—the 2️⃣ 6️⃣ Growth Points Lottery is now underway!
Spend 300 Growth Points per draw, up to 10 draws a day. Everyone wins, and new users don’t need any trading volume! 🤩

💫 Interact every day and earn Growth Points with ease
🔹 Explore Square: post, like, comment, and share to earn up to +600 per day
🔹 Watch livestreams: watch, schedule, like, comment, and share to earn up to +300 per day
🔹 Join Hot Chats: take part in discussions and share trading cards to earn up to +90 per day
🔹 Creator bonus: publish content featuring designated tokens or trading cards to earn up to +300 per task

Unlock SPCX tokens, a Gate tri-fold keyboard, and multiple high-value coupons!

Draw now 👉️ https://www.gate.com/activities/pointprize?now_period=26
$BTC $ETH $TSLA

repost-content-media
SPCX+0.78%
BTC-0.67%
ETH-1.26%
TSLA+4.26%
I just entered a short (sell) trade on $SWARMS
Stop loss: 0.00779 Take-profit targets: 0.00670 - 0.00665 - 0.00643 Start trading here 👇👇👇👇👇👇
post-image
SWARMS-3.61%
Not even the s&p can keep this floater down
post-image
SPX+0.33%
  • 1
$GTC A large -10% bearish candle slammed the price down to 0.1643, just 0.0001 above the 24-hour low. This isn’t a pullback; the bulls’ defense line is being ground into the dirt.
Breaking down the technicals: from 0.1864 to 0.1643, the day’s range exceeded 13%, with a trading value of 20.3M—a high-volume decline, not a low-volume shakeout. The candle closed near its low, showing that selling pressure had not been fully absorbed by the end of the session—a classic bearish-control structure. The 0.1659 level is an awkward spot: above, 0.1720 is neckline resistance for today’s continuation of th
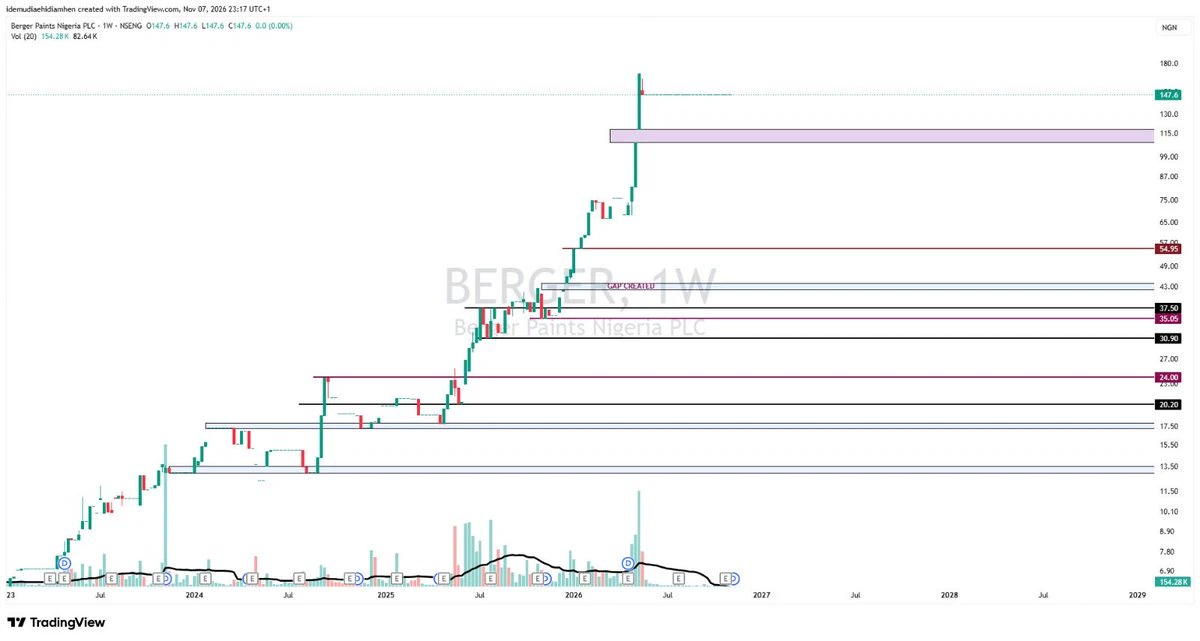
BERGER
If BERGER doesn’t give me a proper correction, I’m sitting this one out. And even if you want to open a position at these levels, with how thinly the stock trades, you might have to go to Mecca before you get your order filled. 😂
I’d like management to consider a bonus issue to put more shares in circulation. It could help with liquidity if more shareholders make shares available for trading. With so few shares changing hands, the stock can go flat for stretches.
The level I’m watching is ₦66.15 per share. CAP Plc is my benchmark for the sector, and I’ve noticed that CAP and BERGER ten
post-image
The real power brokers in the climate policy game have never been at the ballot box. The agenda laid out in 1985 has carried through to today, with NGOs as the capillaries, tax-exempt funding as the blood, and feedback loops growing ever tighter. Ordinary people see only the emissions figures, not who’s making the rules. No need to jump to conclusions just yet—let’s see how things unfold.
post-image
$TUT /USDT RANGE FADE Sellers Testing Resistance

$TUT /USDT

Direction: SHORT

Entry: 0.0169700

Stop Loss: 0.0174889

Targets
TP1: 0.0165808
TP2: 0.0163214
TP3: 0.0159322

TUT has been chopping in a wide range after the sharp mid-week drop, with price now sitting right around MA7 (0.01703), MA25 (0.01707) and MA99 (0.01706) essentially glued to all three averages. This is a fade of the recent bounce attempt rather than a clean trend short.

$TUT ‌
TUT-1.66%
“My First 1 Million Came from ‘Not Trading’”
It sounds counterintuitive, but it’s true.
I used to place trades every day.
Two or three trades a day; I felt restless if I didn’t trade.
By the end of the year, I had hundreds of trades logged, but my account was still flat—or even at a loss.
The turning point was a very simple experiment.
I set a rule for myself:
A maximum of 4 trades a month. Once I’d made them, I waited until the next month.
The first month, I could barely stand it.
The market was moving, and I was watching; when an opportunity came, I counted my trades.
As a result, my account
post-image
BTC-0.65%
If you have no power or money but marry a beautiful wife,
then maybe this outcome was destined from the start.
Getting married is one thing; keeping her is another.
post-image
A Trading System Isn’t “Designed”—It’s “Found Through Filtering”

Step 1: Track your behavior for 30 days before settling on a system. Each day, note three things: when you have time to watch the charts, what signals make you itch to trade, and how much of a loss makes you uncomfortable. After 30 days, you’ll discover your “physiological parameters”—some people can only trade the Asian session, while others panic as soon as they hold a position overnight. Your system has to fit those parameters; otherwise, even the best strategy will be impossible to follow.

Step 2: Use elimination to narrow
BTC-0.65%
OpenAI CFO: Data center investments will not change due to the midterm elections.
live-cover
LIVE51
🚨 BITCOIN IS SETTING UP THE SAME TRAP THAT DESTROYED RETAIL IN 2018 AND 2022.

AND I BELIEVE THE NEXT MOVE COULD MAKE MILLIONAIRES.

Look at this chart.

2018: CRASH → RECOVERY → NEW ATH.

2022: CRASH → RECOVERY → NEW ATH.

2026: CRASH → RECOVERY → NEW ATH?

DIFFERENT YEARS. SAME MARKET PSYCHOLOGY.

First, Bitcoin collapses.

Retail panics.

Everyone screams that crypto is dead.

Then selling pressure starts disappearing.

$BTC slowly recovers.

But nobody believes it.

"Just another dead cat bounce."

Then Bitcoin breaks resistance.

The rally accelerates.

And suddenly the same people who w
post-image
BTC-0.67%
Crypto is all about contrarian thinking. Once everyone has exited, it can really take off. I’m still buying the dip
post-image
“From 200k to 58 million, he says: Only fools can walk away with the money”
I met a veteran a few years ago.
He wasn’t a genius—in fact, he was a bit slow to react and took a long time to think before placing an order.
He entered the market with 200k in capital and turned it into 58 million.
I asked him how, and he gave me a very plain answer:
“In this business, it’s not about who’s smarter. It’s about who trades less.”
I learned from him for a few years. He really only had four rules.
Beginners who follow them often lose less not because of better technique, but because they make fewer moves.
post-image
BTC-0.65%
ETH-1.23%
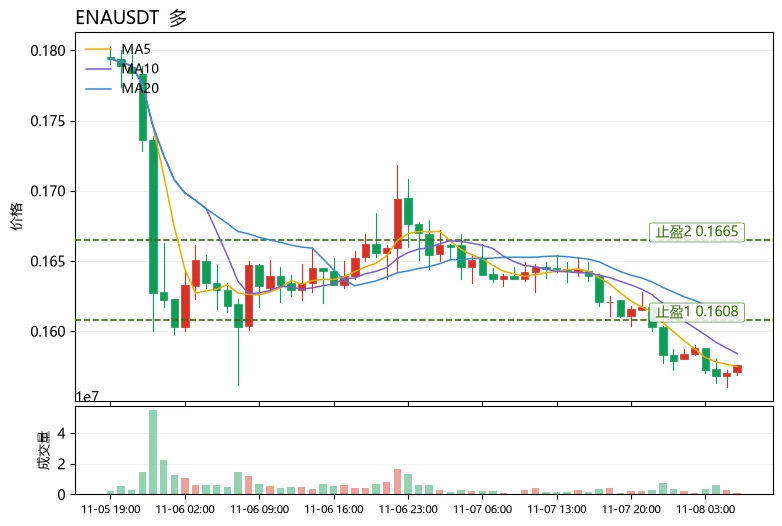
$ENA Current price is 0.1576, close to the lower Bollinger Band at 0.1552. MA5 (0.15748) remains below MA20 (0.160845), and the bearish alignment is intact. RSI at 31.5 is approaching oversold territory. The MACD histogram at -0.0002589 shows bearish momentum, but it is narrowing. The funding rate of +0.0050% indicates longs are still paying to hold positions, while the Fear & Greed Index at 25 is in the extreme fear zone. Structurally, this is a weak equilibrium near the end of a downtrend: the lower band at 0.1552 and oversold RSI form the first support; MA5 at 0.1575 is the short-term divi
post-image
ENA+8.04%
PEPE+0.97%
BNB-0.76%
Load More

Join 40 M users in our growing community

⚡️ Join 40 M users in the crypto craze discussion

💬 Engage with your favorite top creators

👍 See what interests you

Trending Topics

USAIStocksHitHard

21.44k Views3.68k Discussing

U.S. stocks sold off sharply on Thursday, November 5 (UTC). The Nasdaq closed down around 5.5%, entering correction territory, while the Philadelphia Semiconductor Index plunged roughly 12%, with chip stocks including $NVDA and $AMD posting steep losses. Beyond profit-taking, investors are growing concerned about the pace of AI data center construction, capital spending, and future returns on investment. The key question now is whether the AI sector’s lofty growth expectations need to be repriced. Where do you think the next opportunities will emerge: chip stocks, tech giants, or other sectors?

USNonfarmPayrolls

35.66k Views4.35k Discussing

StakeOnLaunchpoolToShare450KVLX

10.5k Views831 Discussing

View More