Share your thoughts
placeholder
Article
A pregnant women’s gathering arranged by a friend.
Curious who the child’s father actually is.
post-image
The hand that set the stop-loss a few days ago trembled slightly; this morning, I realized that was unnecessary filial piety. The last thing I saw before bed was $PENGU struggling to rebound, with every push upward falling just short—a typical lack of buying support. Without any hesitation, I placed a short order and entered at 0.009680. Looking again today, it had already reached 0.008813, +699.65%. The market specializes in humbling all kinds of defiance, especially a reckless fool like me who thought it would shoot to the moon. I won't claim a huge profit, but I handled this small swing per
post-image
PENGU+1.92%
DOGE+4.43%
SOL+3.92%
Today Crypto Markets News
live-cover
LIVE1,517
Only one of these prints in 2026.
$TAO at $1,000
or
$ONDO at $5
One is a supply squeeze on decentralized AI.
The other is a fee switch on tokenized Treasuries.
Both are real. Only one gets there first.
Pick one. Defend it in one line.
post-image
TAO+0.24%
ONDO+2.70%
Don’t get carried away when you’re in profit, and don’t despair over a drawdown. At this level, those who haven’t gotten on board yet shouldn’t rush—chasing shorts could easily leave you trapped midway through the decline. I’ll share the next opportunity as soon as it comes. Staying out of the market isn’t a sin; opening positions recklessly is the real mistake. Wait for the next shot—don’t act rashly.

$ZEC $BNB
post-image
ZEC+16.79%
BNB+1.40%
I originally just wanted to freeload a breakfast, but the market ended up serving me six months’ worth of dumplings. I had my eye on this $HYPE long when the pullback held, but it was still grinding around that afternoon a few days ago, so I waited until confirmation before entering. Since I dared to take the trade, I wasn’t afraid it wouldn’t give me any meat. I stayed in throughout the repeated intraday swings, stuck around the entry price for half a day, and was almost shaken sick. But what happened? The market is won by waiting, and profits are made by holding. This move directly cashed in
post-image
HYPE+3.80%
BNB+1.40%
ZEC+16.79%

Everyone’s chasing SNDK longs while the 4H quietly prints a 77% short setup.

$SNDK /USDT - SHORT

Trade Plan:
Entry: 1788.46 – 1792.50
SL: 1815.68
TP1: 1771.58
TP2: 1758.98
TP3: 1740.07

Why this setup?
- 1D is stuck in a range, but 4H momentum is cracking—RSI 15m at 67.46 is fading into resistance.
- Entry zone 1790.48 is a magnet; TP1 at 1771.58 is only 1% away, but TP2 at 1758.98 is where the real air pocket opens.
- ATR 1h at 8.07 means fast moves—why wait for a breakout when the range top is rejecting?

Debate:
If you had 77% confidence on a short, would you fade this 1790 spike
SNDK+1.50%
I just switched the software to the background, and it shot right back up—are you playing hide-and-seek with me? 🙃
Before bed, my last look at $BZ showed it still grinding back and forth around 87.28, refusing to break the key level, while volume was slowly recovering. To be honest, I hesitated then about whether to reduce my position, but later I figured it out: building a base tests people the most. Only by holding your position can you wait for the market to move.
Looking again today, it’s at 96.67, already up +903.57%. The wait was worth it.
Don’t drag your feet on position management: ta
post-image
BZ+0.62%
BNB+1.40%
SOL+3.92%
💰 France faces a staggering $9.4B crypto tax gap, yet only $368M has been reported for 2024! Why are so many crypto traders avoiding taxes? 🤔 #CryptoTax $BTC $ETH
BTC+0.31%
ETH+1.86%
$1000 to $100,000 Crypto Trade Challenge Today
live-cover
LIVE1,446
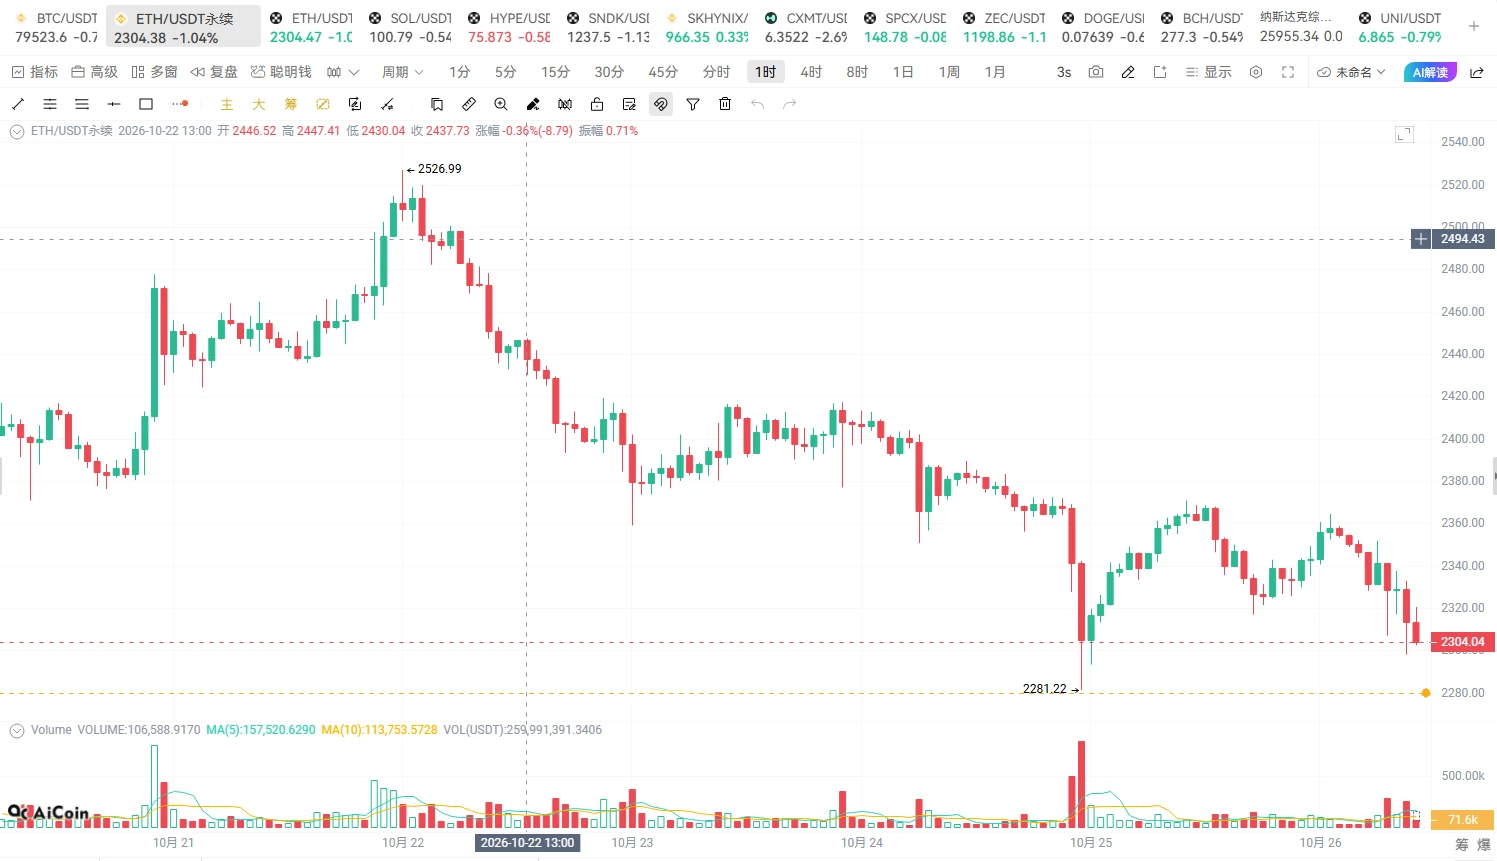
Everyone’s staring at ETH’s 2500 pivot—but the 4h chart just whispered a secret the crowd missed.

ETH/USDT - SHORT

Trade Plan:
Entry: 2497.5 – 2502.9
SL: 2525.7
TP1: 2481.1
TP2: 2468.3
TP3: 2449.2

Why this setup?
- RSI 15m at 52.31 = zero momentum, just noise before the drop.
- ATR 1h at 10.6 shows volatility is compressing—breakouts sting.
- 1D trend is range, but our SHORT bias (55%) targets 2481 first, then 2468.
- Why now? Price is stalling under 2502.9 resistance while SL sits safely at 2525.7.

Debate:
Are we front-running a fake breakdown to 2468, or is this the calm before
ETH+1.86%
SUSHI went from 0.2003 to 0.2828 in just one day, with a 21% range. But note that the volume on the dump from the high was more than twice the volume at the start of the rally. There is only one explanation for this order book: pushing the price up to rotate positions, with the cost basis around 0.23 and trapped holders all the way above. Look at the $150 million trading volume—retail traders don't have that kind of appetite; it's all wash trading to make you buy in.
Don't panic. There is weekly support at 0.2475 now. If you're aggressive, enter with a small position, set a stop-loss at 0.2310
SUSHI+22.89%
JUST IN: A single address labeled "Big Brother Ma Ji" holds about $146M in BTC/ETH longs with ~15.95x leverage, and ~$9.14M NAV. Significant liquidation risks loom on ETH BTC longs if volatility spikes. $BTC $ETH
post-image
BTC+0.30%
ETH+1.83%
Everyone’s chasing the next 100x—but ESPORTS just flashed a signal that quietly kills leveraged longs.

$ESPORTS /USDT - SHORT

Trade Plan:
Entry: 0.01460 – 0.01466
SL: 0.01496
TP1: 0.01438
TP2: 0.01421
TP3: 0.01396

Why this setup?
- 4h bias is SHORT with 95% confidence—that’s not a whisper, that’s a scream.
- Daily trend: bearish. The 1D structure is already bowing down; we’re just riding the follow-through.
- Entry zone locked at 0.01463, with TP1 at 0.01438 and TP2 at 0.01421—that’s a clean 3% drop before you even blink.
- RSI on 15m sits at 45, still room to fall before hitting o
ESPORTS-1.28%
This move is so clear, I don’t even need to think—the account is dancing on its own.

The last thing I saw before bed a few days ago, $SOL was still moving sideways at the bottom, with buying pressure gradually strengthening—a clear sign it was building momentum. I figured the risk at this level was limited, so I placed my position there, set a stop-loss, and went straight to sleep.

Then I woke up this morning to find the price had shot straight to 106.55. From 84.84, the paper gain is +2380.4%.

Feels great, but don’t be greedy for the last bite. I took profit on 80% first, moved the rem
post-image
SOL+3.92%
ZEC+16.79%
ETH+1.83%
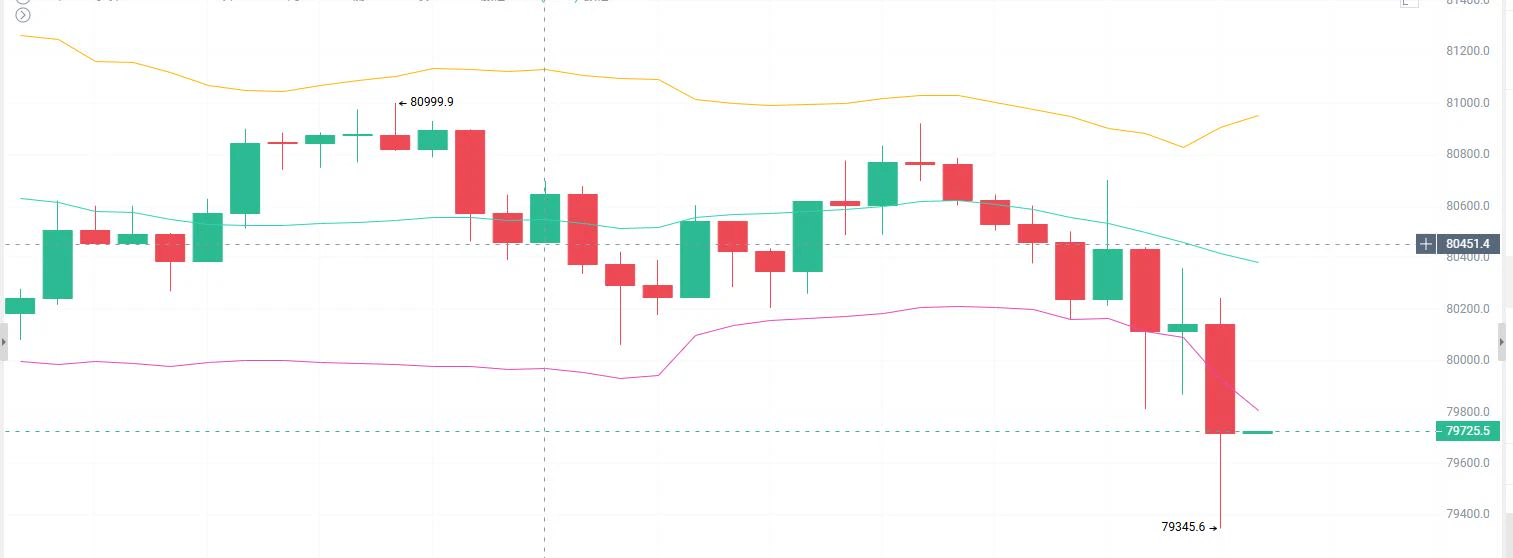
The year-end Bitcoin target price given by major global financial institutions and top AI models has reached $95,000–$150,000 per coin, while Ethereum’s target is $3,175–$4,500 per coin; patiently hold spot #BTC收复8万美元
TradingKingGaoYuliang
Core Logical Reasoning
Driver 1: Macroeconomic Monetary Environment (the Biggest Short-Term Variable)
• Current Headwind: The probability of a rate hike in September has risen to 62%, while the rate cut previously expected by the market has yet to materialize. The Fed’s dot plot shows rates at around 3.25%–3.40% by the end of 2026, but CME FedWatch pricing puts the probability of a rate cut this year below 10%.
• Key Timing: The September FOMC meeting (mid-to-late September) is the short-term watershed moment. If a rate hike is implemented, BTC could fall to $72,000–$75,000 in the short term; if the Fed unexpectedly pauses, the Q4 rally could begin immediately.
• Powell’s Term: His term expires in May 2026. Changes in the Fed’s leadership will bring policy uncertainty, but the market has gradually priced this in.
Driver 2: ETF Fund Flows (Structural Support)
• Pressure in the First Half: Spot BTC ETFs saw monthly net outflows of $4.06 billion in June, the largest redemption record since their launch, directly causing BTC to fall from $110,000+ to the July low of $59,000.
• A Turning Point in August: Over the past 60 days, Bitcoin whales have accumulated approximately $2.75 billion, while ETFs turned back to net inflows in late August (exceeding $1 billion in a single week). Exchange balances continue to decline, with investors shifting to cold storage, indicating that selling pressure is drying up.
• Solid Cumulative Base: Cumulative net inflows into spot BTC ETFs remain at approximately $55 billion, with total assets under management of around $109 billion. This is the biggest difference between this cycle and previous ones—institutional capital is already in the market rather than waiting on the sidelines.
Driver 3: Cycle Position (Deeply Corrected)
• BTC’s maximum decline in the first half of 2026 was approximately 30% (from $111,000 at the beginning of the year to $59,000 in July), and its current price of $80,000 is in the middle of a rebound.
• Historically, in post-halving cycles (the April 2024 halving), the second Q4 often sees a second wave of gains due to reduced miner selling pressure and an institutional allocation window.
• However, it should be noted that this cycle is more institutionalized, so volatility may be smoothed out, making a repeat of the multi-fold gains seen in 2021 unlikely.
Driver 4: Ethereum’s Independent Logic
• ETH/BTC Exchange Rate: Currently around 0.031, it is in a historically low range. If risk appetite recovers in Q4, ETH typically has greater upside elasticity.
• Stablecoins and Tokenization: Standard Chartered raised its year-end ETH target from $4,000 in June to $7,500, primarily because the growth in network utility driven by stablecoin issuance and asset tokenization has not yet been reflected in the price.
• Yield Characteristics: ETH staking provides an annualized yield of approximately 3%–4%, making ETH more attractive than BTC as an “interest-bearing asset” in a falling-rate environment.
• Risk: Spot ETH ETF inflows remain consistently weaker than those of BTC. If this trend continues, ETH may continue to underperform.
IV. Key Indicators to Watch (Tracked Over the Next 3 Months)
1. September FOMC Decision: Rate hike vs. pause will determine the direction of Q4’s opening
2. Weekly Net Inflows into Spot BTC ETFs: Three consecutive weeks of positive inflows = confirmation of a bottom
3. Whether BTC Can Hold Above $85,000: This is the 200-day moving average level; holding above it would open up room toward $100,000
4. ETH/BTC Exchange Rate: A break above 0.035 = a signal that ETH is beginning to outperform
5. U.S. Inflation Data: If CPI continues to decline, rate-cut expectations will heat up again#美国8月非农超预期
BTC+0.31%
ETH+1.86%
💰 Don’t let great content earn only likes! Have you activated Gate Social Subscription?
Post analysis on the Square or discuss market trends in livestreams—both can be set as subscriber-only content!
Market reviews, trading strategies, market insights… Share deeper content with subscribers while building a core following!
🔥 Set your own price, with 0% deducted from subscription revenue!
Activate now: https://www.gate.com/post
📖 Learn more: https://www.gate.com/help/community-center/moments/23369
September 6 Evening Strategy Plan
Priorities listed, for followers only
Today's trading priorities
Priority 1: Buy the dip long at 2494-2496
Most practical at present.
Around 2500, bulls and bears are battling; if the pullback to 2494-2496 holds, bulls still have the upper hand.
Priority 2: Buy the deep pullback long at 2488-2492
Best risk-reward.
The level is lower and the stop-loss is clearer, but it may not be reached.
Priority 3: Buy the breakout pullback long at 2524
Suitable for strong market conditions.
Must wait for a firm 15-minute hold or a pullback confirmation; do not chase higher
post-image
ETH+1.83%
Opportunities remain, be patient.

$XRP $ADA
post-image
XRP+0.91%
ADA+3.38%
#交易机器人 , come copy-trade me. I only used 5x leverage but achieved average daily returns of around 20%.
post-image
Load More

Join 40 M users in our growing community

⚡️ Join 40 M users in the crypto craze discussion

💬 Engage with your favorite top creators

👍 See what interests you

View More