Square
Following
Hot
News
Profile
Share your thoughts
placeholder
Article
$BAT Short-term bias remains bullish, but the market has entered a high-risk zone for chasing highs. Wait for a pullback that holds before entering.
Technical breakdown: MA5=0.2146 remains above MA20=0.192735, and the medium-term moving-average structure has not deteriorated. However, the current price of 0.2066 has fallen back below MA5, indicating that short-term momentum is weakening after the sharp 24h +22.54% rally. The MACD histogram at +0.002192 remains bullish and has not turned negative, with no signal of a trend reversal. RSI=60.1 is in a relatively strong but not overbought range, l
post-image
BAT+15.03%
SOL+3.00%
  • 1
That’s indeed quite tactfully put.😅
post-image
ETC faced clear resistance at 8.095 and has broken below the MA7 and MA25 support lines on the 15-minute chart. RSI(6) is 37.48, confirming weakening momentum. The short-term trend has turned downward, and it is expected to test the 7.850 support zone. Short now $ET !🐻
Entry range: 7.994 - 8.034Take-profit target 1: 7.624Take-profit target 2: 7.312Stop-loss: 8.275Trade here 👇👇👇Market overview: $SIRE : Current price 0.03494 - 24-hour change: +55.77%
$SKHYNIX : Current price 966.4 - 24-hour change: +2.09%
post-image
SKHYNIX+2.80%
#USSeptemberPPIBeatsExpectations 🚨 | U.S. Wholesale Inflation Surges — Markets Face a New Fed Test!
📅 October 16, 2026 | Macro Market Watch
Inflation pressure is heating up again in the United States. September’s Producer Price Index (PPI) came in significantly above expectations, delivering another warning that price increases are spreading through the economy.
📊 THE NUMBERS THAT MATTER
- 🔥 Monthly PPI: +1.3% versus +0.5% expected.
- 📈 Annual PPI: +6.3%, up from 5.6% in August.
- ⚡ Energy prices: +10.8% month over month.
- ⛽ Gasoline prices: +20.3% month over month.
- 🏭 Services prices
post-image
GAS+3.50%
BTC+1.10%
XAU+0.44%
INDEX+4.82%
  • 4
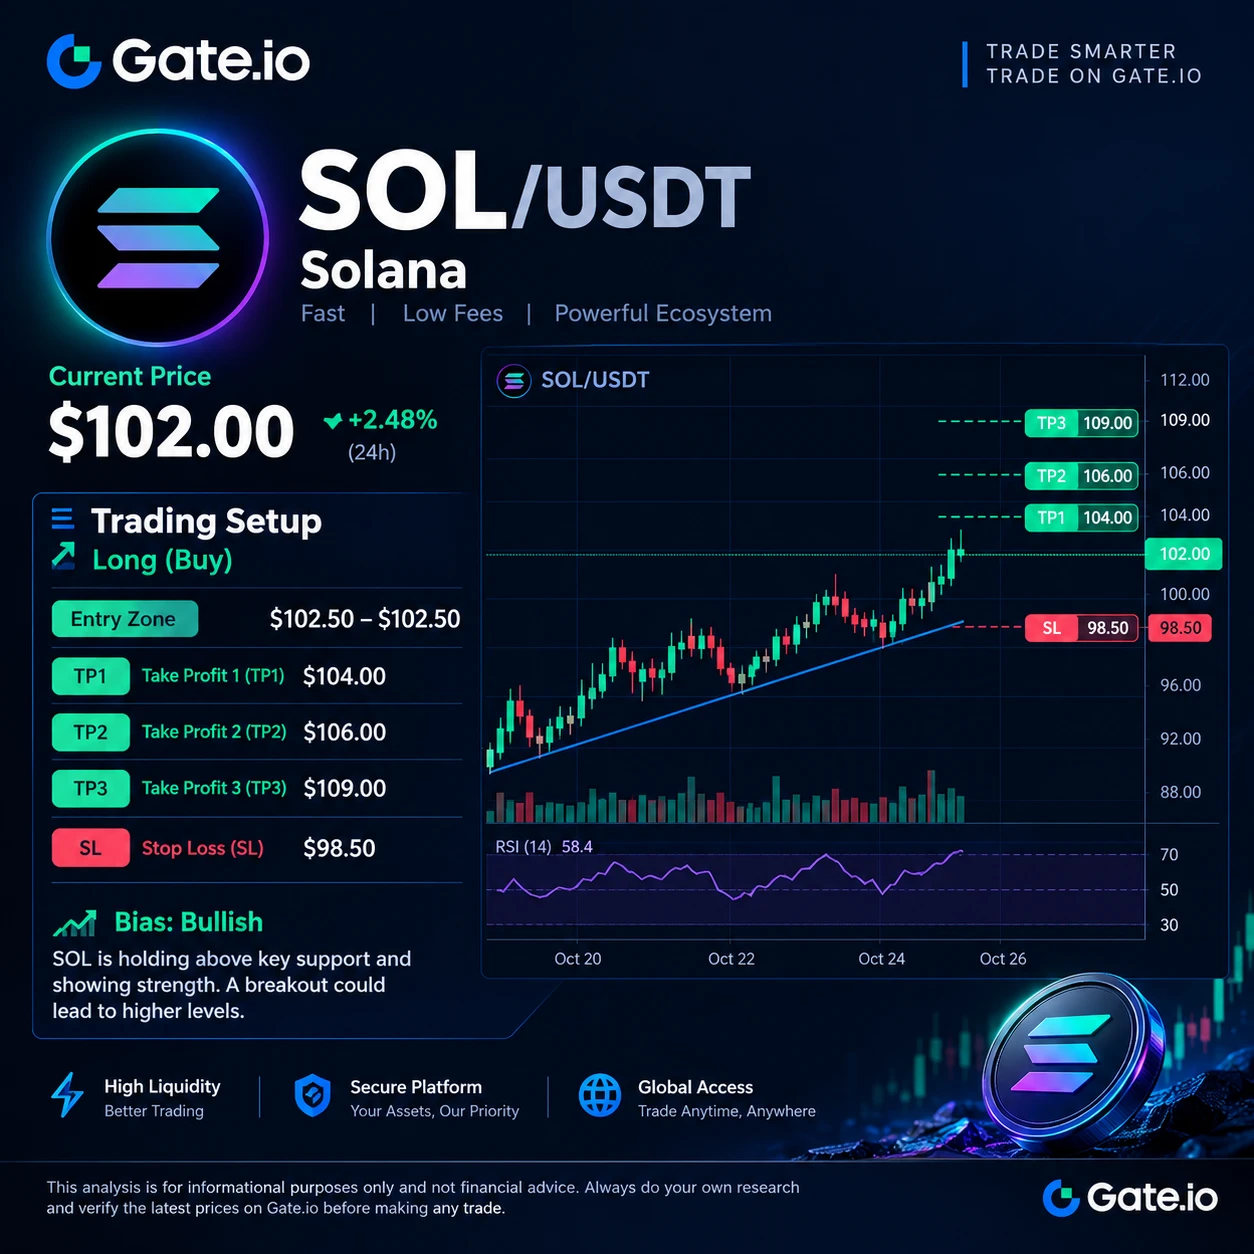
Yang Guang bit | October 16 $SOL Precision Strategy — Oversold rebound nearing resistance; two-way positioning with shorts at highs and longs at lows
【Today's Strategy】
Entry timing: Set up short positions on a rebound to 106.5–107.5; take short-term long positions on a pullback to 104.5–105.0
Stop-loss settings: Set stop-losses for short positions above 108.5 and for long positions below 103.5
Staggered take-profit:
Short target: 103.5–104.5
Long target: 106.0–106.5
【Core Conclusion】
After yesterday's CPI came in above expectations, SOL plunged to a low of 100.46, then rebounded on a recover
post-image
SOL+2.96%
US PPI rose 6.3% year-on-year in September, higher than the market expectation of 5.3%; it rose 1.3% month-on-month, also well above the expected 0.5%. Meanwhile, retail sales rose 0.8% month-on-month, also above expectations.
For BTC, short-term macro pressure is indeed increasing. However, weak data does not necessarily mean BTC will fall. The current macro environment is bearish, so caution is warranted regarding short-term wicks in BTC. Next, focus on whether the US dollar and Treasury yields continue to rise, and whether BTC's rebound has momentum. If macro pressure increases while BTC re
post-image
BTC+1.10%
  • 5
Whatever you do, don't touch $BTW unless you can accept losing a quarter in a single day.
I just cut this position. The current price is 1.8105, down 23.45% in 24 hours, plunging from 2.3998 all the way to 1.8008, while trading volume surged to 211.9M. This isn't a pullback; it's a stampede. I bought around 2.08, thinking it would break above the previous high at 2.39 and then pull back for confirmation. What confirmation? It confirmed straight into hell. During the two days I held it, my mindset could be summed up in one word: endure. Every time it bounced to around 2.1, I thought a V-shaped
BTW-13.69%
  • 2
#美国9月PPI大超预期 #美国9月CPI超预期 The Federal Reserve, Inflation, and Employment: How Ordinary People Can Understand U.S. Macroeconomic Indicators
Don’t confuse CPI, PCE, and PPI
CPI: Price changes on the consumer sideCPI, the Consumer Price Index, measures the average change in the prices of a basket of goods and services purchased by urban consumers, including food, housing, transportation, and medical care. Every household has a different consumption structure, so personal experiences and the index average may differ. The “core CPI” often mentioned in the news excludes food and energy. This does not
GLDX+0.44%
PAXG+0.35%
  • 5
Every $SNEK counts 🐍
post-image
SNEK+0.11%
#DrLinHanSpeaksAtOxfordUnion
I'll be honest, when I first saw this headline, I read it twice. A crypto exchange founder walking into one of the oldest debating halls in the world? That's not something you'd have imagined a decade ago. So I dug into the details, and here is what's actually confirmed so far.
Gate's founder and CEO, Dr. Han, has been invited to speak at The Oxford Union on November 12, between 15:30 and 16:30 UTC. The venue is on St Michael's Street in Oxford, UK. Worth remembering: the announcement came out in mid-October, so the talk hasn't happened yet. Right now, this is an
post-image
BTC UPDATE
live-cover
LIVE1,868
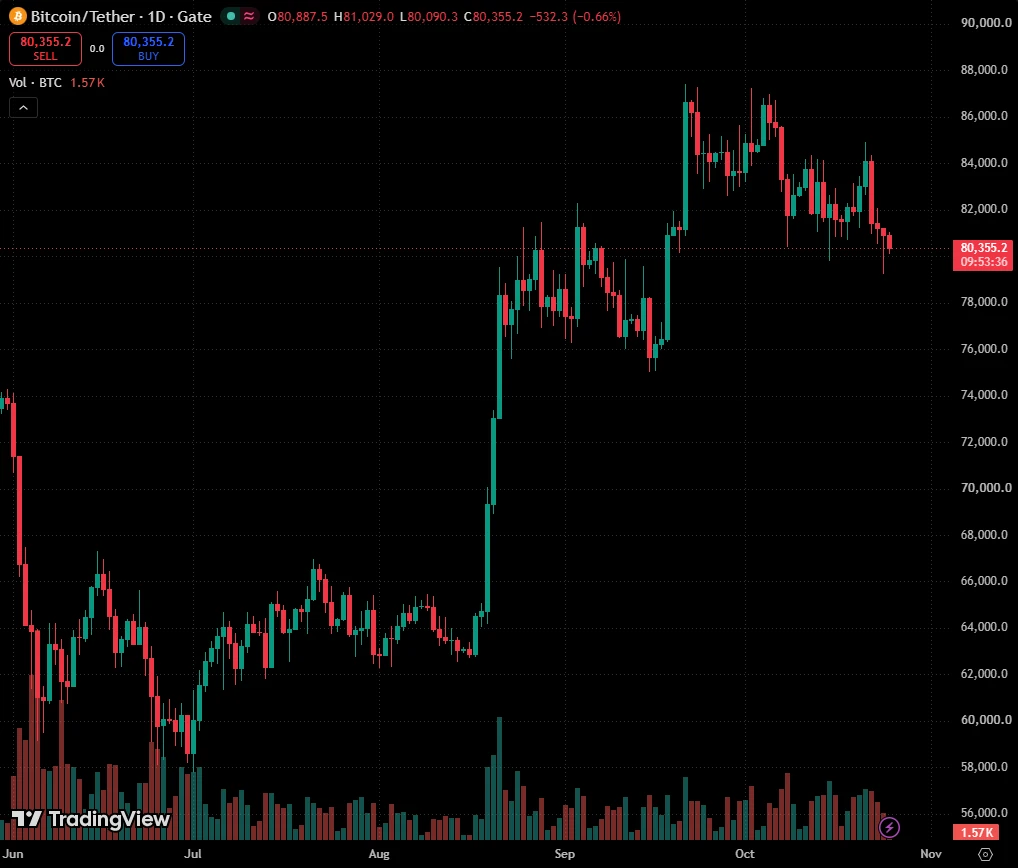
10.16 Friday morning market overview: BTC M-top correction complete
BTC formed a long lower wick and a small-bodied bullish candle this morning, with the market difficult to read
Last night, affected by the PPI data, BTC wicked down to 7.97, breaking below the previous low of 8 before this rebound;
After the data was released, total liquidations across the network over 1H reached $476 million, with long liquidations accounting for as much as $457 million, mainly concentrated in ETH and BTC
When news-driven moves quickly wick downward and then rebound, the purpose is to liquidate bo
post-image
BTC+1.15%
  • 9
Flying Tesla Roadster @ #ALM solana:DFMt2FyLpB6ekPNAzVErLXgpSnJ9CRf1VnxBAkTLpump
post-image
TSLAG+3.03%
SOL+3.00%
#美股 #Gate股票 #AnthropicTurnsProfitablebutGrowthSlows Semiconductors, and I lean bullish, but only with one eye on inflation. Here are my reasons, theme by theme, using the actual results that have come out this week.
1. SEMICONDUCTORS: THE STRONGEST THEME
$TSM delivered a very big quarter. Net income rose 68.7% from a year earlier to NT$763.06 billion, a record for the sixth straight quarter, and revenue rose 50.9%. In US dollars, revenue was $46.72 billion, up 41.2% year over year. The operating margin topped the 56% to 58% range the company guided for. The outlook also looks solid: fourth-qua
post-image
TSM-1.82%
ASML+0.52%
WFC+2.27%
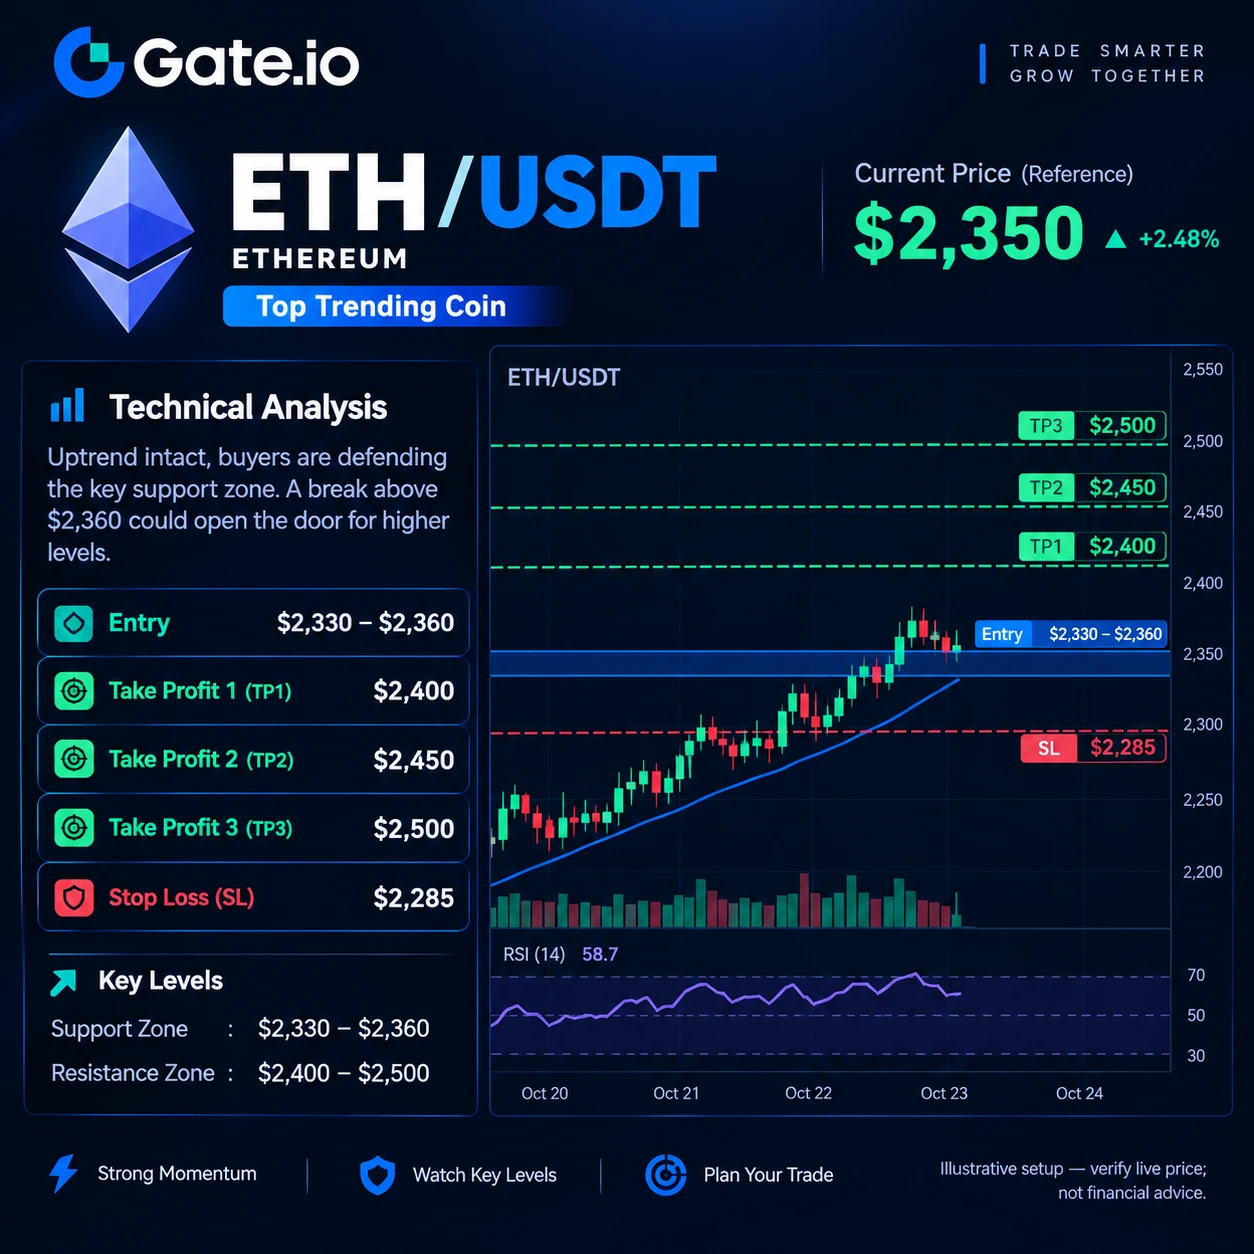
10.16 ETH public strategy
$ETH Short trade strategy
  Entry range: Enter a light short after a pullback and reclaim around the 2440-2460 middle band
  Stop-loss defense: Around 2480 (execute planB⬇️ after a breakout)
Take-profit levels
  First take-profit: Around 2420
  Second take-profit: Around 2400 (Bollinger Band middle line)
Third take-profit: Around 2380
Long-term target: Below 2360 (near the lower band)
Trading rationale: The Bollinger Bands are widening downward overall, and the bearish structure on the larger time frame has not changed. The current phase is a r
ETH+3.13%
#BTCBreaksBelow82K
🚨 BTC Breaks Below $82K — What’s Next?
Bitcoin has slipped under the key $82,000 level multiple times this week, putting the short-term structure under pressure.
Quick Snapshot
Recent range: $79,700 – $84,200
Current zone: hovering around $82,000 – $82,200
Major tests: dipped toward $80K on the back of hot inflation data
Why the Sell-Off?
Hotter-than-expected September CPI + strong PPI reignited rate-hike concerns
Rising Treasury yields & stronger USD
Spot BTC ETF outflows
Risk-off spillover from Asian markets
Heavy long liquidations
Key Levels to Watch
📌 $82,000 – $82,50
BTC+1.10%
  • 4
Yesterday I suggested buying XPL, and looking at today, it was almost exactly the bottom. After the PPI data came out and the bearish news was priced in, it immediately V-reversed. Still, pay attention to coins with discernible patterns. Keep following #美国9月PPI大超预期
XPL+10.26%
The overall market is tilted bullish, with most capital betting that ETH will hold above 2500.
However, there is insufficient certainty of a break above 2600, while the probability of a pullback to 2300 is close to 50%, indicating significant disagreement between bulls and bears over Ethereum, unlike the one-sided optimism seen in BTC.
The upside offers limited potential returns, while lower pullback levels offer better risk-reward; beware of the risk of a failed rally followed by a retracement to the 2300 range.
post-image
ETH+2.43%
BTC+1.10%
Live market update
live-cover
LIVE2,284
Load More

Join 40 M users in our growing community

⚡️ Join 40 M users in the crypto craze discussion

💬 Engage with your favorite top creators

👍 See what interests you

Trending Topics

USSeptemberPPIBeatsExpectations

91.35k Views1.9k Discussing

US September PPI came in at 6.3% YoY, well above the 5.3% market expectation, pointing to renewed producer-side inflation pressure. Weekly jobless claims were 199K, broadly in line with forecasts. Could hotter inflation further reduce room for rate cuts, and what does it mean for $BTC, US stocks, and gold?

GateWCTCS9GlobalTradingCompetition

37.87k Views6.4k Discussing

WarshIMFSpeech

62.4k Views744 Discussing

View More