







Square
Following
Hot
News
Profile
Share your thoughts
placeholder
Article
No talent? Then repeat!
Good morning, my world❤️
post-image
It’s been frozen solid since this morning. I forgot to take it out of the freezer.
post-image
What is the easiest trap to fall into in this $ENA rally?
When I looked at $ENA again, I first covered up the +5.97% over 24 hours. It’s not that this number is unimportant, but it is too good at grabbing attention. What really needs explaining now is that $ENA remains strong, while the crowding is already out in the open. I acknowledge that the trend is strong, but what matters next is not how much higher it can surge, but whether anyone steps in on the first pullback.
Laying out the market, the current price is 0.2075, with a 24-hour range of 0.1825–0.2079. The 1-hour support is at 0.1825 a
post-image
ENA+6.22%
10.16 BTC morning review:
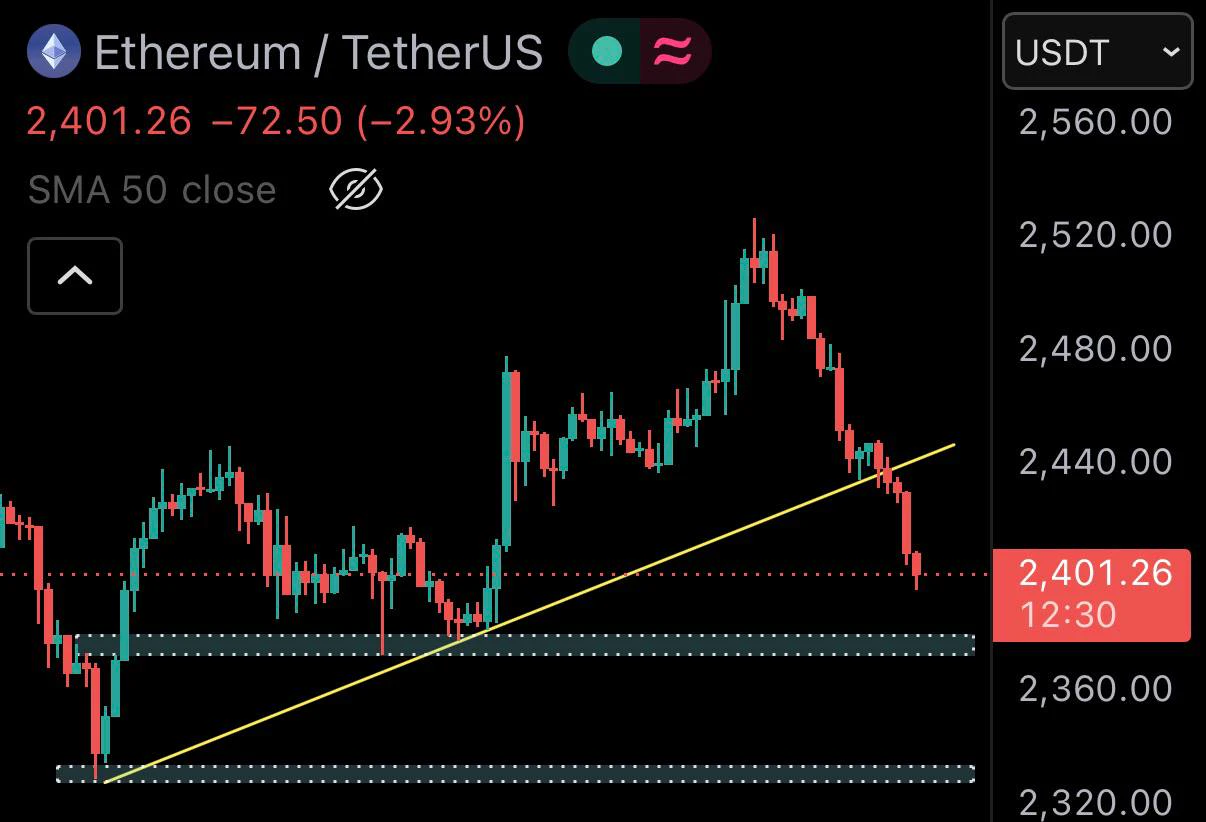
The current 4-hour chart shows a “big rise, short decline” oscillatory recovery pattern. Looking back, after yesterday’s wick broke below 80,000 and touched around 79,700 at the lowest, it rebounded; BTC is currently trading around the 82,200 level, while ETH is trading above 2,440. The 4-hour structure remains below the middle band, with the overall price in the middle-to-lower Bollinger Band region.
Resistance around 82500-83000, down to around 81500-80800
Resistance around 2460-2490, down to around 2420-2380
The above is solely a personal view and does not constitu
post-image
BTC+0.78%
ETH+0.71%
Layout: Bitcoin, Ethereum, Dogecoin
live-cover
LIVE880
  • 4
#BREAKING: MSCI is thinking about removing Indonesia from its Emerging Markets index and making it a "Standalone Market."
Why? They cited market dysfunction, concentrated shareholdings, and transparency issues.
A final decision will be made by June 2027.
post-image
MSCI+2.49%
ethereum:0x56a3ba04e95d34268a19b2a4474dc979babdaf76 long 🟢. I have high conviction for this one. More a swing trade.Eta Weekend. Scalable trade.
Stop: $0.0199
Target: $0.02755
7.2R planned · 10/10 checks
P. Acct risk: 10.00%
— DTT
post-image
ETH+0.71%
$US It goes up a little every day; even a little gain each day is good. Money-printing machine mode activated—earn a bit every day, a little every day
US-2.47%
To be honest, people’s heads can be pretty hard sometimes. Even getting hit on the head by a white ball this hard doesn’t do anything.
$ZEC
ZEC is currently in an oversold rebound phase, with short-term strength but no reversal in the medium-term trend yet.
Trend: The price has rebounded from 1,075 to around 1,221, moving above all short-term moving averages, but the medium-term moving averages remain bearishly aligned and the MACD death cross remains unresolved, indicating a rebound rather than a reversal.
Support levels: First support at 1,211~1,214; core support at 1,192~1,195; strong support at 1,075.
Resistance levels: First resistance at 1,253~1,254; key resistance at 1,270~1,285; strong resistance at 1,349.
In simple
post-image
ZEC+7.49%
I think this move in oil prices isn’t over yet, but now isn’t the time to chase the rally. Liquidity in the futures market is lowest in the early morning hours, which is also when sudden wicks are most likely. Technically, the previous high is near resistance. If the trendline holds on the pullback, there’s still a chance. Let’s wait until the weekend to see how it turns out, then compare notes. Those watching it, keep an eye on #CrudeOil.
post-image
$HYPE HYPE: Bullish Structure Faces Another Important Test
HYPE has pulled back sharply from its September all-time high at $97.99, with the subsequent rally failing at $95.22. Price has retraced almost 50% of its August–September advance, weakening short-term momentum.
The 100/50-day EMAs remain bullishly crossed, suggesting the broader recovery has not broken down. However, price is below the 100-day EMA and trading between the two averages.
HYPE is approaching the significant $75–$77 support zone, which has attracted buyers several times over the last four months. The 50-day EMA and 0.5 Fib
post-image
HYPE+1.54%
As long as you know how to read charts and recognize characters, you can learn technical analysis! How to identify support and resistance! How to sell high and buy low! $ETH ‌#美国9月PPI大超预期
ETH+0.70%
  • 1
Spam 🤷🏻‍♂️😁
post-image
🔥 $BAT
After breaking through the $0.2000 resistance zone, it has shown strong bullish momentum. The price has surged to around $0.2170, extending its strong upward trend, with buyers firmly in control of the market. If the bullish momentum continues, BAT may continue to rise and challenge higher resistance levels. 📈Take profit: 0.43614 Stop loss: 0.16556 Long $BAT 👇
post-image
BAT+22.57%
🌍 Payments in the future may become increasingly “invisible.”
Think about how technology has already changed our lives.
Information has become digital.
Communication has become instant.
More and more services have moved online.
And payments are undergoing the same transformation.
But the next stage may be more than just “digital payments.”
The real change may be:
Payments themselves gradually becoming something that no longer requires special attention.
In the future, we may no longer need to repeatedly consider:
Which country we are in.
Which platform we use.
Which payment methods merchants
post-image
Load More

Join 40 M users in our growing community

⚡️ Join 40 M users in the crypto craze discussion

💬 Engage with your favorite top creators

👍 See what interests you

Trending Topics

USSeptemberPPIBeatsExpectations

91.35k Views1.89k Discussing

US September PPI came in at 6.3% YoY, well above the 5.3% market expectation, pointing to renewed producer-side inflation pressure. Weekly jobless claims were 199K, broadly in line with forecasts. Could hotter inflation further reduce room for rate cuts, and what does it mean for $BTC, US stocks, and gold?

DrLinHanSpeaksAtOxfordUnion

135.63k Views1.86k Discussing

JapanAndKoreaStocksPlunge

47.27k Views1.76k Discussing

View More