Share crypto content and earn up to 60% commissions through content mining.
placeholder
gatefun
$PENGU – Price pushing higher on confirmed expansion
PENGU LONG
Entry: 0.006129 – 0.006137
Stop Loss: 0.006010
TP: 0.006182 - 0.006317 - 0.006402
PENGU2.99%
post-image
  • Reward
  • Comment
  • Repost
  • Share
Happy Qixi Festival 😘😘 A romantic rendezvous—see you at three, come what may.
View Original
post-image
  • Reward
  • Comment
  • Repost
  • Share
Good morning
My day is blessed and so is yours
Can I get a GM back
post-image
  • Reward
  • Comment
  • Repost
  • Share
#USD1FuturesZeroMakerFee
Zero maker fees on USD1 Futures can make a meaningful difference for active traders. By removing maker costs, traders can potentially improve execution efficiency, reduce overall trading expenses, and manage strategies with greater flexibility.
For high frequency traders, market makers, and users who frequently place limit orders, even small fee savings can become significant over time. Lower transaction costs can help traders focus more on liquidity, timing, risk management, and strategy execution rather than worrying about every additional fee.
USD1 Futures Zero Mak
USD10.00%
post-image
  • Reward
  • 3
  • Repost
  • Share
LittleGodOfWealthPlutus:
Wishing you prosperity and good luck! 😘
View More
Have a lovely meal on Qixi Festival😋😋😋
View Original
post-image
post-image
  • Reward
  • Comment
  • Repost
  • Share
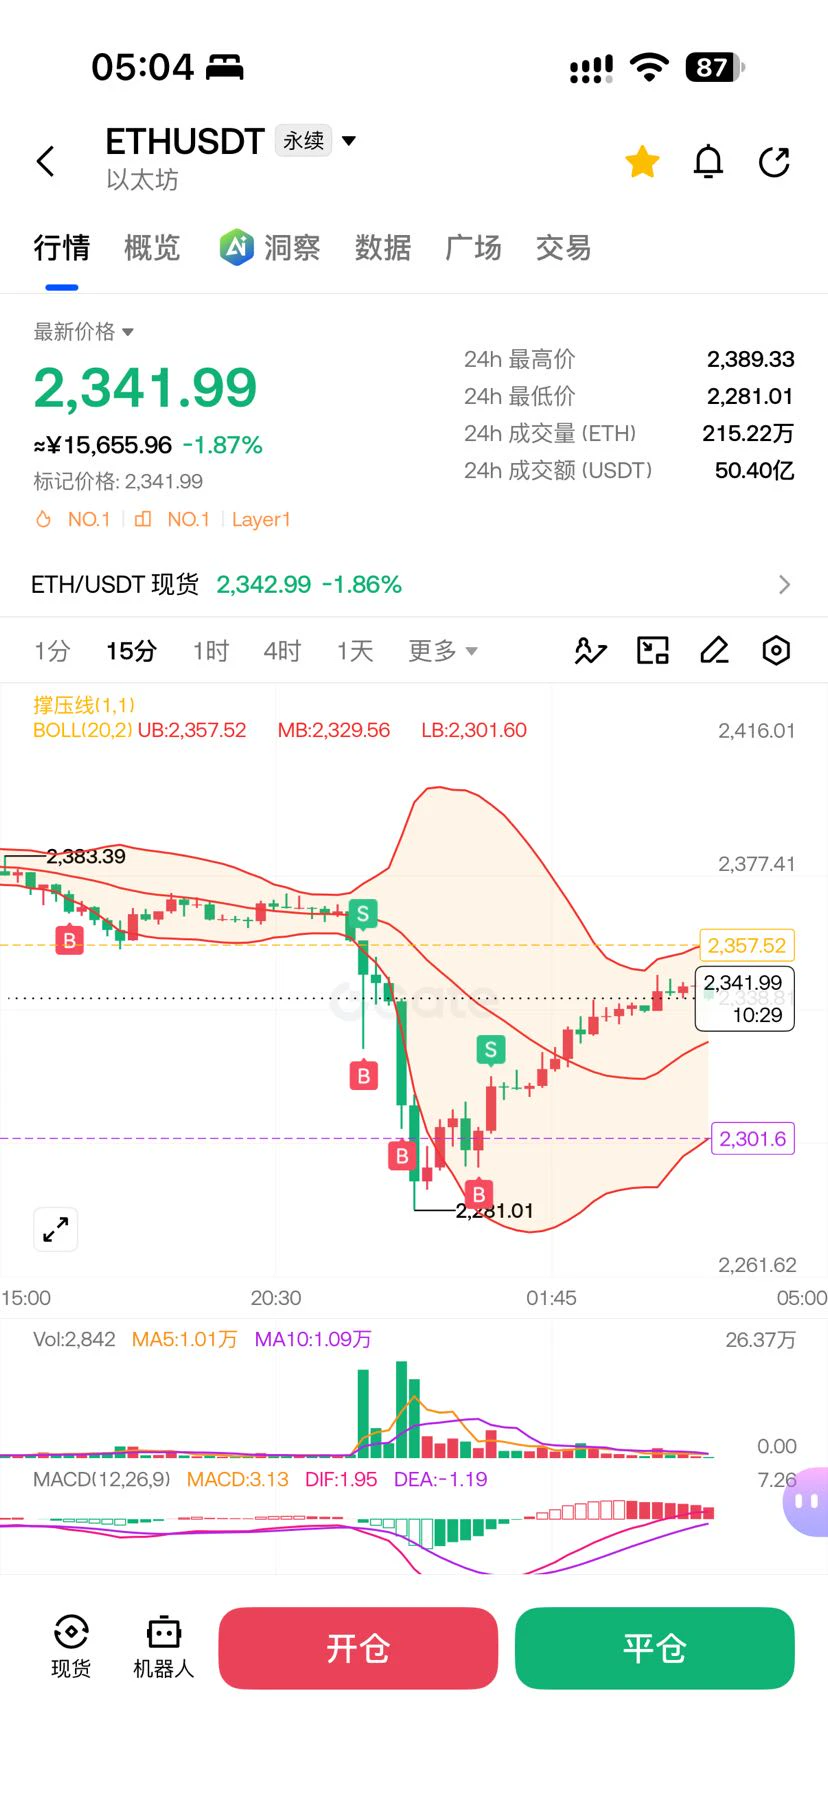
$ETH Signal】1H pullback support, long setup
$ETH Order book depth imbalance at 21.29%, bid-to-ask depth ratio at 1.54, with clear support around 1905. The 1H MACD green bars are expanding, while the 4H MACD bullish bars are contracting, giving short-term momentum the edge. RSI is 52.6 on 1H and 56.9 on 4H, not yet in an extreme zone. The 1H Bollinger Bands are narrowing, with price near the middle band, and a breakout window is approaching.
🎯Direction: Long
⚡Entry/Limit order: 1904.6849 - 1910.1500
🛑Stop-loss: 1891.0485
🚀Target 1: 1938.8023
🚀Target 2: 1953.1284
🛡️Trade management:
- Exec
ETH0.82%
View Original
post-image
  • Reward
  • Comment
  • Repost
  • Share
#KOSPITumblesOver6%TriggersTradingHalt
Some market drops are normal corrections. Others become a warning for investors around the world.
South Korea’s KOSPI experienced one of those extreme sessions as the benchmark plunged more than 6%, triggering the Korea Exchange’s sell-side Sidecar mechanism and temporarily suspending program sell orders for five minutes.
At first glance, this may look like a simple stock-market crash. But the story behind the move is much bigger.
KOSPI did not fall because of one company or one isolated headline. The selloff came as several pressures collided at the sam
post-image
  • Reward
  • Comment
  • Repost
  • Share
Financial News, Crypto Market Updates, Real Trading Strategies
gate liveLIVE
1,640
  • Reward
  • 1
  • Repost
  • Share
BigBoss07:
good morning good morning
#我的七夕交易分享
Little God of Wealth’s EA Stock Trading Analysis
Market Summary
EA traded within a narrow range at elevated levels overall last week. The share price moved between $208 and $210 at the beginning of the week, closing at $209.70 on August 14, down slightly by 0.10%. Weekly volatility was extremely limited, with an amplitude of less than 1.5%. Trading volume quickly contracted from its normal levels at the beginning of the week, with 48.71 million shares traded on August 14, far below the 101.99 million-share peak on the August 4 earnings day, indicating that the market entered a diges
EA-0.03%
View Original
post-image
LittleGodOfWealthPlutus
#我的七夕交易分享
Little Fortune’s U.S. Electronic Arts Stock Trading Analysis
Market Summary
EA overall showed a high-level, narrow-range consolidation pattern last week. The stock traded in the $208–$210 range at the beginning of the week and closed at $209.70 on August 14, down slightly by 0.10%. Weekly volatility was extremely low, with a price amplitude of less than 1.5%. Trading volume quickly contracted from its normal early-week levels, with 48.71 million shares traded on August 14—far below the approximately $101.99M in trading value recorded on the August 4 earnings date—indicating that the market entered a digestion and consolidation phase after the strong earnings report. Notably, trading value surged to $10.2B on the day of the August 4 earnings release, up 986% from the previous day, while the stock fell only 0.10%. This indicates that major funds quickly absorbed selling after the earnings were realized, narrowing the divergence between bulls and bears. EA is up 2.63% year to date and 31.25% over the past 52 weeks. The 52-week range is $163.93–$210.20, and the current share price is approaching its all-time high.
Company Operating Conditions
‌Latest earnings showed strong growth.‌ EA released its first-quarter earnings report for fiscal 2027 on August 3, covering the period ended June 30, 2026. Revenue was $1.99B, up 18.85% year over year, while net income surged 97.51% to $397M, significantly exceeding market expectations. Earnings per share were $3.54, operating cash flow was robust, and free cash flow over the past 12 months reached $1.75B. The company’s core IP portfolio remains solid, with the EA SPORTS FC series continuing to contribute stable revenue, while subscription and online services revenue accounted for an increasing share of total revenue.
‌New strategy opens up monetization opportunities.‌ The company also launched the “EA Advertising” real-time dynamic advertising platform and EA SPORTS UFC 6, aiming to tap into the advertising monetization potential of its existing content ecosystem and establish a recurring revenue channel less dependent on seasonal blockbuster releases. CEO Andrew Wilson emphasized the strategic direction of developing Battlefield into a long-term live-service platform and building a large online community.
‌Concerns are also evident.‌ The current P/E ratio is approximately 49–58x, far above the industry average of 23x, while the stock price is about 29% above analysts’ estimated fair value. The average target price from the 12 analysts covering the stock is only $208.78, implying extremely limited upside. In addition, changes to App Store economic policies could affect mobile revenue, execution risks surrounding new game launches remain, and continued increases in operating expenses are all medium-term uncertainties.
Technical Indicators Analysis
‌Moving averages‌: The stock remains above all short-term moving averages, with the 5-day, 10-day, and 20-day moving averages in bullish alignment, indicating that the short-term trend remains intact. However, the gaps between the moving averages are narrowing, showing that upward momentum is weakening.
‌MACD‌: The red bars above the zero axis continue but have shortened significantly, indicating that momentum is transitioning from strong to neutral. No death cross has formed, but the bullish advantage is weakening.
‌RSI‌: The 14-day RSI is as high as 76.60, deep in overbought territory, making a short-term technical pullback highly likely.
‌Bollinger Bands‌: The stock is trading close to the upper band at $210, with an extremely narrow bandwidth, forming a compressed pattern that is about to choose a direction. A breakout above the upper band would open up further upside, while a break below the middle band at $205 could trigger a rapid pullback toward the lower band.
‌Trading volume‌: After the massive volume following the earnings report, trading volume quickly contracted to an average of fewer than 30 million shares per day. Willingness to chase higher prices has cooled sharply, forming a typical “wait-and-see after positive news is priced in” pattern.
Key Support and Resistance Levels
‌Support‌: $205 (the dense short-term moving-average zone and Bollinger middle band), $200 (the round-number psychological level and previous consolidation platform), and $190 (strong medium-term support and the starting point of the rally before the earnings report).
‌Resistance‌: $210 (the 52-week high and Bollinger upper band), $215 (the first target after a breakout and analysts’ extremely bullish scenario), and $230 (the longer-term valuation recovery target).
Outlook
In the short term, EA is at a critical point where “strong fundamentals and high valuation are competing.” With the RSI in overbought territory and the stock trading close to its 52-week high, a technical pullback of $3–$5 to the $205–$206 range is highly likely. However, the imminent release of UFC 6, progress in commercializing the advertising platform, and the new game pipeline in the second quarter could provide catalysts. If the data validates these factors, the stock could break above $210 on increased volume and open up further upside. In the medium term, EA’s transition from one-time purchases to a “games-as-a-service” model is clear. A higher proportion of subscription revenue will smooth earnings volatility, but a P/E ratio of nearly 50x requires sustained earnings outperformance to remain supported. If second-quarter net bookings growth slows or advertising penetration falls short of expectations, the risk of a valuation pullback will rise significantly.
Trading Recommendations
‌Existing holders‌: Near $210, reduce the position by one-third to lock in profits. Use $200 as a hard stop-loss level for the remaining position. If the stock pulls back to $205 and stabilizes, consider adding to the position.
‌Those without a position‌: Chasing higher prices is not recommended at present. Patiently wait for the stock to stabilize after pulling back to the $200–$205 range, then enter in batches. A breakout above $210 on increased volume can be followed with a small position, targeting $215–$220. Abandon the setup if $195 is broken.
‌Position control‌: The gaming industry is heavily affected by product cycles, with high valuation elasticity but intense volatility. Limit a single-stock position to no more than 5% of total capital, and avoid heavily betting on the performance of a single new release.
The above reflects Little Fortune’s personal opinion and does not constitute investment advice. Wishing everyone prosperity every day!
#股票交易分享挑战 $EA
repost-content-media
  • Reward
  • 2
  • Repost
  • Share
LittleGodOfWealthPlutus:
Wishing you prosperity and good luck! 😘
View More
Bitcoin is holding the line. 👀
$65K rejection came fast, but bulls are still defending $64K.
Above $65.7K → $67.2K 🎯
Below $64K → $63K → $61K
I’m watching the $64K–$65K range closely.
Confirmation > prediction.
Are bulls ready for the breakout? 🚀
#BTC #Bitcoin #Crypto #Trading
BTC0.23%
post-image
Will El Salvador hold $1b+ of BTC by...?
December 31, 2026
1.30x
77%
September 30
No
$12 Vol+1 more
  • Reward
  • Comment
  • Repost
  • Share
$Bull Is Coming Market down today—shouldn't it have fallen harder?
牛来4.79%
View Original
post-image
  • Reward
  • 1
  • Repost
  • Share
伥虹:
Got my wish.
$RATS – Looking to ride the current bullish momentum
RATS LONG
Entry: 0.00004638 – 0.00004652
Stop Loss: 0.000044003
TP: 0.000047428999999999996 - 0.00005012 - 0.000051832999999999997
RATS1.83%
post-image
  • Reward
  • 1
  • Repost
  • Share
LegendarySuperShort:
Nonsense, listening to you could cost me.
Two AI giants recently released their financial reports, and the gap is surprisingly huge!
Their revenue differed by $5 billion!
Anthropic’s revenue surpassed $11.5 billion and it became profitable for the first time,
while OpenAI’s losses continue to grow.
Is OpenAI no longer as appealing?
In the AI era, who is swimming naked?
View Original
post-image
  • Reward
  • Comment
  • Repost
  • Share
$BTW Signal】1H overbought + 4H breakout, bullish sniper setup
$BTW RSI 1H 89.59, order book buy-side depth ratio 0.22, with dense sell orders above. Price 0.5073 has moved above the 4H Bollinger upper band at 0.4590, while the 1H MACD histogram is widening at 0.0082. The 4H MACD histogram is also expanding at 0.0094. Buy order continuity is average, with selling pressure testing after the breakout.
🎯 Direction: long
⚡ Entry/limit order: 0.5057582 - 0.5072800
🛑 Stop loss: 0.5022072
🚀 Target 1: 0.5148892
🚀 Target 2: 0.5186938
🛡️Trade management:
- After reaching Target 1, reduce the posit
BTW53.02%
View Original
post-image
  • Reward
  • Comment
  • Repost
  • Share
$HBAR strong fundamental project.
in an upward position since.
this is a long term project similar to eth, qnt, pol.
nb: no more than 5% of your portfolio per coin.
HBAR3.39%
post-image
  • Reward
  • Comment
  • Repost
  • Share
🔴 $TAO SHORT
🎯 Entry: 190.47 – 190.65
🛑 Stop Loss: 194.37
🎯 TP: 189.04 - 184.84 - 182.18
TAO-0.99%
post-image
  • Reward
  • Comment
  • Repost
  • Share
We can just short near the daily moving average, around $4,365! It only broke below it yesterday, so it probably won’t move in both directions for now. That’s not to say it won’t, just that the probability is low. We’ll use the strategy with the higher probability. $XAUUSD
XAUUSD0.10%
View Original
post-image
  • Reward
  • Comment
  • Repost
  • Share
$KORU ‌— Sharp Decline, Wait for Confirmation
KORU is down 17.91%, trading at $17.698. Price is below all EMAs — EMA5 at $17.778, EMA10 at $17.946, and EMA30 at $19.312 — confirming a bearish structure. The 24h low of $16.706 is being tested.
Plan:
· Entry: $17.698 (current) or $18.00 on a bounce.
· Target 1: $17.00 — near support.
· Target 2: $16.50 — if selling continues.
· Stop-loss: $18.50 — above EMAs.
Then vs. Now: KORU was above $21.74 not long ago — now it's below $17.70. A sharp reminder that markets can turn fast. If you're in this trade, be honest with yourself. If you're waiting,
KORU-15.82%
post-image
  • Reward
  • 8
  • Repost
  • Share
ShortPositionsAtTheElevator:
Bro, EMA30 is at 19.3, and a rebound to 18 will most likely just provide fuel for the shorts. If you want to go long, wait for a break above 18.5 before considering it—don’t rush to catch a falling knife.
View More
BTC Update
gate liveLIVE
1,804
  • Reward
  • Comment
  • Repost
  • Share
Points are not “air coins”; the real show comes later
The Gate event points system has gone live. It may look like nothing more than adding a points portal, but behind it lies a very typical user-operations strategy: giving users “something to do.” In the highly competitive trading platform industry, fees, products, and campaigns can all be compared, but user stickiness often comes from something much simpler—I have already accumulated a lot here, so I am reluctant to leave.
Points happen to create this kind of psychological account.
In the past, when users participated in platform campaigns,
View Original
post-image
post-image
  • Reward
  • 1
  • Repost
  • Share
CoinRelyOnUniversal:
🥳🤤😝😗🙃🤗😗🤔😙😗🤔😙☺️🤔🥰☺️🤔🥰😊🤔😍😊🤔🥰😊🤔🥰😉🤫
Load More

Join 40 M users in our growing community

⚡️ Join 40 M users in the crypto craze discussion
💬 Engage with your favorite top creators
👍 See what interests you
  • Pinned