Share your thoughts
placeholder
Article
These returns make me nervous, as if the market might realize what's happening tomorrow and blacklist me.
With the screen glowing green, $TAO consolidated around 225.0, and no matter how I looked at it, it seemed ready to break down. But I noticed that buyers stepped in every time it dipped, while the trading volume quietly supported it. The bottom was moving sideways without breaking down—this structure didn't favor shorts; instead, I should have been watching for longs. Once the market stabilized a little, I opened a long position.
I didn't expect it to surge straight to the current 261.9,
post-image
TAO+0.12%
BNB-1.16%
XRP-1.20%
The biggest variable in this long position is not direction, but whether I can hold it. After entry, the price did not immediately move away from the cost zone and first went through a shakeout. I did not lose the core position due to short-term volatility. I only added after $CL stabilized above 82.62, with the remaining 30% to be added if a signal appears on a pullback.

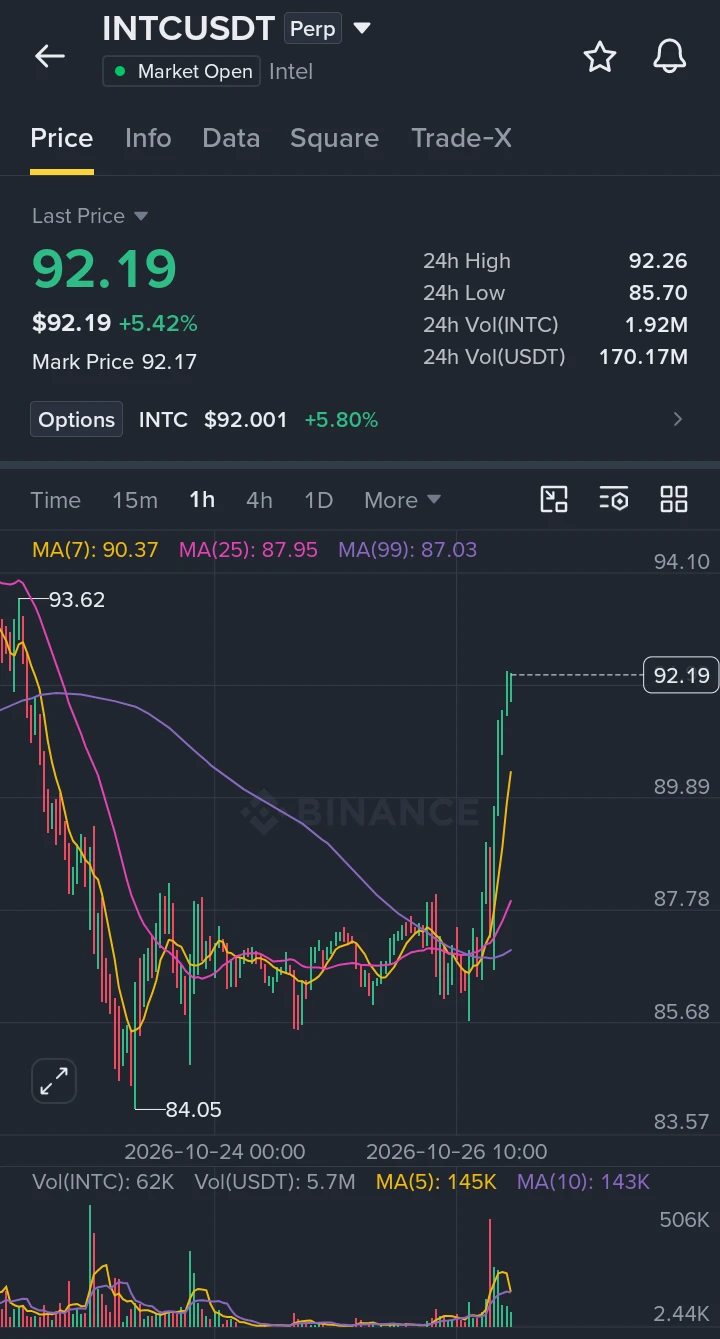
The current price has reached 92.32, with unrealized gains of +1092.13%. I first took profits on roughly 70% and moved the protective stop for the remaining position above the entry price. This is not because I am no longer
post-image
CL+0.51%
DOGE+0.67%
ETH-0.05%
$PONS breaks all the previous records as daily trading volume reaches ATH at $919M 🔥
Welcome Robinhood Chain 🚀 🚀 @RobinhoodCrypto
post-image
PONS-12.04%
A candlestick chart is a combination of multiple candles a trader uses to anticipate the price movement in any market. In other words, a candlestick chart is a technical tool that gives traders a complete visual representation of how the price of an asset has moved over a given period.
The candlestick chart is a crucial price action tool that shows detailed information about price, including the open, close, high and low for a particular time frame. Still, it’s confusing when compared side-by-side with a bar chart.
post-image
“Man proposes, God disposes. A torrential rain extinguished the flames at Shangfang Valley, and with them, the chancellor’s lifelong regret.”
“Despite exhausting every possible stratagem, one still cannot withstand fate’s casual stroke. We all sigh for Zhuge Liang, but whose life has not seen an unexpected ‘Shangfang Valley downpour’?”
Nobody is talking about the hidden trap forming inside SYMBOL right now.

$MU /USDT - SHORT

Trade Plan:
Entry: 1038.52 – 1040.78
SL: 1050.45
TP1: 1031.55
TP2: 1026.15
TP3: 1018.05

Why this setup?
Why now? The daily trend is range, which means the market is coiling for a decisive move. The 1h ATR of 4.500049 shows volatility is compressed, setting the stage for a sharp breakdown. The 15m RSI at 52.63 confirms neutral momentum but sits right at the entry zone of 1039.65, where the 1h price is currently trapped. A move below TP1 at 1031.55 targets TP2 at 1026.15, but the trade is invalidated
MU+2.31%
BREAKING: Arbitrum’s $ARB has surged 95.97% over the past seven days, with weekly perpetual trading volume reaching $9.2 billion.
ARB-9.61%
  • 1
[New Streamer] Market Prediction
live-cover
LIVE899
Rewards are being distributed! Open your mystery box now and win up to 100 USDT worth of tokens! https://www.gate.com/referral/earn-together/invite/UFRFAQ0M?ref=UFRFAQ0M&ref_type=103&utm_cmp=rXJBDjtJ&activity_id=1788357807948
post-image
Ethereum's next major Hegotá upgrade planned for 2027 will let users pay transaction fees in stablecoins instead of ETH👀
#CryptoObservers
post-image
ETH-0.04%
Short positions are easier to hold when the entry gives enough room. The rebound lacked volume, so I entered short when the price stalled at the highs, placing the protection level slightly above the previous high; with a poor entry, even a good-looking trade is hard to hold.
After entry, it churned for a while before starting to move. I took off 80% at the first target and moved the protection level for the remaining 20% to around the entry price. A mid-move pullback nearly stopped out the remainder, but with the protection price close enough, the subsequent drop completed the exit.
Looking b
post-image
ETH-0.05%
SOL-2.28%
When the profit on this long position reached 150.28, +675.26% had already exceeded the first target I initially set. The original plan did not include adding to the position, and I will not add now either. The higher the price, the less room there is for pullbacks; adding to the position would require recalculating the cost basis and stop-loss, which is not what should be done when following the trend.

I will first take profit on 80%, while continuing to hold the remaining 20%. Reducing the position does not mean I am bearish; it means adjusting the position structure from “betting on a reb
post-image
SOL-2.28%
DOGE+0.67%
I didn’t chase the breakout above the previous high and only went long after the pullback stabilized around 220.7. A genuine breakout won’t usually complete in one move; the position built after a pullback confirmation is often more solid.
The price then moved upward in small steps, repeatedly lifting key levels. The fake bearish candle in the middle shook out quite a few short-term positions, but the bulls held the level and continued at their own pace.
After the unrealized profit reached +834.14%, I cut 70%, moved the protection level for the remaining position above the entry price to preve
post-image
LAB-2.82%
ETH-0.05%
Nobody is talking about the quiet move in NEAR right now.

$NEAR /USDT - LONG

Trade Plan:
Entry: 2.2971 – 2.3251
SL: 2.1772
TP1: 2.4115
TP2: 2.4785
TP3: 2.5790

Why this setup?
Why now? The daily trend is bullish and the 1h price sits at 2.3111, right on the entry reference. The 15m RSI is 36.76, meaning the short term is oversold enough to favor a bounce over a breakdown. The 1h ATR of 0.055805 tells us volatility is alive, so a measured push toward TP1 at 2.4115 is realistic before we even dream of TP2 at 2.4785. The entry zone between 2.2971 and 2.3251 keeps risk tight, and anything bre
NEAR-3.19%
While everyone else was still buying the rebound, I had already placed my short order around 0.17647 🫡 When I opened the chart this morning, $BTR had gapped sharply higher and looked pretty lively, but taking a closer look, all the trading was fake. I’ve seen far too many low-volume rallies like this.
The rebound couldn’t break through the key level, and there were fewer and fewer buyers. So where could it go? Down was the only way left. Everyone saw what happened next: the price went all the way from 0.17647 back to 0.04593. A +1456.51% gain—does that feel good or what?
I held this short ste
post-image
BTR-4.31%
BNB-1.16%
LAB-2.82%
No trades, no analysis, just pure luck. This performance is embarrassing to even talk about, but the account insisted on delivering, and nothing could stop it, so I’ll reluctantly accept this happiness. Hope I have this kind of “problem” every day. 😅
When the market kept swinging back and forth intraday, many people panicked and ran around. I saw $XRP forming a bottom without breaking down, so I knew what was going on. I didn’t chase the trade or cut my losses—I just quietly waited for it to choose a direction. Once it did, it could only go up. 🧘
The result? From 1.3837 to 1.3966, +86.72% pr
post-image
XRP-1.20%
ETH-0.05%
ZEC-5.51%
Wasn't expecting this on Labor Day Monday morning tbh
Insiders are calling this the most ignored breakout since $USELESS /USDT doubled last cycle.

$USELESS /USDT - LONG

Trade Plan:
Entry: 0.21905 – 0.22647
SL: 0.18714
TP1: 0.24948
TP2: 0.26729
TP3: 0.29400

Why this setup?
Why now? The 1h price is holding at 0.22276 inside a tight range while the 15m RSI sits at 47.46, showing neither overbought nor oversold exhaustion. The daily trend is bullish, and the 1h ATR of 0.014842 confirms that volatility is compressing before a potential expansion. The entry zone between 0.21905 and 0.22647 aligns perfectly with this compression, setting up a clea
USELESS-0.07%
Insiders are fading the bounce on SYMBOL right now.

$TRUMP /USDT - SHORT

Trade Plan:
Entry: 2.260 – 2.276
SL: 2.347
TP1: 2.208
TP2: 2.169
TP3: 2.109

Why this setup?


Debate:
Are we hitting TP2 or getting trapped at the invalidation?

⚠️ Personal market analysis only. NFA — manage risk and DYOR.
Educational content, not investment advice or a recommendation to buy, sell, deposit, or withdraw any asset. No paid promotion or referral/affiliate links.
TRUMP-2.03%
btc updates
live-cover
LIVE1,695
Load More

Join 40 M users in our growing community

⚡️ Join 40 M users in the crypto craze discussion

💬 Engage with your favorite top creators

👍 See what interests you

View More