
Share your thoughts
placeholder
Article
#RedBullTradingTourSeason6 Red Bull Trading Tour Season 6, Bringing Trading Energy To A New Level
Trading is not only about charts, candles, indicators, and numbers. At its core, trading is about people, decisions, discipline, confidence, and the ability to stay focused when the market becomes unpredictable. Red Bull Trading Tour Season 6 brings this idea to life by creating an environment where traders, market enthusiasts, and the wider trading community can connect, learn, share experiences, and experience the excitement of the financial markets together.
Season 6 represents another step for
Everyone’s staring at the 15m RSI (70.94) while SLX silently prints lower highs on the 4h.

$SLX /USDT - SHORT

Trade Plan:
Entry: 0.07002 – 0.07044
SL: 0.07228
TP1: 0.06869
TP2: 0.06767
TP3: 0.06613

Why this setup?
Why now? The 1D range isn’t your friend—it’s a trap door.
- 4h bias is SHORT (55% conf), but the real tell is the EMA cluster at 0.07023.
- Price is pinned at entry_ref, with TP1 at 0.06869 (a 2.2% drop) and TP2 at 0.06767 (3.6%).
- ATR (0.000855) says volatility is compressed—breakouts get violent.
- The 15m RSI is overheated, but that’s noise. The 4h structure is what
SLX+2.74%
Nobody sees the 95% conviction short on $HOME /USDT — but the 4h chart is already screaming.

$HOME /USDT - SHORT

Trade Plan:
Entry: 0.00600 – 0.00602
SL: 0.00615
TP1: 0.00590
TP2: 0.00583
TP3: 0.00573

Why this setup?
Why now? The daily trend is bearish, and price is stalling at 0.00601 with a tight 1h ATR of 0.000059 — that’s compression before a drop. RSI on 15m sits at 49.47, neutral, giving room to fall, not bounce. Targets are stacked: TP1 at 0.00590, TP2 at 0.00583, TP3 at 0.00573. Invalidation is clear at 0.00617 — if we lose that, the short thesis dies. But with 95% confidence and
HOME-0.33%
Locking in has never been this easy.
post-image
[New Streamer] Market Prediction
live-cover
LIVE34
$Bull is coming ‌ Bull is coming, continue entering short positions; there is at least twice as much downside remaining👇🏻
post-image
牛来-10.11%
$1000 to $100,000 Crypto Trade Challenge Today
live-cover
LIVE545
$MARSCOIN Signal】Long Setup: Strong Order Book Support + Pullback Orders
$MARSCOIN Buy-side order book depth imbalance 33.2%, Bid/Ask ratio 1.99, with substantial bids below. The 1H MACD has formed a death cross, with the histogram at -0.0002; bearish momentum is visibly weak. The 4H Bollinger upper band is at 0.2125, while the price is still trading above the middle band. OI is stable, and the funding rate is 0.0498%, so the cost of holding long positions is not extreme.
🎯 Direction: Long
⚡ Entry/Limit Order: 0.1900182 - 0.1905900
🛑 Stop Loss: 0.1886841
🚀 Target 1: 0.1934489
🚀 Target 2
post-image
MARSCOIN+52.49%
BTC-1.78%
ETH-2.04%
SOL-1.79%
BlackRock says rising government debt and weakening currency strength are driving Bitcoin's rally.
Bitcoin is up 23.4% over the past 30 days, but still down 8.9% year to date.
Meanwhile, gold is up 5.5% over 30 days and 3.5% year to date.
BLK-0.37%
BTC-1.78%
  • 2
#GateTops7DayNetInflowsGlobally
🚀 Gate’s Capital-Flow Momentum Is Getting Harder to Ignore
In crypto, price charts often get all the attention. Green candles, new highs, sudden corrections, and market sentiment dominate the conversation.
But there is another metric I believe traders should watch closely: capital flows.
Recent market-flow data has placed Gate among the leading global centralized exchanges, with approximately $300.43 million in seven-day cumulative net inflows. Another recent snapshot showed around $48.54 million in net inflows over 24 hours.
These numbers represent significan
BTC-1.78%
ETH-2.04%
  • 1
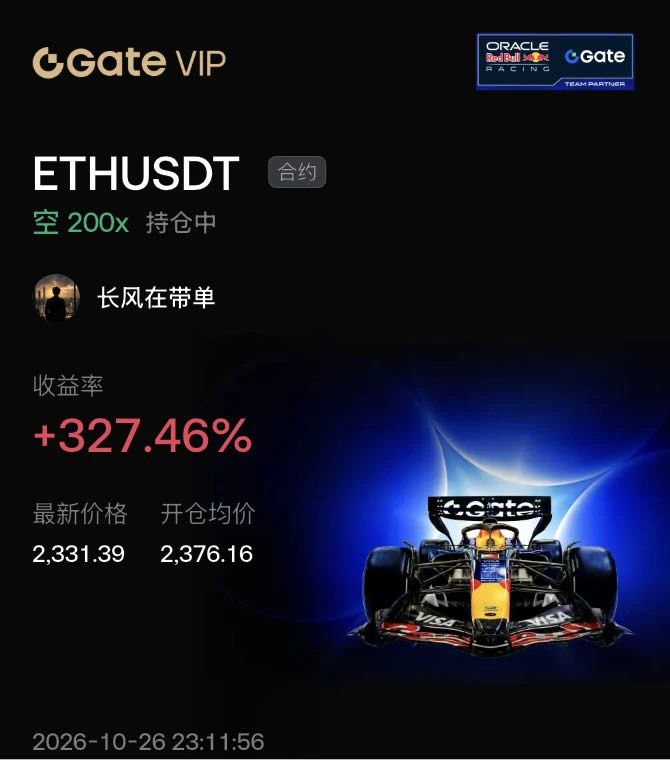
A few days ago, my hand trembled as I set the stop-loss; this morning I realized that was unnecessary filial piety. A few days ago, before bed, I saw $EDEN print another bullish candle, but the trading volume was pitifully low, with obvious resistance overhead—the bull trap was too obvious. I went short with the trend at 0.06403, set the stop-loss, and left it alone. When I opened the chart this morning, the current price was 0.05759, with a return of +198.03%—it completely left me speechless.
How is this a rebound? This is CPR for my short account, isn’t it? I closed the position at +198.03%
post-image
EDEN-6.26%
SNDK+10.70%
SOL-1.68%
#USELESSSurgesAnother67%
$USELESS IS MOVING INTO A NEW MOMENTUM ZONE 🚀
USELESS has taken another major step higher, with the token now trading around $0.26 after an explosive run that has completely changed its short-term market structure.
What makes this move interesting is not simply the percentage gain. It is the speed at which USELESS has transitioned from a relatively quiet setup into a high-volume momentum market. Buyers have continued stepping in aggressively, pushing price through previous resistance areas and now placing $0.25 firmly in the spotlight.
The big question is no longer w
USELESS+31.15%
  • 1
The same 1000U invested in $FLOCK yesterday has already turned into 1340U, while those who bought the coin next door are still on the road to breaking even. This coin surged from 0.0369 to 0.0654 in 24 hours, with a 77% range and $184 million in trading volume—it's a small-cap, relatively new token, and the market is clearly willing to take risks. It's now at 0.0528, up 33.94% after pulling back 19%; if you think this is an entry point, let's break it down.
First, the bullish case: the 24-hour high of 0.0654 shows that someone was aggressively buying regardless of cost, and 184M in volume is e
FLOCK+27.51%
I found a real gem.
crawl4ai, the top crawler on GitHub, turned one guy’s anger after getting burned by a $16 paid service into a 51,000-star open-source project.
Throw any website into it, and out comes clean Markdown that LLMs can consume directly. No API key, no account, no paying per page, and it runs even harder than those paid services.
Put simply, a developer got pissed off by a monthly fee of a few hundred yuan, finished it in just a few days, and then released it for the whole world to use for free.
Guys, the interesting part here isn’t the technology. It’s that this proves one thing—
post-image
$DASH Signal】1H breaks above the upper Bollinger Band, bullish momentum continues
$DASH RSI 1H 81.36, with the price at 64.26 breaking above the upper Bollinger Band at 62.88. MACD momentum is expanding across both timeframes, with the 4H histogram at 1.84. Bid depth dominates the order book, with a Bid/Ask ratio of 1.73, and the funding rate at 0.01% shows no signs of overheating. OI is stable, with no signs of short-side resistance.
🎯Direction: Long
⚡Entry/limit order: 64.0672 - 64.2600
🛑Stop-loss: 63.6174
🚀Target 1: 65.2239
🚀Target 2: 65.7059
🛡️Trade management:
- Execution strategy:
post-image
DASH+38.94%
$FHE Signal】4H breakdown + selling pressure dominant, clear short opportunity
$FHE 4H MACD momentum is weakening, with price continuing lower after piercing the Bollinger midline. 1H MACD bearish momentum is expanding, while RSI has fallen below the neutral zone. The Buy/Sell order book is clearly imbalanced, with sell orders dominating. Volume is expanding simultaneously, and selling pressure is being released.
🎯 Direction: short
⚡ Entry/limit order: 2439.48 - 2446.82
🛑 Stop-loss: 2471.29
🚀 Target 1: 2410.12
🚀 Target 2: 2391.77
🛡️Trade management:
- Execution strategy: Reduce the posi
post-image
FHE-1.92%
BTC-1.78%
ETH-2.04%
SOL-1.79%
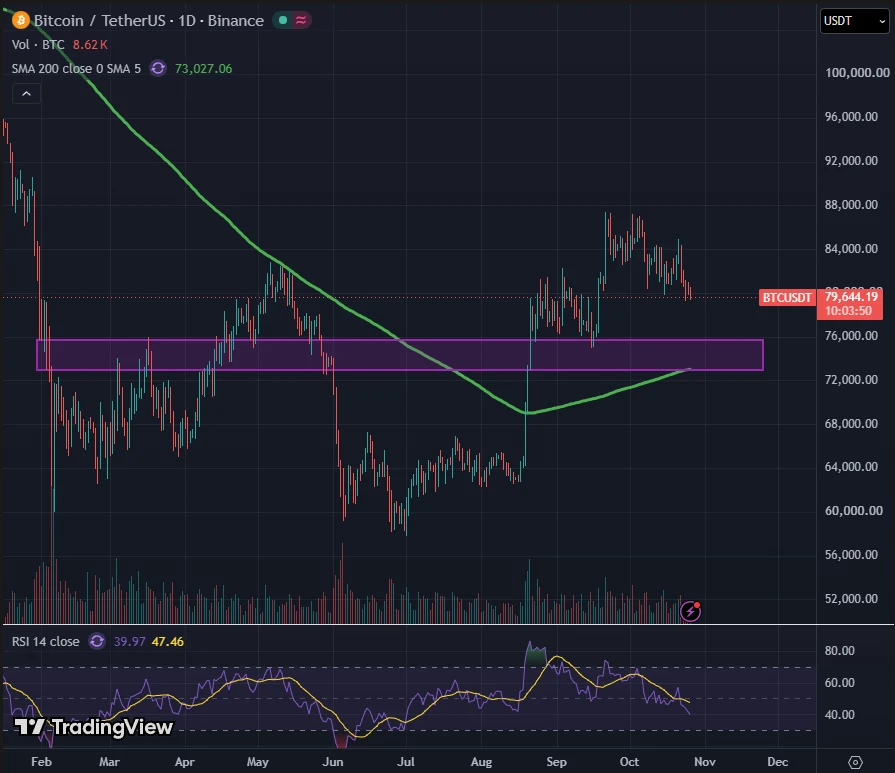
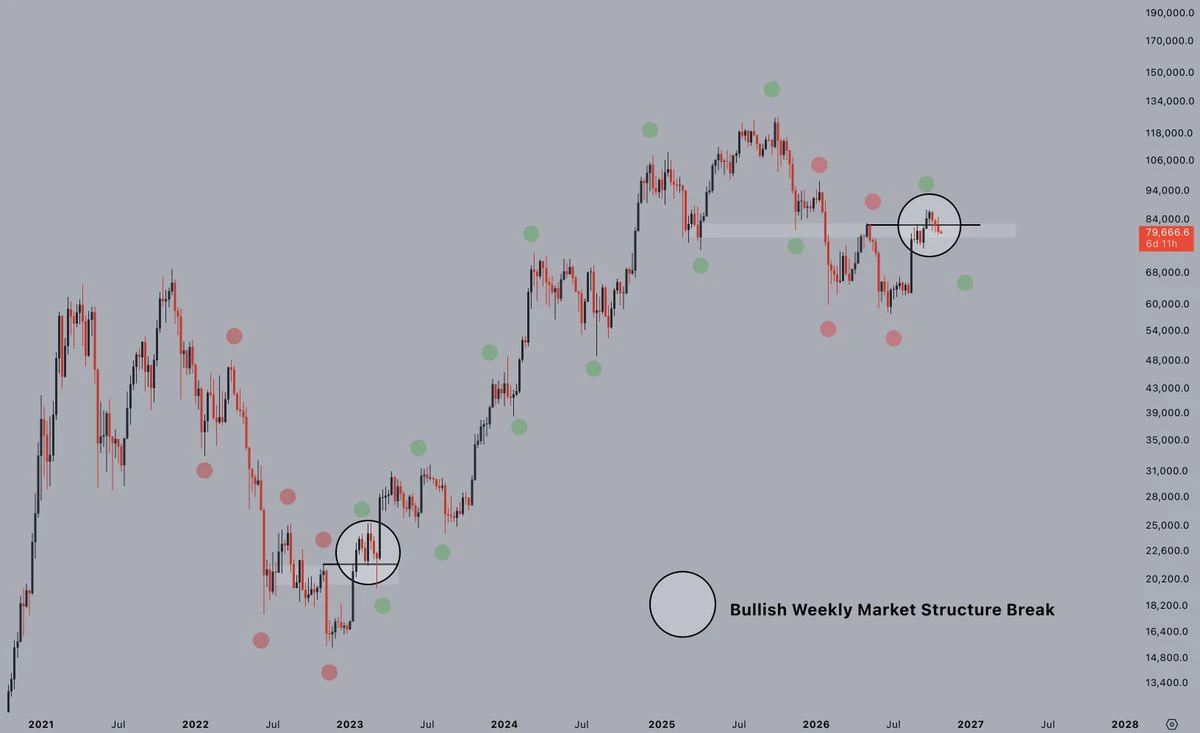
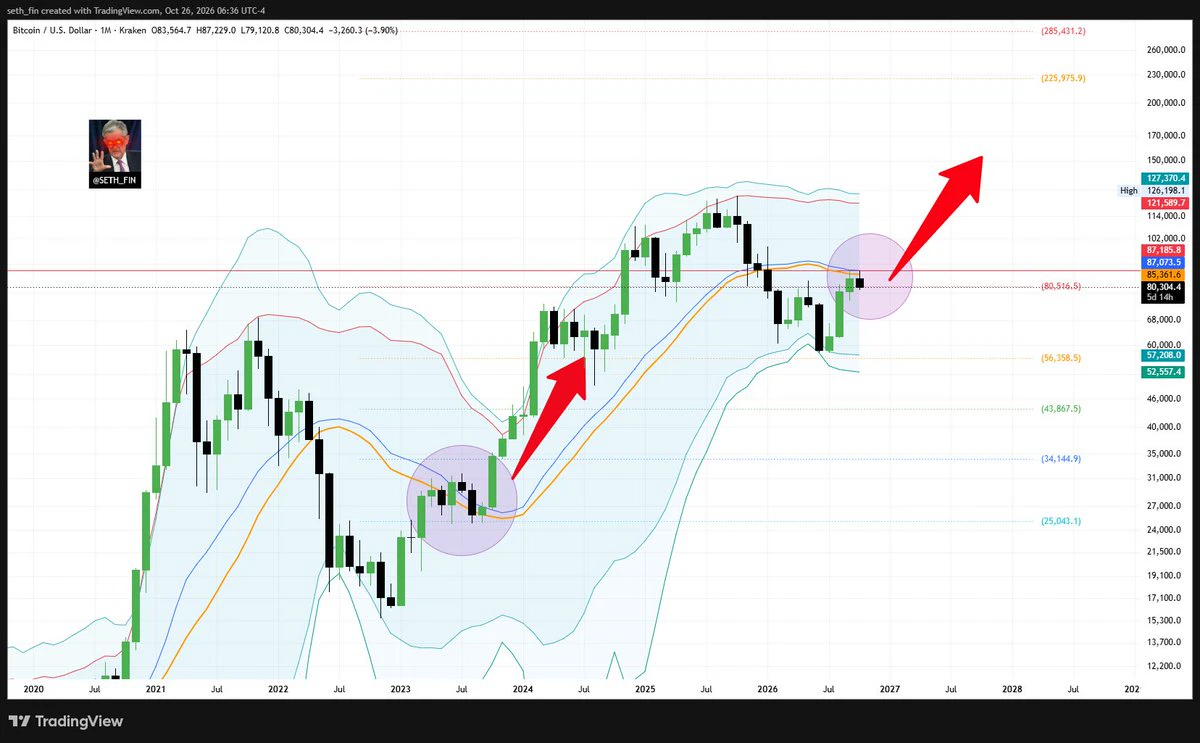
#BTCReclaims80K Reclaims 80K, Why This Level Matters Again
Bitcoin has reclaimed the 80,000 dollar level, bringing fresh attention back to one of the most important psychological zones in the crypto market. A move above 80K is not simply another price milestone. It can represent a meaningful shift in market sentiment, especially after periods of uncertainty, volatility, and heavy selling pressure.
The 80K level carries strong psychological importance because traders and investors naturally pay close attention to large round numbers. When Bitcoin trades below such a level, it can become resist
BTC-1.78%
Zhanan Watch, Issue 3 Update, 26.9.05 (UTC+8) 9:00
U.S. nonfarm payrolls released before the market opened last night came in significantly above expectations, increasing the probability of a rate hike in September and weighing on U.S. stocks and the cryptocurrency market. However, the overall impact appears limited for now, as the market may be waiting for the Fed’s interest rate meeting.
Figure 1: SPCX daily chart
Today’s closing price was 147.95, with an intraday high of 150.85 and a low of 147.32, down 1.2%.
Big Rocket was not affected by external factors today and traded steadily througho
CryptoPlayerWithBadIntentions
Scumbag Watch, Episode 3 Update, 26.9.04 (UTC+8) 8:30
Figure 1: SPCX daily candlestick chart
Today’s closing price was 149.74, with an intraday high of 152.30, a low of 141.05, and a gain of 6.42%.
The Big Rocket had already been showing its old-geezer vibe a few days ago, as the scumbag said, but today it finally delivered, closing with a large bullish candle.
Once the battle began today, the bulls collectively stepped up and continuously reclaimed the high ground they had previously lost. After taking the 145 high ground, they continued advancing toward 150, engaged in back-and-forth fighting around 150, and gradually pushed upward to around the 152 line. Near the close, they repeatedly retreated to around 150. Overall, the situation looks good, but we also need to pay attention to tonight’s U.S. stock market data and the upcoming long holiday break (the market will be closed on Monday). If the stock price rises sharply again tonight, some profits can be taken off the table.
The scumbag’s next move will be to reduce the position partially around 158.
Figure 2: BTC daily candlestick chart
Today’s large bullish candle further validated the scumbag’s view. Whether it can set a new high afterward will be determined by future price action. Specifically, watch the previous high at 82800 and the false-breakout level at 85500.
repost-content-media
SPCX-1.19%
BTC-1.78%
I just switched the app to the background, and it shot right back up—are you playing hide-and-seek with me? 🌚

Just when I thought this move was completely dead, that pullback woke me up instead. Overhead pressure is obvious, with sellers hammering it down every time it pushes higher. 4474.29 is strong resistance, and a low-volume rebound is just handing chips to the shorts. 🎯

If you’re not sure about a token, taking a look is clear-headed; buying a position is foolish. Setting up risk controls in advance is rational; cutting after taking a loss is a decisive last resort.

When I switche
post-image
SNDK+10.70%
XRP-3.31%
$BLZ
BLZ/USDT was recorded at 0.014344 USDT in this snapshot, up 54.55% over 24 hours, with an intraday range of 0.009084—0.015844 and 24-hour trading volume of approximately 37k USDT.
The key point in the hourly candlesticks is not simply the percentage gain, but the structural shift: prices had previously moved sideways mostly around 0.0091—0.0095, before a single hourly candlestick quickly surged to 0.015844; after the spike, it returned to around 0.014. Trading volume was notably concentrated during that hour, making the short-term move more akin to “a pullback confirmation after a volume
post-image
BLZ+48.61%
Load More

Join 40 M users in our growing community

⚡️ Join 40 M users in the crypto craze discussion

💬 Engage with your favorite top creators

👍 See what interests you

View More