
Share your thoughts
placeholder
Article
I originally planned to cut my losses as a sacrifice to the heavens, but the sacrifice never happened—the meat roasted itself. This short trade really delivered 😂

During the intraday plunge, the entire market was moving lower. $SOXS rebounded several times but kept getting stuck at the same hurdle, with volume weakening each time—a classic case of no buyers on the way up. I went with the trend and opened a short position around 52.38, without expecting it to go very far; I was just looking to catch a pullback after its weak rebound. The price has now fallen to 42.83, with a paper gain of +4
post-image
SOXS-2.17%
SNDK+0.05%
ADA-0.18%
A hand that set the stop-loss a few days ago trembled slightly; this morning I realized that filial piety was unnecessary. The last thing I saw before bed, $ONDO ’s rebound was weak, with obvious resistance overhead. Every time it pushed up, large orders came in to suppress it. Confirmed once more at the open, then went straight short at 0.4079.

The current price is 0.3859, +259.73%. Feels really good. Keeping a close eye on the market wasn’t in vain—I got the rhythm right.

In terms of execution, take 80% off the table first. Put the bulk in your pocket before anything else. Move the stop-
post-image
ONDO+1.30%
ETH-0.35%
BNB-1.40%
Behind the $AKE 19% gain was 210M in trading volume, but the price was hammered from 0.02 to 0.0173, making that upper wick impossible to ignore. Those who chased the rally this morning are probably staring at their screens and cursing, while those who bought the dip have already quietly placed their take-profit orders.
The bulls actually have a solid case: first, the 24-hour range reached 77%, and after such a brutal shakeout, a second wave of gains often follows; the more thoroughly the chips change hands, the easier it is to push the price higher afterward. Second, 210M in trading volume is
AKE+19.78%
$HYPE /USDT is about to break out but nobody is watching.

$HYPE /USDT - LONG

Trade Plan:
Entry: 84.964 – 85.384
SL: 83.160
TP1: 86.684
TP2: 87.691
TP3: 89.202

Why this setup?
Why now? The daily trend is bullish and the 1h price is holding steady at 85.174, setting up a clean entry zone between 84.964 and 85.384. The 15m RSI at 42.28 shows just enough weakness to avoid a crowded long, while the 1h ATR of 0.839155 confirms the move has real momentum behind it. With TP1 at 86.684 and TP2 at 87.691, the risk reward is stacked in our favor. The trade is invalidated the moment price closes bel
HYPE-1.99%
I had just switched the app to the background, and it shot straight up—are you playing hide-and-seek with me? 🐱 When I checked the chart after lunch, the bottoming range was very clear, support was starting to strengthen, and volume was gradually picking up. I judged that the risk-reward at this level was favorable, so I took a position. I didn’t even finish my nap before it pulled straight into profit.

Entry at 0.4775, current price 0.7144, $PONS +980.06%. It really dragged beforehand, but once it moved, it felt amazing—I read it perfectly😏 This round of profits feels great; I caught the
post-image
PONS-12.23%
BNB-1.40%
ADA-0.18%
I did nothing—just went to the restroom, and when I came back, the candlestick chart had already done the work for me😳

During the repeated intraday swings, $ARB kept retesting 0.10885 without breaking below it, while volume failed to pick up. I judged that funds were accumulating at this level, so I directly opened a long position.

When I came back, the price had shot straight up to 0.17025, giving me +3232.92% in unrealized profit. This move gave us the answer, brothers🔥

First take profit on 80% and put the bulk of it in my pocket; move the stop loss on the remaining 20% to around the
post-image
ARB-10.20%
SOL-1.34%
BTC-0.75%
hot Topics updates
live-cover
LIVE21
[New Streamer] Market Prediction
live-cover
LIVE44
No vision, can’t hold—this short position’s profit was as thin as paper, but I loved every bit of it. During the intraday plunge, I watched the chart and noticed that every push upward fell just short, with the weak rebound being painfully obvious and overhead selling pressure seemingly free. Right after seeing the bearish news, I warned everyone not to rush into longs and to wait for a rebound before shorting. When I opened the chart this morning, the price had slid directly from 0.1336 to 0.1326, locking in +50.46%; the guys on board should have woken up laughing. The operation was simple: p
post-image
SNDK+0.05%
ZEC-6.01%
🚨 VIP SIGNAL: $ORCA /USDT (SPOT & FUTURES) 🚨
Pair: $ORCA /USDT
Direction: LONG 🟢
Trade Details:
Entry Zone: 1.5000 - 1.5450
Leverage: 3x - 5x
Targets:
🎯 Target 1: 1.6200
🎯 Target 2: 1.7300
🎯 Target 3: 1.8500
🎯 Target 4: 2.0000
Stop Loss:
❌ 1.3900
$ORCA ‌#GateLaunchesTrenchesWith0GasFee
post-image
ORCA+11.27%
  • 9
I only wanted to see whether it would fall, but it went straight into a free fall😏 A few days ago in the afternoon, $SKYAI was still pretending to bounce. I watched for a few minutes and my heart sank. Volume failed to follow through; every push upward was just short of enough, while the sell orders overhead were pressing down hard. Isn't this a classic bull trap? I placed a short at 0.07390 without the slightest hesitation. Now at 0.05618, with +589.32% profit already in my pocket, I feel great, brothers. It was truly sluggish at first, but the move was really satisfying once it started, an
post-image
SKYAI-5.35%
ETH-0.35%
SNDK+0.05%
After stalling at a high level, price broke below the range, and I began focusing on short opportunities from that point. The rebound lacked strength and fell back below the previous low, so I entered a short position with the stop set above the previous high, taking profits from this downward structure.
The intraday decline was not decisive and went through several rounds of back-and-forth grinding. I took 80% off at the first support level, and continued trailing the remaining 20% with the stop. I exited during the final accelerated drop, and the profit on the single trade was considerable.
post-image
DOGE+0.51%
LAB-2.16%
I originally wanted to sell at a loss as a sacrifice to the heavens, but the sacrifice never happened—the meat roasted itself. While everyone was still watching from the sidelines, I had already closely monitored the chart around 0.07843 for several rounds.
$LUMIA 's price action was textbook: sideways consolidation at the bottom without breaking down, gradually increasing volume, and funds quietly moving in. These were signs of major players accumulating, so I went long in advance.
After the price rose to 0.08268, the +106.77% gain was firmly locked in. It was truly sluggish at first, but the
post-image
LUMIA+0.35%
XRP-1.35%
ZEC-6.01%
$ROSE ABOUT TO MIMIC $ICP
post-image
ICP+12.87%
$SNDK /USDT is about to break a hidden range that most traders are ignoring right now.

$SNDK /USDT - SHORT

Trade Plan:
Entry: 1783.05 – 1786.59
SL: 1801.79
TP1: 1772.09
TP2: 1763.60
TP3: 1750.88

Why this setup?
Why now? The 1h price is pinned at 1784.82 inside a tight range on the daily trend, which means momentum is coiled and ready to snap. The 15m RSI reading of 46.33 shows just enough bearish lean to favor a short move over a bounce. With the 1h ATR at 7.07183, the average candle size is small enough that the entry zone between 1783.05 and 1786.59 offers a clean limit with room to br
SNDK+0.05%
Nobody is talking about this SHORT setup on $XAU /USDT right now.

$XAU /USDT - SHORT

Trade Plan:
Entry: 4413.02 – 4418.08
SL: 4439.86
TP1: 4397.32
TP2: 4385.16
TP3: 4366.93

Why this setup?
Why now? The daily trend is range, which means $XAU /USDT is coiling for a directional move and the 1h ATR of 10.129983 confirms enough volatility to fuel a clean leg down. The 15m RSI sitting at 55.64 shows the short-term momentum has not yet rolled over, so we are waiting for that precise shift to trigger our entry around 4415.55. If price pushes into the 4413.02 to 4418.08 zone, the plan targets TP1
XAU-0.37%
Why is everyone suddenly shorting silver when the daily trend is range?

$XAG /USDT - SHORT

Trade Plan:
Entry: 66.32 – 66.44
SL: 66.97
TP1: 65.94
TP2: 65.65
TP3: 65.21

Why this setup?


Debate:
Are we cleanly hitting TP2 or is this range about to trap the shorts?

⚠️ Personal market analysis only. NFA — manage risk and DYOR.
Educational content, not investment advice or a recommendation to buy, sell, deposit, or withdraw any asset. No paid promotion or referral/affiliate links.
XAG+0.32%
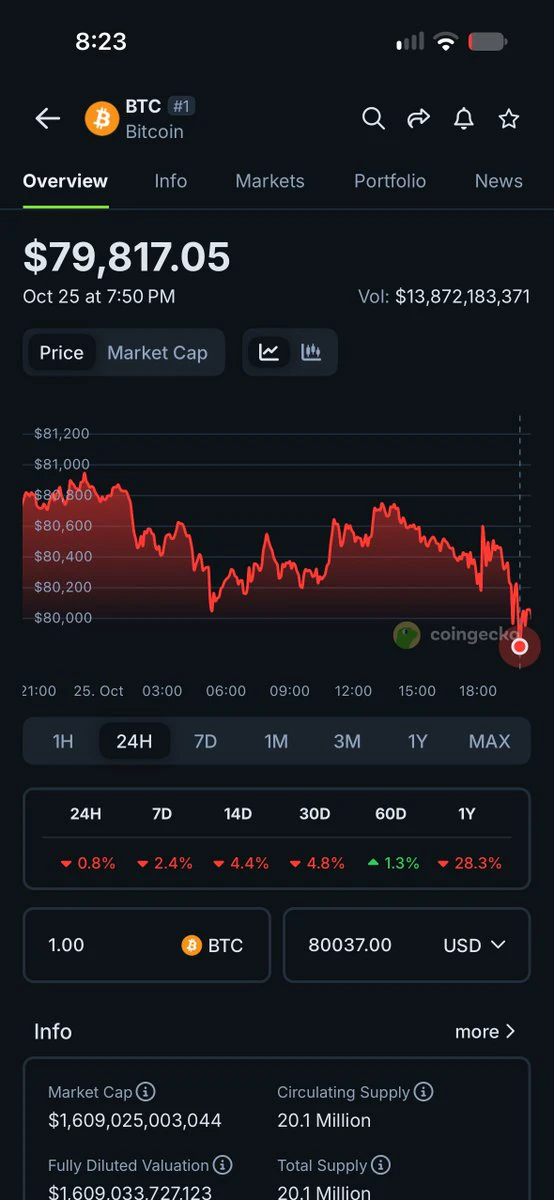
Me: “I used the last of our savings to buy bitcoin at $80,000, I hope you understand.”
My fiancé:
post-image
BTC-0.74%
$XLM /USDT is silently coiling for a move most traders will miss.

$XLM /USDT - SHORT

Trade Plan:
Entry: 0.19201 – 0.19341
SL: 0.19943
TP1: 0.18767
TP2: 0.18431
TP3: 0.17927

Why this setup?
Why now? The 1h price sits at 0.19277 inside a tight range, the 15m RSI reads 58.72 showing neither overbought nor oversold exhaustion, and the 1h ATR of 0.0028 confirms volatility is compressing before a directional burst. The daily trend is range-bound, which often precedes a sharp breakout, and the entry zone between 0.19201 and 0.19341 offers a precise trigger for a short bias. Targeting TP1 at 0.1
XLM+3.73%
Load More

Join 40 M users in our growing community

⚡️ Join 40 M users in the crypto craze discussion

💬 Engage with your favorite top creators

👍 See what interests you

View More