Share your thoughts
placeholder
Article
$XRP ‌XRP/USDT
😂 Why did XRP cross the road? To ripple on the other side.
📉 Short
Entry: 1.3900 – 1.3930
TP1: 1.3800
TP2: 1.3700
TP3: 1.3600
SL: 1.4000
📈 Long
Entry: 1.3700 – 1.3750
TP1: 1.3850
TP2: 1.3950
TP3: 1.4050
SL: 1.3600
🔑 Key Levels
Resistance: 1.3936 / 1.4000
Support: 1.3700 / 1.3324
⚠️ Not financial advice. DYOR & manage risk.
post-image
XRP+3.57%
Gate 24 小时合约持仓量超 114.79 亿美元 - 位列中心化交易所前三#合约持仓量 #中心化交易所 #衍生品 #今日热点话题
How Contract Open Interest Surpassing 11.47 Billion Signals a Top 3 Position Among Centralized Platforms
In crypto derivatives, trading volume gets the headlines, but open interest is what reveals where serious capital actually stays overnight. On September 14, the 24 hour contract open interest of a major centralized platform officially crossed 11.479 billion dollars, a milestone that has now placed it firmly inside the top three globally by that metric.
Independent trackers confirm the scale. Third party monitoring shows fig
post-image
discovery
Gate 24 小时合约持仓量超 114.79 亿美元 - 位列中心化交易所前三
#合约持仓量 #中心化交易所 #衍生品 #今日热点话题
How Contract Open Interest Surpassing 11.47 Billion Signals a Top 3 Position Among Centralized Platforms
In crypto derivatives, trading volume gets the headlines, but open interest is what reveals where serious capital actually stays overnight. On September 14, the 24 hour contract open interest of a major centralized platform officially crossed 11.479 billion dollars, a milestone that has now placed it firmly inside the top three globally by that metric.
Independent trackers confirm the scale. Third party monitoring shows figures fluctuating between 7.05 billion in clean assets, 12.17 billion in total open interest, and in recent snapshots 12.48 billion, all consistently ranking this venue within the top three worldwide. This is not a one day spike. According to an H1 2026 industry report, the same venue averaged 10.23 billion dollars in daily open interest over the first half of the year, representing a 9.1 percent market share and third place globally, while accumulating 2.53 trillion dollars in cumulative derivatives volume.
The distinction between volume and open interest is crucial for understanding why this matters. Volume can be generated and recycled quickly, sometimes artificially. Open interest, by contrast, is the total number of outstanding futures and perpetual contracts that have not been settled. It represents real margin locked on the platform. When open interest rises while volume stays stable, it means traders are opening new positions and holding them, indicating conviction and trust in the liquidation engine and depth.
The current position has been built on two structural shifts in the market that were captured earlier than competitors.
The first is the rise of real world asset perpetuals. In June, monthly trading volume for this category on centralized venues surged 57 percent to a record 311 billion dollars, driven by listings like space company IPO perpetuals and tokenized equities. While one venue led with 78.6 percent market share in that niche, other top platforms were the immediate followers, allowing them to capture flows that previously went entirely to traditional brokers.
The second is capital retention through product breadth. The platform in focus currently lists more than 1,700 assets and holds an average leverage of 2.04 times across its books, the highest among the largest venues tracked. Its futures volume reached 276 billion dollars in July alone, with an 11.2 percent open interest market share. That breadth means a trader can hedge major asset exposure, take a position on a stock future, and take a position on a prediction market without moving capital off the venue.
There is also a technical reliability factor. During periods of high volatility, such as the recent pullbacks in Asian equities and the Nasdaq this week, trading venues are tested on their risk engines. The venue in question maintained a 24 hour total spot and derivatives volume of around 9.5 billion dollars while keeping spreads tight on mid cap pairs during European hours, a period when other venues showed slippage after regulatory headlines.
For the broader market structure, holding a 9.2 percent share of total open interest and 9.52 percent of derivatives volume signals a slow decentralization of dominance away from a two venue oligopoly. It has gone from being seen as an altcoin spot venue to a core derivatives venue where institutional sized open interest is willing to rest.
The next test will be whether this open interest converts into sticky liquidity. If the venue can maintain above 10 billion dollars in daily open interest through the current equity driven volatility, it will confirm that its top three status is not a cyclical peak but a structural new baseline.
$BTC $ETH $SOL $XRP $GT
repost-content-media
  • 3
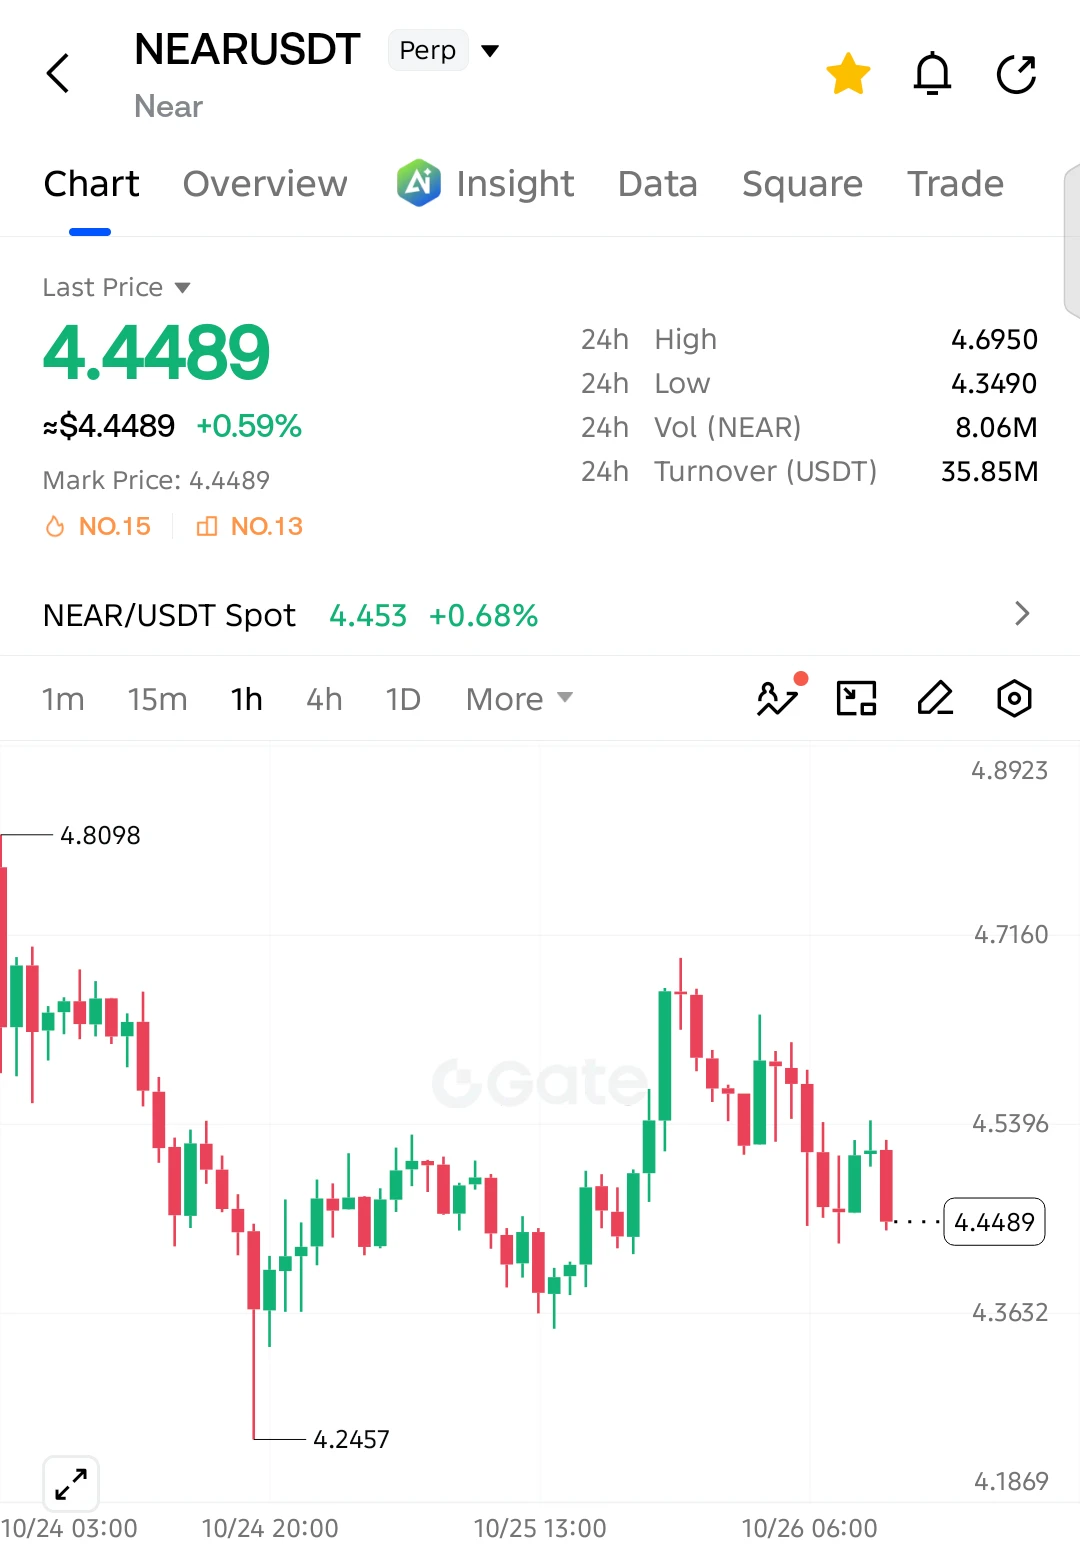
Insiders are calling NEAR the quiet breakout of the week.

$NEAR /USDT - LONG

Trade Plan:
Entry: 2.4078 – 2.4248
SL: 2.3346
TP1: 2.4776
TP2: 2.5184
TP3: 2.5797

Why this setup?
Why now? The daily trend is bullish and the 4h setup is armed with 95% confidence, but the 1h ATR of 0.034036 tells us volatility is still compact, which means a squeeze is possible. The 15m RSI at 56.43 confirms room to run without being overextended. The entry zone between 2.4078 and 2.4248 aligns perfectly with the 1h price of 2.4166, giving a precise risk-defined level. TP1 at 2.4776 and TP2 at 2.5184 represent
NEAR+3.77%
#Gate广场中秋团圆局
What That Wick to $2.34 on LSK Really Tells Us? It's Not Panic Time, It's Planning Time
Looking at the LSK/USDT chart right now and what I see is not a classic FOMO chart. This is an attempt by a sleeping project to wake up.
That massive green candle around 23:00 last night... from $0.25 to $2.3480. LSK Spot is +21.86% on Gate, Perp is +14.33%. 24h volume is 18.11M LSK, about $17.36M turnover. That's 20x a normal day.
Most people see this wick and feel like they "missed it". I think the exact opposite. This wick gave us 3 very clear pieces of information:
1. What Happened Technica
LSK+18.64%
BTC+1.57%
ETH+1.63%
  • 7
  • 2
##JPMorganRaisesMeta$820
JPMorgan Raises Meta Price Target to $820: A Strong Signal for Investors
JPMorgan’s decision to raise its price target for Meta to $820 has placed renewed attention on the company and its long-term growth prospects. Price-target revisions from major financial institutions can influence market sentiment because they reflect analysts’ changing expectations regarding earnings, advertising performance, artificial intelligence investment, user engagement, and future business growth.
Meta has developed from a social-media company into a diversified technology platform with
META+0.59%
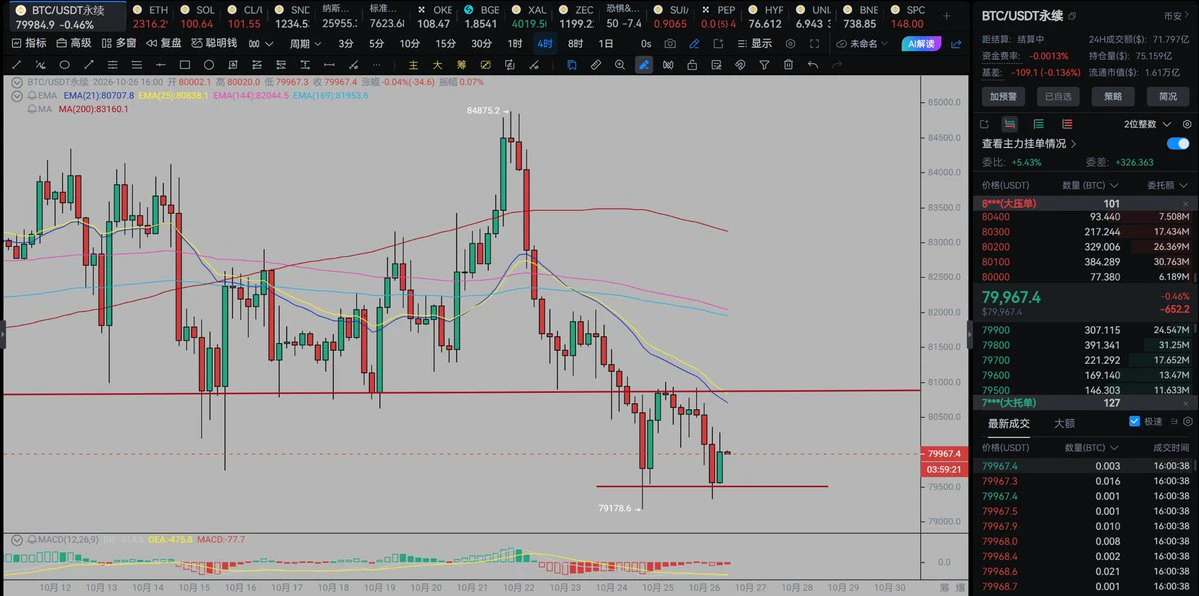
Would you dare to make a move at BTC $77,800?
Look at the surface first: negative catalysts are bombarding the market, but the price isn't collapsing.
After pulling back from the 80k high over the past week, BTC is still up 20%+ over the past month. The market is trapped in a rectangular range between 76,300 and 81,300, unable to move either higher or lower. Everyone is shouting that “rate hikes will cause a crash,” but BTC simply refuses to break below 76,000. Don't rush—wait for the FOMC signal.
First point: There is an 85% probability of a rate hike, but the market may have already finished
post-image
BTC+1.57%
ETH+1.63%
SOL+1.86%
My buddy who trades stocks told me that holding on to profits is the hardest part. Stay steady, don’t rush into trades, and patiently wait for the right opportunity! Today’s market action was still pretty good; let’s see how things look tonight!
post-image
UK FCA eyeing bespoke rules and fund exemptions for tokenized gold; industry warns uncertainty could slow development and curb investor access. [no ticker implied]
post-image
XAUUSD-1.47%
Everyone watching $CVC /USDT long is about to get blindsided by a hidden short setup.

$CVC /USDT - SHORT

Trade Plan:
Entry: 0.03552 – 0.03710
SL: 0.04392
TP1: 0.03060
TP2: 0.02680
TP3: 0.02109

Why this setup?
Why now? The 1h price sits at 0.03637 inside a range-bound daily trend, and the 15m RSI reads 48.48, signaling weak momentum that favors bears. The 1h ATR of 0.00317 confirms enough volatility to reach the entry zone near 0.03631, where a short gets triggered. From there, TP1 at 0.03060 and TP2 at 0.02680 define the measured move down, while the invalidation level at 0.02600 is the
CVC+41.30%
#Gate24HFuturesOpenInterestTops$11.479B 🚀📊
A major milestone for the Gate trading ecosystem! Gate’s 24-hour futures open interest has topped $11.479 billion, highlighting strong market participation and growing activity across the platform.
Open interest is an important metric in the derivatives market because it reflects the total value of active futures positions. Rising open interest can indicate increased trader participation and growing interest in the market, while also providing valuable insights into overall trading activity and market sentiment.
Reaching this impressive level demons
post-image
By this person’s logic, does any coin become dead simply because it has fallen a lot?
What’s wrong with FIL falling from 237 to 0.7? Can’t it rise to 5 in the future? What about 10?
BCH has also suffered major drops before, and ETH once fell below $100. Aren’t they still going up and down as usual?
The market naturally goes up and down, so you can’t just look at how much something has fallen in the past and say it has no chance in the future.
You can check the original post yourselves and see whether what he said actually makes sense👇
Original post:
Make your own decisions about your own mone
post-image
FIL+24.64%
BCH-0.29%
ETH+1.63%
📈 Witness the real returns of top traders!
Top signal providers’ 7-day ROI ranking
🥇Rainy Day Without Rain: +315%
🥈Mr. Mi: +175%
🥉Little Waves Panning for Gold: +138%
Instead of blindly feeling your way forward, copy success directly. One-click copy trading lets your returns run on their own!
🔗 Follow now: https://www.gate.com/copytrading
#跟单 #交易高手 #收益
CopyTrading
📈 Witness the real returns of top traders!
Top signal providers’ 7-day ROI ranking
🥇Rainy Day Without Rain: +315%
🥈Mr. Mi: +175%
🥉Little Waves Panning for Gold: +138%
Instead of blindly feeling your way forward, copy success directly. One-click copy trading lets your returns run on their own!
🔗 Follow now: https://www.gate.com/copytrading
#跟单 #交易高手 #收益
repost-content-media
Macroeconomic events are relatively packed this week, and the market will most likely not be too calm.
The three things most worth watching this week are:
First, the Federal Reserve will announce its rate decision early Thursday morning. The market has already pushed expectations for a September rate hike to around 90%, so what really matters this time is not just whether it raises rates, but also the Fed’s guidance on subsequent policy and how its economic projections and dot plot change.
Second, the CLARITY Act will face a key procedural vote. This concerns the further clarification of the r
post-image
How many bears are still left in ZEC?
ZEC made a pullback to 1041 earlier today, forming a minor double-bottom pattern, and then quickly rebounded,
Judging from the price action over the past few days, ZEC has gradually stabilized above 1000—it is no longer what it used to be!
Only a break below the key 1002–1029 range would bring ZEC back to three digits.
If ZEC rebounds to the 1152–1181 range without breaking through, go short directly. Short-term targets: 1063–1029.$ZEC
post-image
ZEC+5.03%
[Mid-Autumn] [Super Macro Week]
live-cover
LIVE2,234
@elonmusk Just confirmed #Grok 4.8: 2.5T parameters, trained on an entirely new C++ software stack; base training wraps up this week, followed by RL. Two days ago everyone was still talking about 4.7, and now it has jumped straight to 4.8—the iteration cycle hasn’t slowed down; it’s actually accelerating.
The innovation and value aren’t in “adding yet another few hundred billion parameters.” The real value lies in that new C++ stack: if training/inference efficiency truly takes a major leap, the payoff won’t be chatbots becoming 10% smarter, but more reliable long-horizon Agent tasks, fewer to
post-image
Why is everyone suddenly whispering about SYMBOL at 102.97?

$BZ /USDT - SHORT

Trade Plan:
Entry: 102.80 – 103.14
SL: 104.60
TP1: 101.75
TP2: 100.93
TP3: 99.70

Why this setup?
Why now? The daily trend is range, which means momentum is fading and a directional move is overdue. The 1h ATR of 0.680365 shows volatility is compressed, setting up for a sharp expansion on breakdown. The 15m RSI at 54.44 confirms the market is not yet overbought, allowing room for sellers to push price from the 102.97 entry zone toward TP1 at 101.75 and TP2 at 100.93. The invalidation level at 100.23 is the hard
BZ+2.00%
#BrentWTITop$100
Brent and WTI Top $100: A Major Signal for Global Energy Markets
Brent and West Texas Intermediate (WTI) crude oil prices moving above the $100 per barrel level would represent a major development for global financial and energy markets. Oil remains one of the most important commodities in the world, influencing transportation, manufacturing, electricity generation, inflation, government revenues, and consumer prices. When benchmark crude prices reach such an elevated level, the impact can extend far beyond the energy sector.
Brent crude is widely recognized as an internation
布伦特和 WTI 站上 100 美元 - 地缘风险升温,油价突破关键关口#布伦特 #WTI #地缘风险 #油价突破 #今日热点话题
Brent and WTI Above 100 Dollars Why Geopolitical Risk Just Pushed Oil Through Its Most Important Level
For the first time since July, both global oil benchmarks have reclaimed triple digits. Brent crude futures pushed to 101 dollars and 34 cents, touching intraday highs near 101 dollars and 40 cents and in some sessions reaching as high as 108 dollars and 68 cents. The physical dated Brent benchmark, against which roughly two thirds of the world's physical supply is priced, has now traded above 100 dollars since September 3 acc
post-image
discovery
布伦特和 WTI 站上 100 美元 - 地缘风险升温,油价突破关键关口
#布伦特 #WTI #地缘风险 #油价突破 #今日热点话题
Brent and WTI Above 100 Dollars Why Geopolitical Risk Just Pushed Oil Through Its Most Important Level
For the first time since July, both global oil benchmarks have reclaimed triple digits. Brent crude futures pushed to 101 dollars and 34 cents, touching intraday highs near 101 dollars and 40 cents and in some sessions reaching as high as 108 dollars and 68 cents. The physical dated Brent benchmark, against which roughly two thirds of the world's physical supply is priced, has now traded above 100 dollars since September 3 according to LSEG data. West Texas Intermediate followed closely, trading around 94 to 96 dollars and settling with gains of more than 3 percent on the week.
This breakout is not being driven by OPEC production cuts or by stronger than expected demand from China. It is being driven almost entirely by a rapid escalation in military risk across two of the world's most critical shipping corridors.
On one side is the Strait of Hormuz. The conflict between the United States and Iran, now in its seventh month, saw its largest attacks on shipping to date this week. The United States destroyed five Iranian crude oil tankers in a single operation, the most direct strike on energy infrastructure since the conflict began. On the other side is the Red Sea, where Houthi forces have stepped up attacks on Saudi oil facilities, forcing tankers to reroute and adding days to delivery schedules.
The physical market is reacting faster than the futures market, which is typical during supply shocks. Futures contracts reflect delivery a month out, while physical dated Brent reflects cargoes that need to be replaced immediately. When a buyer suddenly loses a cargo due to a tanker being hit, that buyer must enter the spot market that same day and bid for an alternative, which instantly pushes physical prices above futures.
Analysts who cover shipping are now warning of a deeper and more prolonged disruption. The broadening of the conflict threatens to risk even deeper disruption to oil supplies that had already left the market scrambling to adjust. That view was echoed by market strategists who noted that Brent pushing through the 100 dollar level will be seen by many in the market as a significant event in the current scheme of things, with implications far beyond energy.
Those implications are already showing up in equities and bonds. The S and P 500 closed lower as oil soared, while Treasury yields moved toward their 2023 peaks. Higher oil feeds directly into inflation expectations at a time when the Federal Reserve is already weighing whether to keep rates elevated. Goldman Sachs noted that the energy surge may make FOMC voters who had previously been ambivalent more open to hiking, as front month Brent rose 2 point 9 percent to 107 dollars and 66 cents and WTI rose 2 point 4 percent to 102 dollars and 48 cents in some late sessions.
For consumers, the question is what comes next for gasoline. With futures for Brent reaching 100 dollars for the first time since July, the path to 120 dollars is now openly discussed on trading desks if the conflict in the Strait of Hormuz and the Red Sea does not de escalate quickly. For now, the market has established a new floor above 100, and traders are treating that level not as a spike but as the start of a new and more volatile regime for oil pricing.
$XTIUSD $XBRUSD $IMO $BOIL $MUR
repost-content-media
  • 2
Load More

Join 40 M users in our growing community

⚡️ Join 40 M users in the crypto craze discussion

💬 Engage with your favorite top creators

👍 See what interests you

Trending Topics

AnthropicPicksNasdaqForIPO

72k Views2.65k Discussing

The related rumor has heated up valuation discussions around unlisted AI companies and also linked SpaceX's secondary-market performance with primary-market sentiment. However, it remains an unconfirmed market rumor for now.

Gate 24H Futures Open Interest Tops $11.479B

4.05k Views134 Discussing

Korea Stocks Plunge 3.14% at Open

44.7k Views4.79k Discussing

View More