Share crypto content and earn up to 60% commissions through content mining.
placeholder
gatefun
He bought a Bitcoin bar for $500 in 2012. It included 100 real Bitcoins.
A few months ago, he sold it for $10 million 🤯.
BTC-0.55%
View Original
post-image
  • Reward
  • Comment
  • Repost
  • Share
Where is $TOAD ARMY?
post-image
  • Reward
  • Comment
  • Repost
  • Share
How’s the situation? Facts speak for themselves!
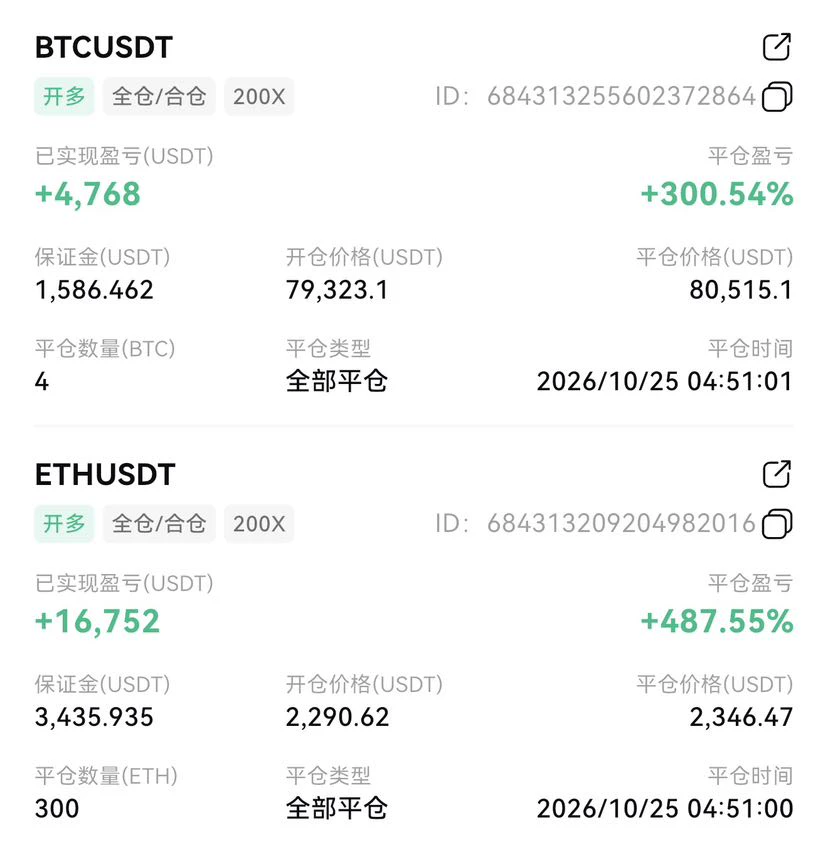
Another day of precise strikes!
BTC easily delivered a 1,600-point pullback from within the range
XAU easily delivered a 108-point pullback from around 4695
When opportunities arise, only those who dare to seize them can reach greater heights; standing on the sidelines only leaves you treading water
BTC-0.55%
XAU-1.56%
View Original
post-image
post-image
post-image
post-image
  • Reward
  • Comment
  • Repost
  • Share
#BTC回调至79000美元 Can the BTC and ETH rally still be chased? Latest assessment on August 27
I believe this rally is not simply a “technical rebound.”
There are 3 core factors:
① A shift in U.S. fiscal policy
The U.S. Treasury has expanded buybacks of long-term U.S. Treasury bonds, the dollar has weakened, and the “currency debasement trade” is heating up again, benefiting BTC and gold at the same time.
② Institutional funds are re-entering the market
Last week, U.S. spot BTC ETFs saw net inflows of approximately $1.92 billion, a new single-week high for 2026; on August 26, BTC ETFs still recorde
BTC-0.57%
ETH0.25%
GLDX-1.45%
PAXG-1.54%
View Original
post-image
post-image
  • Reward
  • Comment
  • Repost
  • Share
AI & Semiconductor Market Trends
gate liveLIVE
1,740
live-coin
  • Reward
  • Comment
  • Repost
  • Share
NVIDIA just dropped Q2 numbers and the AI infrastructure story is still very much alive.
Revenue came in strong, EPS beat expectations, and the focus quickly shifted to the next wave — Vera Rubin ramp and continued hyperscaler spending. Data center demand isn’t slowing down the way some people hoped. If anything, the conversation is moving from “will AI spending continue?” to “how fast can the next generation of chips get deployed?”
What’s interesting right now:
Blackwell is still ramping hard
Rubin is already in the conversation for the second half
Big Tech and AI-focused cloud players are st
NVDA-2.91%
post-image
  • Reward
  • 3
  • Repost
  • Share
InversePyramid:
Data center demand is extremely strong—the bottleneck is indeed on the supply side.
View More
$XBRUSD $XTIUSD
#GateStockInsightsChallenge
Oil Pullback, Hormuz Normalization and Bitcoin at $78K: One Macro Story Connecting Both Markets
The oil market is going through a major repricing phase on August 26, with XBR around $88.65 and XTIUSDT around $82.55, while Bitcoin is holding near $78,000–$79,000 after briefly breaking above $80,000. At first glance, crude oil and Bitcoin appear to be completely different markets, but the current move shows how closely they can become connected through inflation, interest-rate expectations, liquidity and overall risk appetite. Oil is falling as
XBRUSD0.67%
XTIUSD0.86%
BTC-0.55%
NVDA-1.42%
post-image
  • Reward
  • Comment
  • Repost
  • Share
This move is so obvious I don’t even have to use my brain—the account is dancing on its own. Right after I saw the bearish news, $ASTEROID was still stubbornly holding up, but selling pressure was crushing it, and every rebound came with barely any volume. There was simply no one catching it below. I didn’t take a heavy position either, just tested the waters with a light position; the entry was comfortable enough anyway. Shorting this kind of chart is going with the trend, not against it.

Hold as long as the trend remains intact; get out once it breaks down. Don’t fall in love with a stock.
ASTEROID-1.91%
ZEC-0.44%
BNB0.35%
View Original
post-image
  • Reward
  • Comment
  • Repost
  • Share
I originally wanted to go to the forum and rant, but then I looked at my balance and thought, forget it—the market is always right. When $GUN was just dumped early in the session, it faked a drop and then bounced back, looking like it was about to reverse, but the volume gave it away—the baiting-the-bulls vibe was way too strong. I directly flagged the short setup around 0.009799. Looking at it now, it has already slid down to 0.003186, bringing a +669.34% profit—enough for a good meal. The buildup was genuinely grueling, and the breakout is genuinely impressive. Brothers, pay attention to you
GUN2.02%
ADA-3.84%
SOL-1.06%
View Original
post-image
  • Reward
  • Comment
  • Repost
  • Share
With this kind of move, I don't even need to think—the account is dancing on its own.

The short opened at 0.02269—just glanced at 0.01995, and the +236.9% is already in the bag.

While everyone else was running, I specifically kept an eye on $BILL 's intraday chart. Several pushes upward all fell just short, and buying support was pathetically weak. Wasn't this short practically being handed out for free?

Take 80% off first, hold the remaining 20% with a protective stop, and don't be greedy for the last bite. Profit in hand is the only real profit.

For coins you're not confident about, t
BILL1.47%
ZEC-0.44%
LAB1.56%
View Original
post-image
  • Reward
  • Comment
  • Repost
  • Share
$MU#MU
MU Analysis - Micron Consolidating at 940.97 After 1,036.10 Parabolic Spike
Micron Technology, Inc. is consolidating after a vertical rally from 737.88 low. MU is trading at 940.97 dollars up 8.38 points or +0.89 percent. Intraday range is 945.67 high and 924.60 low with Open 925.74 and Prev Close 932.59. Range percent is 2.25 percent. P/E TTM 21.287, P/E LFY 124.077, Market Cap 1062.67B dollars.
The 4h chart shows a clear reversal structure. From July 22 around 1000 dollars, MU dropped sharply to 737.88 on Aug 3 with capitulation wick, forming the bottom. From Aug 3 bottom, it rall
MU0.38%
post-image
  • Reward
  • 3
  • Repost
  • Share
YamahaBlue:
LFG 🔥
View More
I had just finished lunch and was checking the charts when this price action felt seriously off. When $DRIFT dumped in the morning session, I stared at the chart for quite a while—the support was far too weak. Every rebound was just fuel for the bears; not shorting this setup would have been doing myself a disservice.
And the result? The short entered at 0.03371 has now dropped to 0.01228, delivering a juicy +630.51% gain. Feels amazing—this time, the market insisted on feeding me, and I opened my mouth and took it.
As for the trade, 70% has already been taken in profit, and the stop-loss on t
DRIFT2.34%
SOL-1.06%
DOGE-3.43%
View Original
post-image
  • Reward
  • Comment
  • Repost
  • Share
Yeah, run it 🕹️🌀🌪️
post-image
  • Reward
  • Comment
  • Repost
  • Share
#NVIDIAEarnings
NVDA After Earnings: The Market Is Trading the Guidance, Not Just the Numbers
NVDA closed around $213.05, up about 2.2% on the latest session, with extended trading around $213.82. The important shift is that Nvidia has moved from an earnings-event setup into a price-discovery phase. The stock had been near $211–$212 before the report, so the first task for bulls is turning the $213–$215 area into support rather than another rejection zone.
The volume confirms that this is not a quiet move. Recent data showed roughly 98M shares traded in one session, while options activity was
NVDA-1.42%
post-image
post-image
  • Reward
  • Comment
  • Repost
  • Share
#BTCPullbackto79000
BTC Market Structure: The $80K Decision Zone
Bitcoin is trading around $78.3K, down roughly 1% over the last 24 hours, but the bigger picture is still strong. BTC has climbed about 7% over the past seven days, recovering sharply from the mid-$60K area and pushing into the $80K region. The important point now is that momentum has moved from recovery into a major resistance test.
The recent rally was not a normal slow grind higher. BTC moved from around $64.5K on August 17 to above $81K this week, with several sessions carrying unusually high volume. August 21 alone recorded
BTC-0.59%
post-image
post-image
  • Reward
  • Comment
  • Repost
  • Share
LTC 4-hour timeframe, bearish signal armed.

$LTC /USDT - SHORT

Trading plan:
Entry: 49.73 – 49.97
SL: 51.00
TP1: 48.99
TP2: 48.42
TP3: 47.56

Why focus on this setup?
Why now? Because the 4H trend is clearly SHORT, and the 55.4 confidence threshold has been triggered. The key level is 49.85; breaking below 50.39 invalidates the setup, with TP1 at 48.99 to the downside. The 15-minute RSI is 46.4, not oversold, so there is still room to move lower. ATR at 0.477 indicates mild volatility, making it suitable for taking profits in batches. The 1D trend is range-bound, but bears dominate on the
LTC-1.77%
View Original
post-image
post-image
  • Reward
  • Comment
  • Repost
  • Share
$NVDA#NVDA
NVDA Analysis - Nvidia Correcting to 210.87 After 227.91 Top
Nvidia Corp is in a corrective phase after a strong rally from 190.01 low. NVDA is trading at 210.87 dollars down 2.11 points or -0.99 percent on the day. Intraday range is 213.60 high and 209.47 low with Open 212.64 and Prev Close 212.98. Range percent is 1.93 percent showing low volatility session. Market Cap is 5103.78B dollars with P/E TTM 32.242 and P/E LFY 42.968.
The 4h chart shows the full move from July 22. Base around 200-210 dollars, sharp drop to 190.01 on Aug 2-3 with capitulation wick, then impulsive rall
NVDA-1.42%
post-image
  • Reward
  • 3
  • Repost
  • Share
YamahaBlue:
LFG 🔥
View More
$TROLL COMMUNITY LETS DANCE!
TROLL-4.50%
post-image
  • Reward
  • Comment
  • Repost
  • Share
Load More

Join 40 M users in our growing community

⚡️ Join 40 M users in the crypto craze discussion
💬 Engage with your favorite top creators
👍 See what interests you
  • Pinned