
Share your thoughts
placeholder
Article
#GateTopsGlobalGrowth 🚀 Gate’s Global Growth Is Becoming Harder to Ignore
The crypto market is no longer just about who has the biggest trading volume. The real competition is about global reach, user growth, product depth, liquidity, and the ability to keep traders active across different market cycles.
That is where Gate’s global expansion becomes interesting.
As the crypto industry continues moving toward broader adoption, exchanges that can combine deep liquidity, diverse trading products, strong infrastructure, and a growing international community have a clear advantage.
For me, the big
post-image
  • 7
#ShareWeekly #GateMeme
This is not just a hype correction, it's a shakeout. And shakeouts are the best buying opportunities - if you pick the right coin.
What's Happening with Robinhood Chain Memes?
Robinhood launched the chain in July for tokenized stocks, but what took over the chain was memes.
The data is very clear:
• The Pons platform generated $5.95M in fees in a single day. With this figure, it ranked 4th among all protocols on DefiLlama - leaving Pump.fun ($4.64M) behind and even surpassing the Robinhood Chain it runs on. • On the same day, 25,000 new tokens were launched on Robinhood
discovery
#ShareWeekly #GateMeme
This is not just a hype correction, it's a shakeout. And shakeouts are the best buying opportunities - if you pick the right coin.
What's Happening with Robinhood Chain Memes?
Robinhood launched the chain in July for tokenized stocks, but what took over the chain was memes.
The data is very clear:
• The Pons platform generated $5.95M in fees in a single day. With this figure, it ranked 4th among all protocols on DefiLlama - leaving Pump.fun ($4.64M) behind and even surpassing the Robinhood Chain it runs on. • On the same day, 25,000 new tokens were launched on Robinhood Chain, with daily DEX volume reaching $544M. • In the correction on September 7th, MEME fell 25.8% in 6 hours, PONS fell 14.8% in 24 hours.
So the hype hasn't cooled down, only leverage and quick profits were flushed out.
What Do the Charts Say? $PONS vs $MEME
$PONS/USDT - Currently: $0.62924 +11.37%
The run that started from $0.10357 on 08/27 topped at $0.97332 on 09/05. Then it had a healthy 46% correction down to the $0.52095 support. Now it has given the first recovery signal by climbing above EMA5 (0.60204) and EMA10 (0.58894). MFI 54.61 - neither overbought nor oversold, a perfect accumulation zone. With 24h volume of 32.67M PONS and $18.4M turnover, it is still the most liquid asset on the chain.
$MEME/USDT - Currently: $0.0005353 -1.62%
A more speculative structure. After the $0.0005789 top, it had a sharp wick to $0.0004906 (15%+ flash crash) and is still struggling to recover. 7-day performance is -4.51%, today is also -0.50% negative. There is volume (36.98M) but turnover is only $19.81K - meaning whale exits create deep drops.
My Pick: $PONS for Buying the Dip - Why?
There are two types of coins in the meme market: Story and Infrastructure.
$MEME is a story. The community is strong but it has no revenue, no burn, no utility. It's purely sentiment-driven.
$PONS is infrastructure. What Pump.fun did on Solana, Pons is doing on Robinhood Chain.
1. It charges a 1% fee on every transaction, leaving 70% to the creator and 30% to the protocol. 2. With the money left in the protocol treasury, it buys back PONS from the market and burns it. According to its documentation, 29% of the circulating supply (293M PONS) has already been burned. 3. The platform has produced 646,000 tokens from 167,000 unique creators. This means a new wave can come after every dip.
That's why choosing $PONS in this dip is like buying shares of the meme coin factory, not a meme coin itself. Even if the hype ends, the factory keeps printing money.
This is a shakeout. Weak hands have been washed out, fees are still in the millions. I'm not staying on the sidelines, I'm gradually accumulating the dip on the PONS side.
Note: Not financial advice. Do your own research.
$MEME $PONS

repost-content-media
PONS+20.72%
MEME-1.22%
PUMP+3.99%
  • 1
📈 Three Metrics to Understand Gate’s Growth Momentum
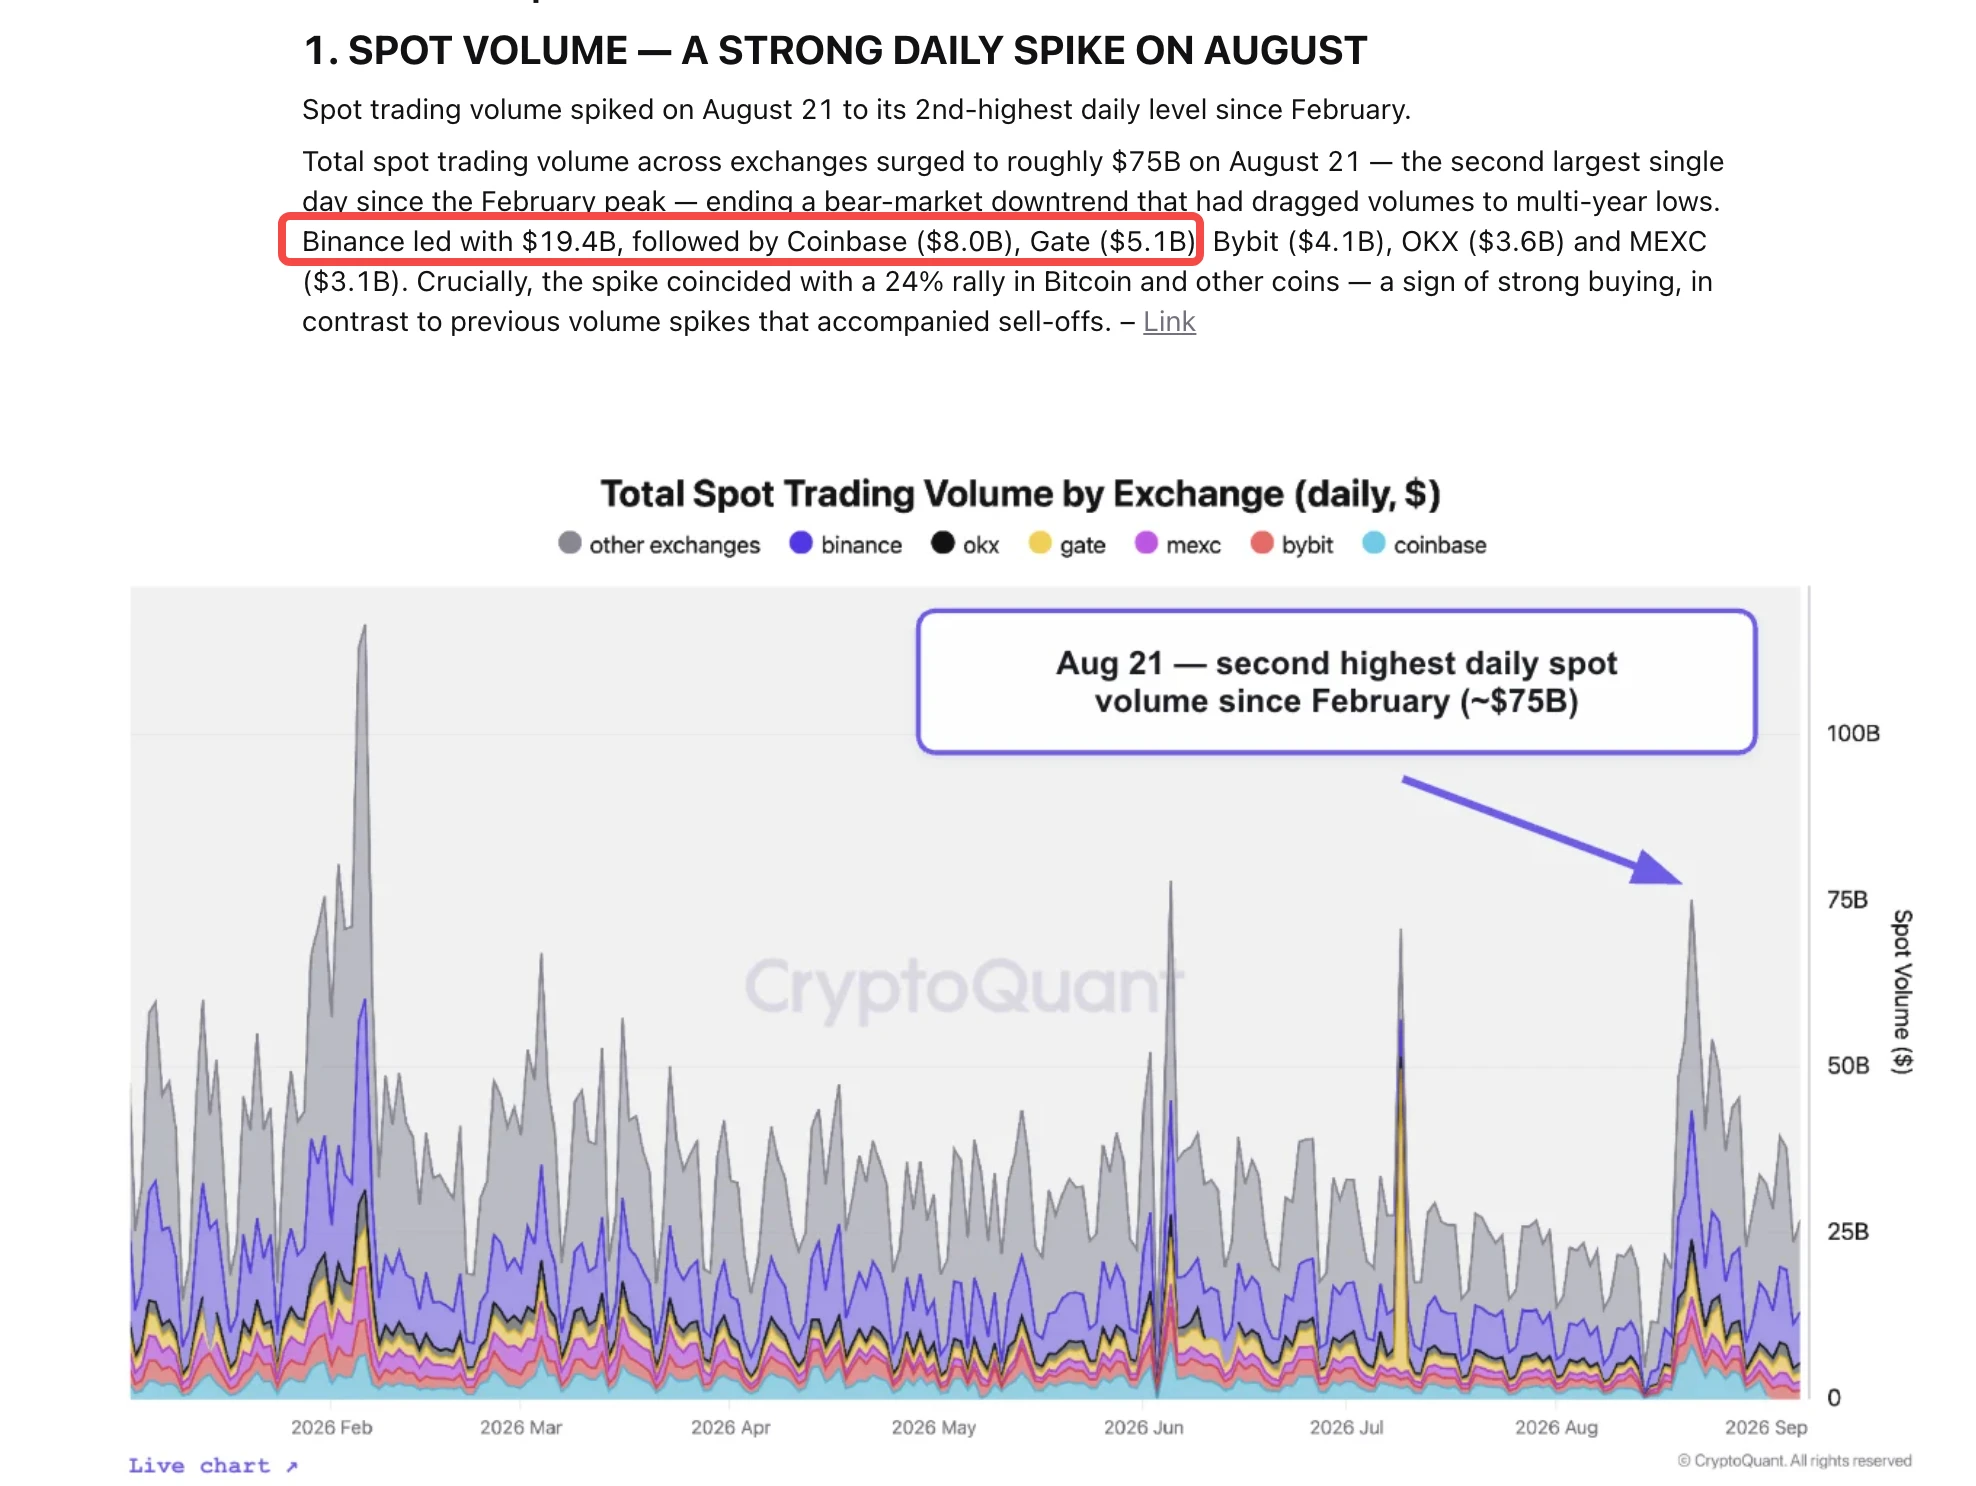
Crypto market activity is picking up, and recent data highlighted by CryptoQuant puts Gate’s growth under the spotlight. 👀
Three numbers stand out:
🥉 Top 3 globally in spot trading volume
🥇 +667% spot 30-day growth — No. 1 globally
🥉 Top 3 globally in derivatives trading volume growth
These numbers tell a more interesting story when viewed together.
It’s one thing to have a large trading volume and rank among the leading global exchanges.
It’s another thing to show a significant increase in activity over a relatively short period.
And w
GateSquare
📈 Three metrics to see Gate’s growth rate.
CryptoQuant’s latest report shows:
🥉 Top 3 globally in spot trading volume
🥇 Spot 30-day growth of +667%, ranking No. 1 globally
🥉 Top 3 globally in derivatives trading volume growth
Spot trading volume is increasing, while spot and derivatives trading activity are also growing simultaneously.
Rankings show strength, while growth rates show trends.
What do you think is most worth watching about Gate’s growth this round? 👀
👇 Post with the hashtag #Gate增速全球第一 to discuss:
Trading volume, liquidity, products, or the growing number of users entering the market?
👉 View the full report:
https://cryptoquant.com/insights/research/6aa7aaca26ed15760f9ca834-14-September-2026-Volume-Comeback-Exchange-Trading-Volume-Spikes-Into-The-Bull-P?utm_source=twitter&utm_medium=sns&utm_campaign=research&utm_content=special-crypto-report
repost-content-media
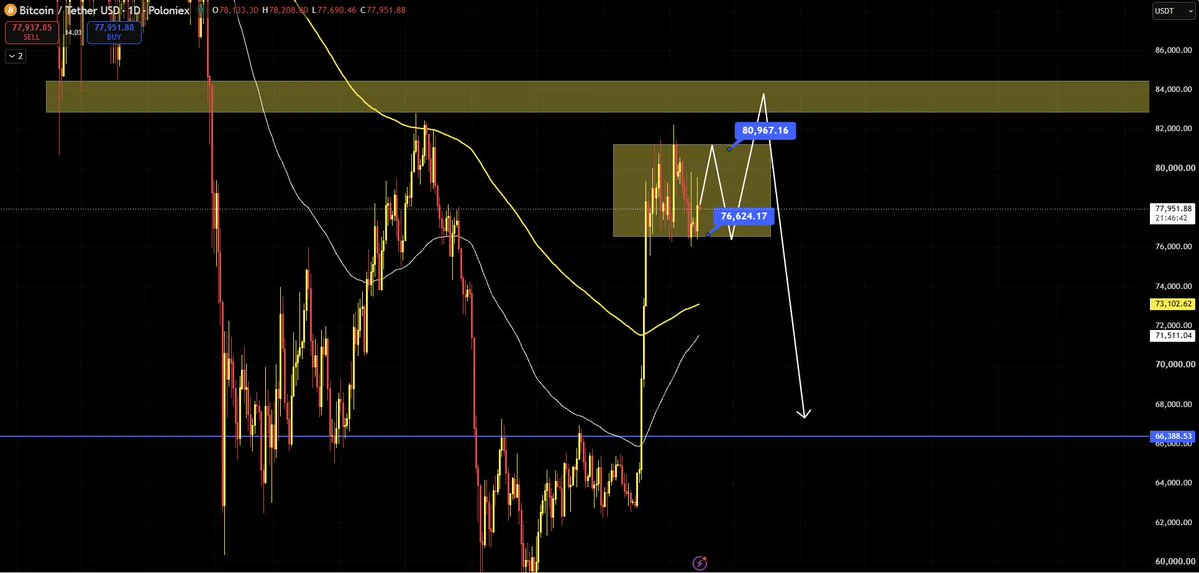
This could be an extremely volatile week for both the #crypto and #gold markets.
There are several major events and key pieces of news on the calendar, including the #CLARITY Act, the Fed’s interest-rate decision, and the Bank of Japan’s interest-rate decision.
This creates a scenario where #BTC could remain highly volatile, trading within the $76.5K–$81K range. This could be a good trading range to look for opportunities and potentially make profits throughout the week.
However, keep in mind that this range could also become a major liquidity zone that determines the next medium-term trend.
S
post-image
BTC+0.91%
According to Onchain Lens monitoring, Wintermute holds perpetual futures short positions worth approximately $102.1 million and is currently depositing more funds and increasing its short exposure. Data shows that its total exposure is $122.23 million, with unrealized profits of approximately $928.4k, losses of $12.04 million over the past 30 days, and cumulative historical profits of approximately $176.88 million. Its largest position is a short of 15.33k ETH, worth approximately $38.47 million.
post-image
ETH+0.77%
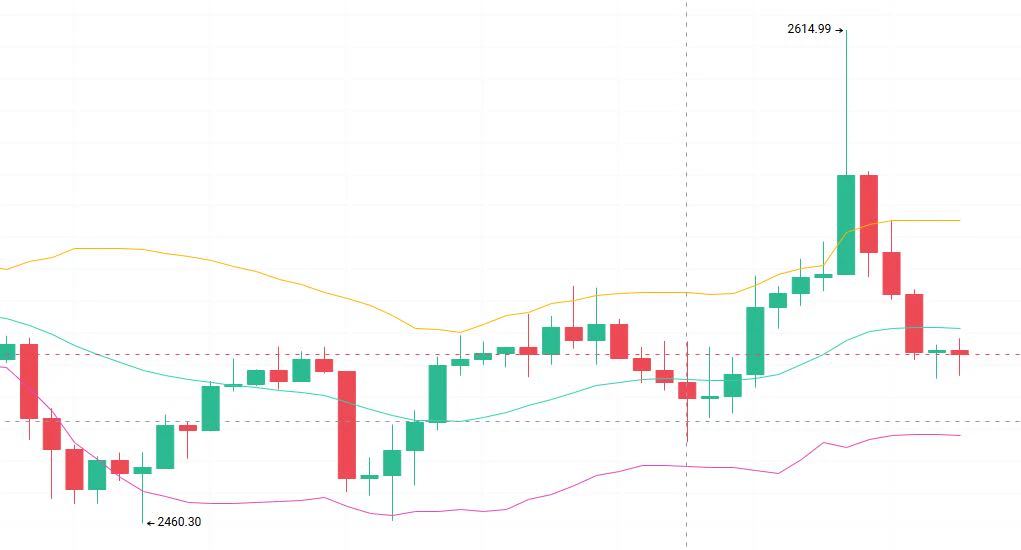
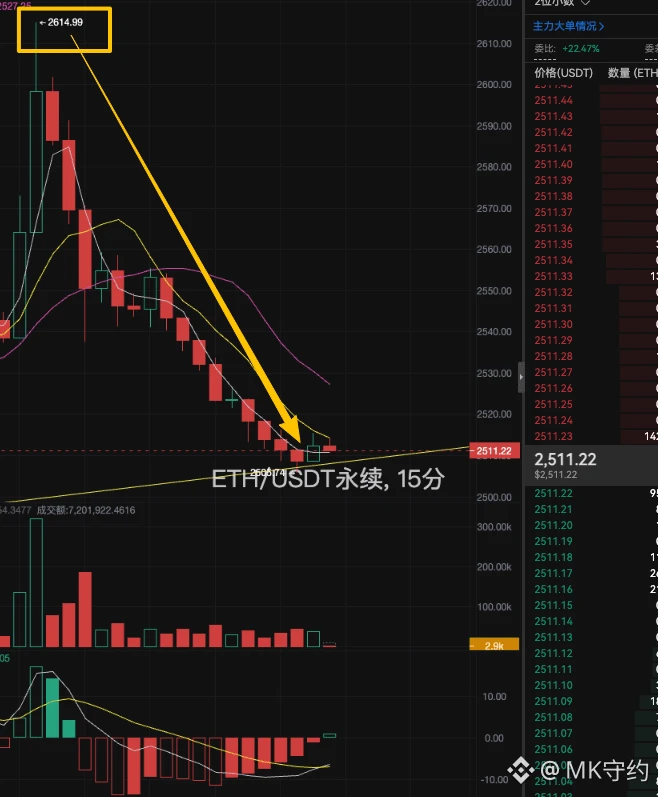
9.15 ETH Analysis
Analysis: Short near 2530-2550 on a rebound, with defense at 2580, the first target at 2500, and the second target at 2460
On the 1H timeframe, the chart began a rapid rally from the local low of 2460.30, climbing to a local high of 2614.99 before bullish momentum quickly faded. Concentrated bearish selling pressure drove prices steadily lower. The market is currently in a corrective recovery phase following the sharp rise, with bears holding the short-term advantage. The Bollinger Bands have shifted from widening to narrowing, with the upper band turning downward along with
post-image
ETH+0.75%
#GateUSExpandsTo37StateLicenses
I saw this update yesterday and honestly, it made me happy.
Sometimes we look at an exchange through the numbers we see every day — trading volume, new products, liquidity and user growth. But there is another side of growth that happens quietly in the background, and Gate US’s latest licensing milestone reminded me of that.
37 state-level licenses across the United States.
With the addition of the Massachusetts Money Transmitter License, Gate US has now reached 37 state-level licenses nationwide.
For me, the interesting part is not simply the number 37.
It is
  • 1
Trump blasts AI companies as hypocritical for calling for a slowdown in AI development for the safety of humanity.
Trump: “Don’t bullshit me. We’ve got to win the AI race—for me.”
In a new post, Trump also directly called Dario Amodei—the CEO of Anthropic—a “perfect little angel” and a hypocrite, while declaring that the U.S. must continue to stay ahead of China in the AI race.
post-image
Exit the short positions opened last night after taking profits; the bearish pressure has been fully released for now, so prioritize playing a rebound in the short term.
Bottom-side support and basing signals have emerged on the chart, while short-term downside momentum is slowing. Shift the morning strategy and look for suitable lows to build long positions, aiming to capture a rebound first in the short term!!
Insiders are calling this the setup before SYMBOL moons

$BTC /USDT - LONG

Trade Plan:
Entry: 77830.9 – 78035.5
SL: 76950.7
TP1: 78670.1
TP2: 79161.3
TP3: 79898.2

Why this setup?
Why now? The daily trend is firmly bullish and the 1h ATR of 409.378908 shows the market has enough volatility to fuel a strong move. The 15m RSI sitting at 65.38 means momentum is healthy without being overextended, leaving room for buyers to push higher. With the 1h price anchored at 77933.2, the entry zone between 77830.9 and 78035.5 offers a precise low-risk window to position. The first target of 78670.1 and
BTC+0.90%
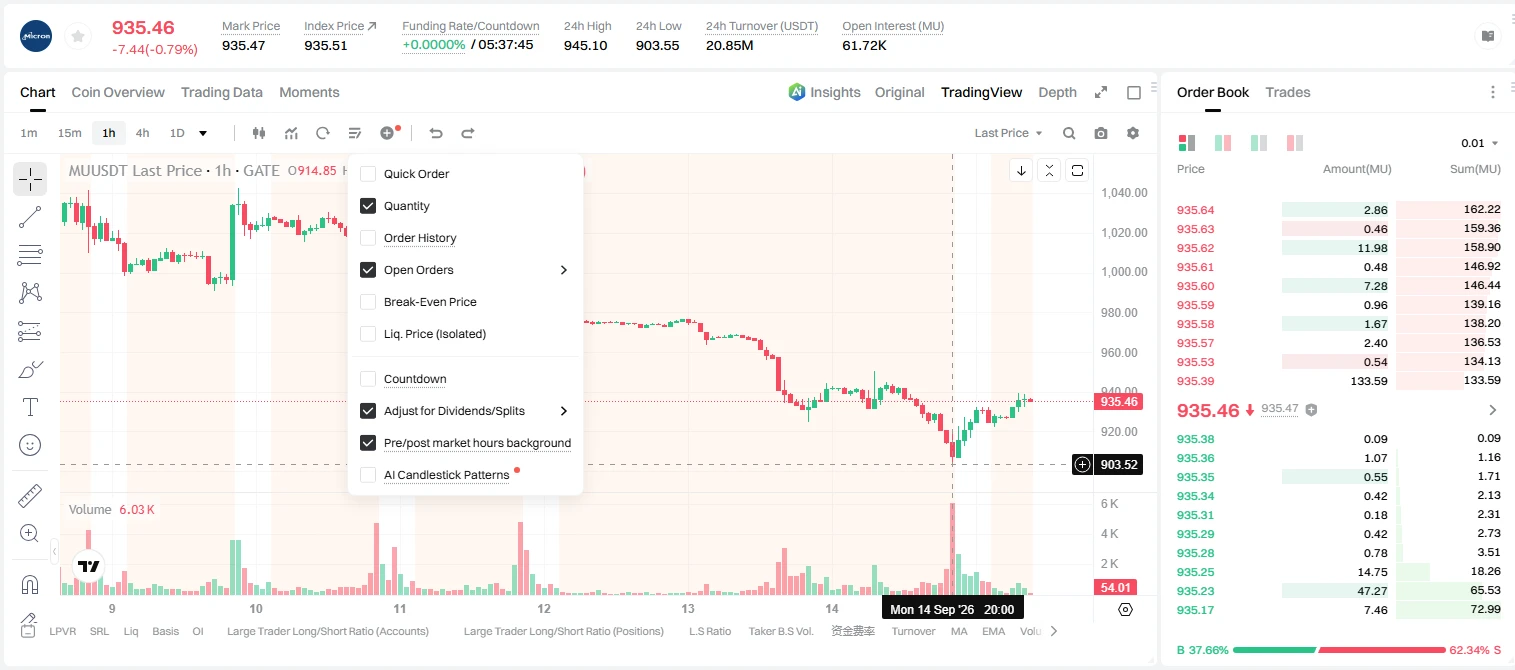
POV: You're shorting MU here while the daily trend stays range-bound.

$MU /USDT - SHORT

Trade Plan:
Entry: 934.1 – 937.5
SL: 952.3
TP1: 923.4
TP2: 915.2
TP3: 902.8

Why this setup?
Why now? The daily trend is still a range, so this short only makes sense as a tactical fade inside a broader sideways regime. The 15m RSI at 60.36 shows the 1h price still holds upward momentum, meaning sellers need a catalyst to reverse it. With the 1h ATR at 6.876409, each swing carries real risk, so the entry zone of 934.1 to 937.5 keeps you disciplined around the 935.8 reference. TP1 at 923.4 and TP2 at 91
post-image
MU-0.66%
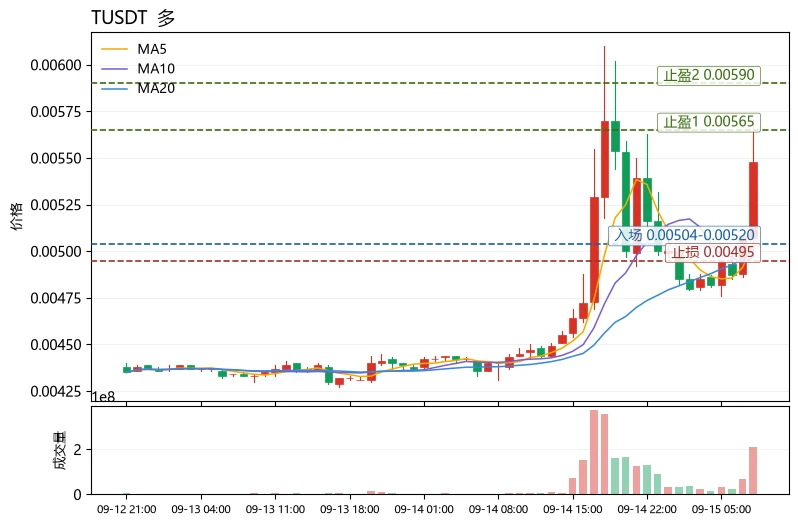
$T Short-term bullish, but it has entered the Bollinger upper-band resistance zone. Current price: 0.00548. MA5 has crossed above MA20, and the MACD histogram has turned positive. RSI at 65.6 is not overbought. The funding rate is -0.6439%, with shorts paying, and the short-squeeze structure remains intact. Consider entering on a pullback to 0.00504 (MA5). Take-profit 1: 0.00565 (Bollinger upper band); take-profit 2: 0.00590. Set a stop-loss below 0.00495 (below MA20). Also monitor: $PLUME and $MET are relatively stronger.
(Personal opinion for reference only; this does not constitute any in
post-image
PLUME+1.22%
MET-3.27%
$ETH This 100u drop is so smooth.
{future}(ETHUSDT)
post-image
ETH+0.77%
💬 PIONEERS — Tomorrow is the day. September 15. Two historic events. One date. 📅
🔹 CLARITY Act Senate vote — Potential regulatory clarity for digital assets
🔹 Protocol v27 mainnet upgrade — Smart contracts, DEX, and full ecosystem functionality
Both are happening on the same day. Both could redefine Pi’s future.
Let’s hope for the best outcome. 🙏
Are you ready for everything that’s coming?
PI+1.12%
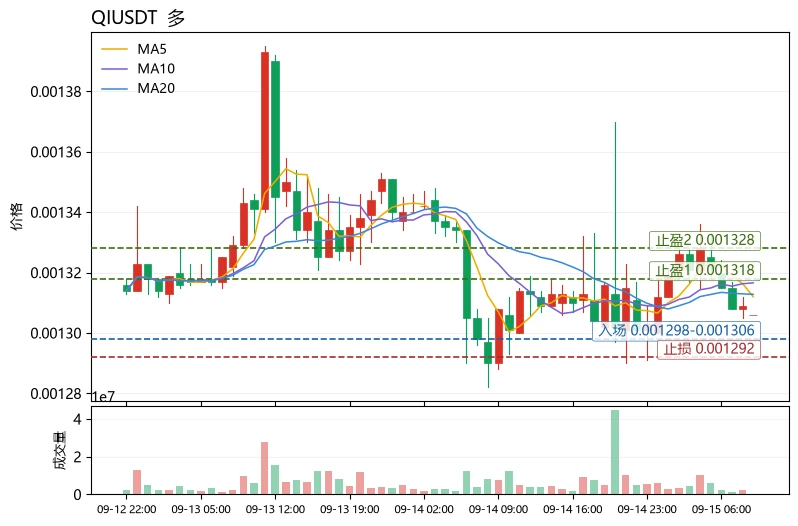
$QI Current price 0.001306. In the short term, key support is the lower Bollinger Band at 0.001298, with resistance at the upper Bollinger Band at 0.001328. MA5 at 0.001312 is slightly below MA20 at 0.0013128. The moving averages are converging and flattening, while the MACD histogram at -2.58e-07 indicates bearish momentum but is close to the zero line. RSI at 44.9 is weak but not oversold, with the direction favoring range-bound trading.
Strategy: Open a light long position in the 0.001298-0.001306 range, take-profit 1 at 0.001318, take-profit 2 at 0.001328, and stop-loss at 0.001292. Fear
post-image
ACH+1.45%
Insiders are fading SKHYNIX after the 1h spike

$SKHYNIX /USDT - SHORT

Trade Plan:
Entry: 1265.28 – 1271.98
SL: 1300.82
TP1: 1244.49
TP2: 1228.40
TP3: 1204.26

Why this setup?
Why now? The 1h price printed 1268.75 while the daily trend remains range-bound, creating a mismatch that favors short entries. The 15m RSI sits at 57.75, suggesting the recent pulse is still climbing but lacks momentum to break higher. A 1h ATR of 13.41145 confirms the candle is wide enough to justify a stretched entry near 1268.63. The first target of 1244.49 and the second target of 1228.40 align with the downleg
SKHYNIX-1.93%
#GateFuturesOpenInterestTop3
🚀 Gate Futures Open Interest Enters the Global Top 3 — Why This Number Matters
When I look at derivatives markets, I don't focus only on price. One of the metrics I watch closely is Futures Open Interest (OI) because it gives us a clearer picture of how much capital and positioning are currently active in the market.
And the latest data puts Gate among the Top 3 globally in Futures Open Interest. 📊🔥
For me, this is not simply another ranking. It is a signal that Gate's derivatives ecosystem has reached a scale where traders are actively using the platform for l
CryptoChampion
#GateFuturesOpenInterestTop3
🚀 Gate Futures Open Interest Enters the Global Top 3 — Why This Number Matters
When I look at derivatives markets, I don't focus only on price. One of the metrics I watch closely is Futures Open Interest (OI) because it gives us a clearer picture of how much capital and positioning are currently active in the market.
And the latest data puts Gate among the Top 3 globally in Futures Open Interest. 📊🔥
For me, this is not simply another ranking. It is a signal that Gate's derivatives ecosystem has reached a scale where traders are actively using the platform for leveraged positions, hedging, short-term strategies, and broader portfolio management.
💡 So, what exactly does Open Interest tell us?
Open Interest represents the total value of outstanding futures contracts that have not yet been closed or settled.
When OI rises, it generally means more positions are being opened and more capital is entering active derivatives positioning.
When OI falls sharply, it can indicate that traders are closing positions, leverage is being reduced, or the market is going through a major reset.
That is why I consider OI more than just a big number. It helps me understand the structure behind market activity. 👀
🏆 Why Top 3 is significant
The global derivatives market is extremely competitive. Traders have many exchanges to choose from, and maintaining high open interest requires more than simply attracting users.
It requires:
🔹 Deep liquidity
🔹 Active traders
🔹 Competitive trading infrastructure
🔹 Reliable order execution
🔹 A broad futures product range
🔹 Strong risk-management systems
🔹 Continuous market participation
Gate's position in the global Top 3 suggests that a significant amount of derivatives activity is being concentrated on the platform.
And this is particularly interesting when we look at the broader growth of Gate's ecosystem. 📈
The exchange has continued expanding its futures products while building a larger trading environment around spot markets, derivatives, Earn products, Web3 services, and other financial tools.
🔥 But there is another side to the story
High Open Interest does not automatically mean the market will go up.
This is extremely important.
Rising OI can accompany a bullish move when traders are opening long positions, but it can also increase during aggressive short positioning.
Therefore, I don't look at OI alone.
I prefer to combine it with:
📌 Price action
📌 Trading volume
📌 Funding rates
📌 Liquidations
📌 BTC dominance
📌 Support and resistance levels
📌 Broader macroeconomic conditions
That combination gives a much better picture of whether leverage is supporting a trend or creating additional liquidation risk.
⚠️ More leverage also means more risk
When Open Interest becomes very large, traders should remember that derivatives can amplify both profits and losses.
If the market moves sharply against heavily leveraged positions, liquidations can accelerate volatility.
That's why I personally believe risk management matters more than chasing every market move.
🎯 My takeaway
Gate reaching the global Top 3 in Futures Open Interest tells me that its derivatives market is no longer something to overlook.
It shows strong participation, growing liquidity, and increasing relevance in global crypto derivatives.
But the real question is not simply whether OI is high.
The real question is:
What are traders doing with that leverage? 🤔📊
That is the data I will continue watching.
For me, the next stage is about understanding the relationship between Open Interest + Volume + Price + Liquidations.
Because numbers become truly powerful when we understand the story behind them. 🚀
#Gate广场中秋团圆局 #weeklyshare #ShareWeekly #GateMeme @Gate_Square
repost-content-media
BTC+0.90%
Morning Market Updates
live-cover
LIVE2,391
The Scumbag's AI Conjecture
This week, by
Anthropic CEO Dario Amodei (Dario Amodei)
published a long article, “We Must Pace the Frontier,” whose core argument is that frontier large-model capabilities are improving too quickly, safety work has already fallen behind, and the industry should proactively slow the pace of capability iteration rather than halt training altogether.
The main point is that most current large-model iteration involves AI self-iteration, as if AI has acquired a certain ability to learn by itself, making it easy to exceed human control.
Many industry heavyweights have voi
Load More

Join 40 M users in our growing community

⚡️ Join 40 M users in the crypto craze discussion

💬 Engage with your favorite top creators

👍 See what interests you

Trending Topics

GateTopsGlobalGrowth

24.63k Views631 Discussing

According to the latest CryptoQuant data, Gate's spot trading volume ranks top 3 globally, with the fastest growth worldwide, while futures trading volume growth also ranks top 3 globally. Market activity is accelerating back, and Gate's growth momentum continues to lead. Market heat is back — are you mainly trading spot or futures these days? [👉 Full report:](https://cryptoquant.com/insights/research/6aa7aaca26ed15760f9ca834)

GateUSExpandsTo37StateLicenses

22.8k Views383 Discussing

AnthropicPicksNasdaqForIPO

72.66k Views2.75k Discussing

View More