Share your thoughts
placeholder
Article
This short entry was not early, but it was fairly comfortable to hold. After the sideways consolidation broke down, I only looked for an entry during the pullback confirmation. I entered with a protective level in place, setting the stop-loss near the previous high rather than trying to catch the bottom.
As the move continued, the profit was once quite decent. A quick rebound midway caused the account to give back a small portion. I did not panic because scaling out at 0.014417/20 had already locked in most of the profit; for the remainder, I simply gave it room as long as the protective level
post-image
XRP-2.11%
BNB-1.77%
The moon's closer than it looks.
#memecoins #crypto
post-image
  • 3
#HyperliquidTeamWithdraws38.14MInHYPE Hyperliquid Team Withdraws $38.1M — Details
The reported $38.1 million withdrawal linked to the Hyperliquid team has drawn attention across the crypto market because large on-chain movements can influence investor sentiment and short-term trading behavior. Hyperliquid is a major decentralized derivatives platform, and transactions involving wallets associated with its ecosystem are closely monitored by traders.
A withdrawal of this size does not automatically mean the team is selling HYPE tokens. Funds can be moved for treasury management, operational expe
HYPE-2.67%
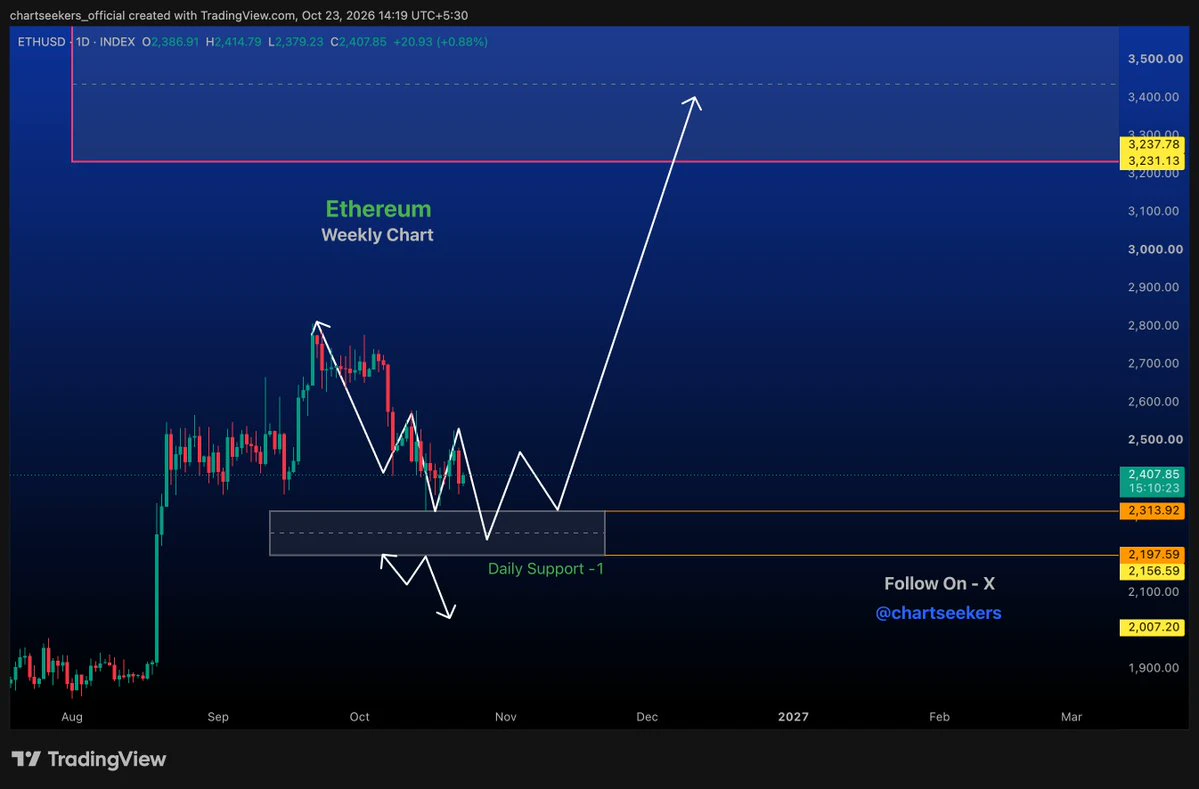
ETH Major Market Forecast: Steady Profits
live-cover
LIVE56
Everyone is missing the real move happening under the radar.

$XAG /USDT - SHORT

Trade Plan:
Entry: 66.28 – 66.40
SL: 66.93
TP1: 65.90
TP2: 65.61
TP3: 65.17

Why this setup?
Why now? The daily trend is range-bound, which often precedes a sharp directional break, and the 1h price is sitting at 66.35 with a 15m RSI of 57.18, showing neither overbought nor oversold exhaustion. The 1h ATR of 0.244384 means this asset is quietly building energy for a volatile expansion that most range traders will underestimate. With the entry zone between 66.28 and 66.40, a short bias targets TP1 at 65.90 and
XAG+0.03%
Everyone is sleeping on $LINK /USDT while the daily trend screams bullish and the 1h ATR hints at a massive move.

$LINK /USDT - LONG

Trade Plan:
Entry: 12.726 – 12.830
SL: 12.282
TP1: 13.150
TP2: 13.398
TP3: 13.770

Why this setup?
Why now? The 1D trend is firmly bullish, the 15m RSI sits at 41.78 showing room to run, and the 1h ATR of 0.206653 signals an explosive impulse is building. With the 1h price anchored at 12.778 inside the entry zone between 12.726 and 12.830, the setup targets TP1 at 13.150 and TP2 at 13.398, but the trade invalidates hard if the 1h price breaks below 11.785. T
LINK-2.62%
I did nothing, just left it hanging there. When it passed by, it found me in the way and casually pulled me out.
When I checked the chart after lunch, the rebound was still pretending to edge upward, while volume kept getting thinner. This kind of low-volume surge has no one to take over at the top and will only pin those chasing longs at the peak. The short position at 0.002429 just touched 0.001831, and 80% has been pocketed.
The market is designed to punish all kinds of defiance, especially those who think they are the smartest. Don’t get greedy for the last bite—bank the bulk first. Close
post-image
SOL-2.21%
SNDK-0.21%
This move doesn’t even require me to think—the account is dancing on its own 🕺 While everyone else was running, I kept my eyes on $XAU that key rebound level. The more I watched, the more something felt off, like there was a mountain pressing down from above. The rebound was weak, sell orders kept coming wave after wave, and volume didn’t expand at all. Every push upward was just short of breaking through. I tried a short at 4510.00, and it turned out I caught the rhythm perfectly—quick and decisive. Now at 4412.32, with +201.31% secured, it feels incredible. This stretch of waiting wasn’t in
post-image
XAU-0.54%
LAB-2.71%
XRP-2.11%
Stockmemecoin => Gold
I occasionally take profits. Whatever I withdraw is profit. I've made good gains in recent weeks.
post-image
We about to put the #VOLT in you 💹👀
RH is not playing ⚡️#pons
post-image
VOLT-16.72%
RH+0.98%
PONS-14.75%
I was just about to curse it out, but then I looked at my account and thought, never mind. Let it fall however it wants—I’ll keep quiet.

During the intraday plunge, it weakly bounced to around 0.06198. The trading volume looked half-asleep, bids were weak, and it was obvious it couldn’t go any higher. I placed a short order, and sure enough, it later ground all the way down to 0.05601, +236.19%. That profit felt great.

The operation wasn’t complicated: lock in 80% first, and set breakeven protection for the remaining 30%. Even if it bounces, it won’t touch my profits. With a coin you’re no
post-image
SNDK-0.21%
SOL-2.21%
XRP is about to break range and most traders are not ready for the move down.

$XRP /USDT - SHORT

Trade Plan:
Entry: 1.3938 – 1.3994
SL: 1.4231
TP1: 1.3767
TP2: 1.3635
TP3: 1.3436

Why this setup?
Why now? The daily trend is range, which often ends with a decisive break, and the 1h price is sitting at 1.3966 right at the entry zone of 1.3938 to 1.3994. The 15m RSI at 49.24 shows the market is neither overbought nor oversold, leaving room for a sharp directional push. The 1h ATR of 0.011034 means a single hour can easily cover the distance to TP1 at 1.3767 and TP2 at 1.3635 on a short bias.
XRP-2.11%
$SYRUP is showing some interesting momentum.
After trading around $0.194 at the start of September, Maple’s native token pushed above $0.22, briefly reaching around $0.234 before cooling off.
Today’s slight pullback doesn’t change the bigger picture:
Maple finance continues to expand its institutional lending ecosystem, while products like syrupUSDC, syrupUSDT and syrupUSDG continue bringing more capital and utility into the network.
Price moves come and go.
The real story is whether Maple finance can keep growing its fundamentals.
Stay bullish on $SYRUP
This is not a Financial Advice, Always
post-image
SYRUP-1.62%
$MU /USDT is about to expose the biggest range trap of the week.

$MU /USDT - SHORT

Trade Plan:
Entry: 1035.35 – 1037.39
SL: 1046.17
TP1: 1029.02
TP2: 1024.12
TP3: 1016.77

Why this setup?
Why now? The daily trend is a range, but the 1h price is sitting at 1036.37, right inside the entry zone where the 15m RSI has dropped to 35.35, signaling bearish exhaustion is setting in. The 1h ATR of 4.083077 confirms enough volatility to push the price from the entry_ref toward TP1 at 1029.02 and then TP2 at 1024.12. The invalidation level at 995.15 is the hard line that separates a clean short from
MU+1.47%
How is this a rebound? This is CPR for my empty short account, isn’t it? 💨 The $HEMI sell-off felt so satisfying to ride with a short position.

While the screen was glowing green, most people were looking for the bottom, but I was waiting for a signal that the rebound was over. It spiked to around 0.015588, failed to hold after two pushes, and kept losing momentum as it rose, with clear resistance above. I entered a short at the time without expecting much, but the price fell all the way to 0.008576, giving me unrealized gains of +886.22%. That bite of profit was very satisfying.

I’ve clo
post-image
HEMI-20.29%
BNB-1.77%
SNDK-0.21%
$XAUT /USDT is range bound, but something is about to break it lower.

$XAUT /USDT - SHORT

Trade Plan:
Entry: 4409.9 – 4414.5
SL: 4434.1
TP1: 4395.8
TP2: 4384.8
TP3: 4368.3

Why this setup?
Why now? The daily trend is range, which means the market is coiled and waiting for a directional catalyst. The 1h ATR of 9.135926 shows enough volatility to fuel a sharp move once price decides. The 15m RSI at 68.58 is not overbought enough to trap shorts, suggesting room for further downside. The entry zone sits at 4412.2, with TP1 at 4395.8 and TP2 at 4384.8, offering a clear risk to reward setup for
XAUT-0.45%
$RSTR
The move from 2M - 100M will be explosive.
There isn’t a world it doesn’t go mainstream, we saw it with Kabuto’s with pokemon cards.
This time we have the entire trenches working towards driving the price of Robinhood hats in RuneScape up causing all sorts of speculation across Reddit.
It’s literally the micro strategy of Robinhood.
Buying everything up driving the price astronomical.
The chart of the hat is WILD:
It’s legit a straight line up.
We all witnessed one guys efforts on pokemon, by himself. An army of degenerates with an austic dev live streaming the whole thing is the funnies
post-image
I had just switched the app to the background when it shot right back up—was it playing hide-and-seek with me? When I opened the market chart this morning, $BCH was still grinding along the bottom. Looking at the intraday chart, I thought: with this bottoming sideways action and buyers quietly getting stronger, how does this look like it’s about to crash?

That opening dip was practically handing out an entry, so I went with the flow and opened a long position at 247.31. Honestly, I wasn’t expecting it to take off immediately—I just felt this level was worth a try.

Then I switched back just
post-image
BCH-0.77%
BNB-1.77%
BTC-1.31%
While I was away using the restroom, I came back to find the candlestick chart had already wiped out my losses for me.
After lunch, I saw $MAGMA had returned to around 0.17163. It had bounced off that level several times without breaking through, and each key low was higher than the last, so I placed a long order. By the time I came back, the current price had reached 0.24465, with unrealized gains of +841.19%—the wait was worth it.
I took profit on 80% first and moved the stop-loss on the remaining 20% above the entry price. If it keeps charging, I’ll hold it; if it comes back, I won’t give t
post-image
MAGMA-2.52%
SNDK-0.21%
BTC-1.31%
Load More

Join 40 M users in our growing community

⚡️ Join 40 M users in the crypto craze discussion

💬 Engage with your favorite top creators

👍 See what interests you

View More