Square
Following
Hot
News
Profile
Share your thoughts
placeholder
Article
$KAS KASUSDT: one push to 0.043, a retest, then 0.045663?
Kaspa bounced hard off the lows and is now leaning on the falling trendline, like someone knocking on a door it already broke once.
KAS technicals:
Price bounced from the 0.038000 area, the green zones under price held, and right now it sits at 0.041310. It is above the blue and red moving averages, and RSI has turned up into the 60s. The descending trendline from the top and the green MA sit right on top of price, with the red supply boxes from the breakdown just above. My base case is one more push into 0.043, then a retest from abo
post-image
KAS-1.26%
$RHEA
Everyone’s watching the loud little tokens. $RHEA went up 33% and barely made a sound.
The whole token is worth about $17.5M, and about $400K traded today. This doesn’t look like a one-breath spike.
The price is $0.0886, a bit below today’s high of $0.098. What I’d watch: if the price dips, do buyers show up?
‍#GateSquare #ContentMining #ShareWeekly
post-image
RHEA+33.60%
So did you get at least 1% better this week or you can’t explain?
post-image
The two charts for $UNI are giving opposite answers: the short-term trend has turned, but the larger cycle refuses to acknowledge it.
This time, I’m not looking at the gainers and losers list, only the levels. The current price is 7.572, about 4.49% from the one-hour support at 7.232 and about 1.86% from the resistance at 7.713.
My criteria are simple: only a breakout above 7.713 followed by continuation would count as an upside follow-through; a break below 7.232 invalidates the original view. The one-hour chart is relatively strong, while the four-hour chart is relatively weak, with RSI at
post-image
UNI+3.80%
$ENA is just one step away from resistance; moving above it and holding above it are different
$ENA 24-hour +5.09%, current price 0.2228, just 0.81% away from the 1-hour resistance at 0.2246. This is the kind of position where an illusion most easily arises: briefly crossing above it intraday is mistaken for a completed breakout. The answer that truly carries weight is whether it can hold after crossing above.
The opposing case also has a clear invalidation line. Breaking below the 1-hour support at 0.2109 would show that short-term buying support failed the test; if the 4-hour support at 0.19
post-image
ENA+3.72%
#EthereumUpOver71%inQ3 #ETH
Ethereum’s Powerful Q3 Rally: Can ETH Maintain Its Momentum in the Coming Weeks?
Ethereum delivered an impressive performance in the third quarter, recording a gain of approximately 71%. This rally highlights renewed investor interest, stronger institutional participation, and improving market conditions. However, the next phase will depend on whether ETH can maintain buying pressure, overcome key resistance levels, and protect its important support zones.
With Ethereum trading around $2,509 in the supplied market data, traders must look beyond the quarterly percen
ETH+0.98%
BTC+0.66%
  • 5
  • 1
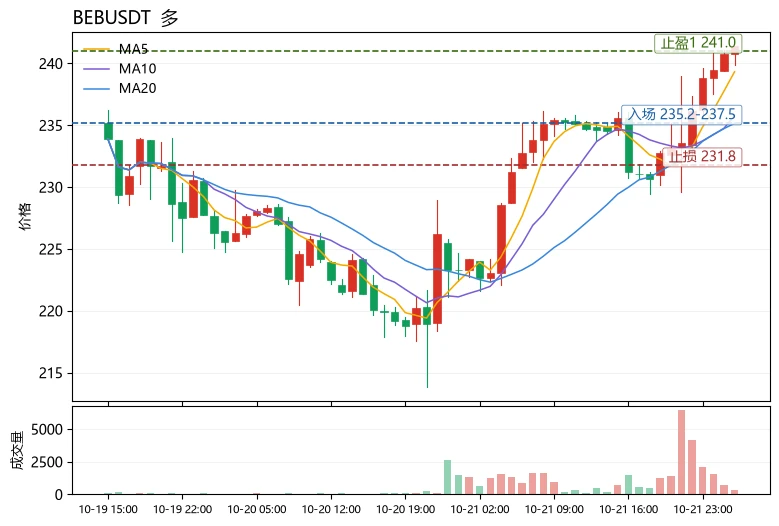
Insiders are quietly building a massive short position while everyone else is blind to the range.

$US /USDT - SHORT

Trade Plan:
Entry: 0.018710 – 0.019824
SL: 0.024609
TP1: 0.015260
TP2: 0.012589
TP3: 0.008582

Why this setup?
Why now? The 1h price is trapped at 0.019267 inside a tight range, the 15m RSI is at 27.41 signaling extreme exhaustion, and the 1h ATR of 0.002226 shows momentum is compressing before a violent move. The daily trend is range-bound, which means a breakdown from the entry zone between 0.018710 and 0.019824 could accelerate fast toward TP1 at 0.015260 and TP2 at 0.012
US-41.84%
The most unusual detail in today's market is that $OP
rose 11.82%, yet the MACD histogram remains bearish at -0.0003646—the new price high is diverging from the momentum indicator. Meanwhile, the funding rate of +0.0075% is clearly positive, indicating that this rally is driven by longs paying to chase higher prices rather than healthy spot buying. The 30-candle range is 19%, and volatility is elevated, so position sizes should now be reduced to less than half of the usual.
Structurally, MA5=0.1391 has just crossed above MA20=0.138955. The trend remains intact, RSI=62.6 is not yet overbought,
post-image
GRAM+1.76%
AERO+15.42%
🔹 Ethereum (ETH) falls below 2,700 USDT; 24-hour gains narrow to 0.20
live-cover
LIVE33
Floki all time high hype ath go
FLOKI+0.84%
82 million Samsung phones support SOL, but in reality, the US Galaxy Wallet has simply added a USDC cross-border remittance option, while also using Sui under the hood.
It only launched in the final week of October, covers eligible devices in the US, and requires identity verification. Users see Samsung Wallet, not Solana. Custody is handled by Coinbase, while the infrastructure is provided by Bastion. The number of phones does not equal the number of people who will use it, much less the amount of SOL purchased
post-image
SOL+1.17%
USDC0.00%
SUI+5.59%
COIN+4.30%
#CRCLLeadsCryptoStocks
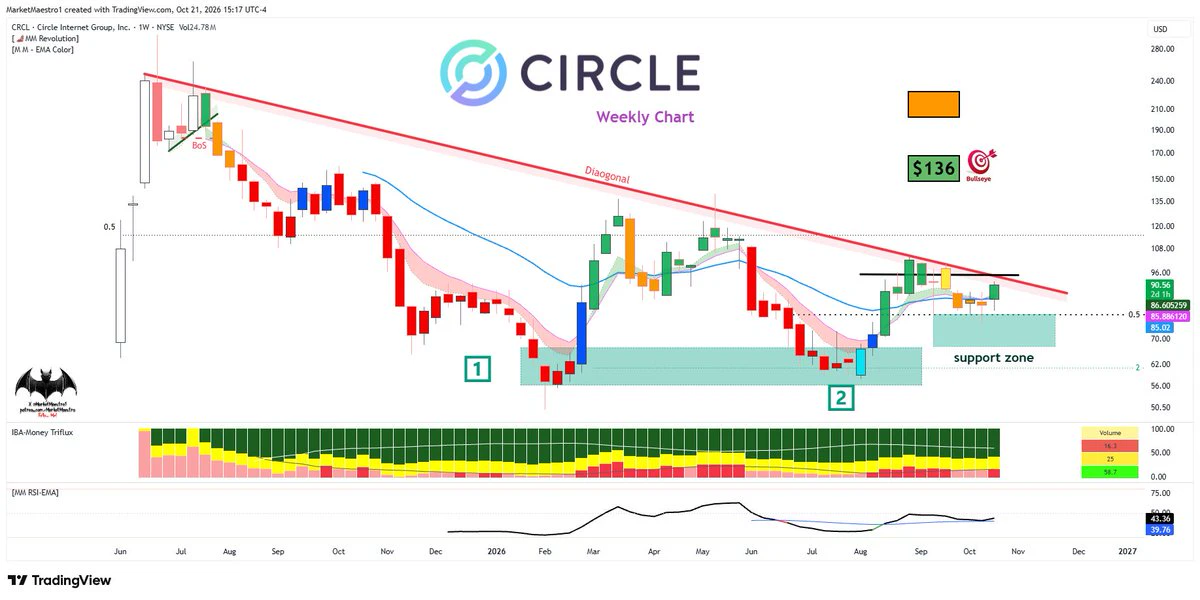
CRCL Climbs to $86.03: Can Circle Break Above $86.15? 📈
Circle Internet Group ($CRCL) is showing renewed strength as buyers push the stock toward its latest 24-hour high. With growing attention on stablecoins and digital payment infrastructure, Circle remains an important company to watch at the intersection of traditional finance and the crypto economy.
But the key question is simple: Can CRCL break through its immediate resistance and extend its recovery, or will sellers step in near the current high?
CRCL MARKET UPDATE
Here are the latest reported figures:
- Current
CRCL+4.51%
USDC0.00%
Stellar led tokenized fund market cap growth over 24 hours (+$17.1M), narrowly ahead of Ethereum (+$16.0M), then Polygon (+$5.9M), $BNB Chain (+$195.4K), and $AVAX (+$137.7K).
post-image
XLM+2.01%
ETH+0.98%
BNB+1.18%
AVAX+2.24%
Firmus, the Nvidia-backed data center company and one of the largest IPOs in Australian history, has suddenly pulled the offering. Global investors think AI valuations are too expensive and aren’t willing to take the other side. This signal is more direct than anything else: the AI rally is starting to get selective. Simply putting an Nvidia label on something won’t let you raise money indiscriminately anymore. If you’re holding related assets, first think about how to allocate your capital. Don’t set your stop-losses too tight—I had to get stopped out twice before I learned my lesson. If you
post-image
NVDA-0.52%
It's Saturday, where are we going today?
post-image
Never thought id be to the point where this is a normal amount of money to me.
post-image
Every time I come home, I’m reminded just how crazy my neighbors get around this time of year 😭
post-image
crypto trade today
live-cover
LIVE385
$CFX
UPDATE
#CFX is getting a good volume here. We can see 20%+ gain here ✍🏻
#CFXUSDT #CFXBTC #Bitcoin #NFTs
post-image
CFX+23.79%
BTC+0.55%
  • 4
Exit first, $ETH second Zhiying 2520
Bitcoin’s market hasn’t moved much; it was probably pushed up to this level by retail investors. Consider entering after it falls below 2500.
#Gate亮相TOKEN2049
AChenBit
10.10-10.11 Weekend ETH public trading plan
Prioritize executing $ETH long strategy
  Entry range: Light long near 2480 on a pullback; add near 2470
  Stop-loss defense: near 2460 (set according to position size; execute planB⬇️ after breaking below)
Take-profit levels
  First take-profit: near 2500 (touching the upper Bollinger Band)
  Second take-profit: near 2520 (resistance at the short-period high)
Third take-profit: near 2540 (medium-period high-volume trading zone)
Long-term target: near 2560 (establishing a long-term position in the pullback trend)
Trading factors: The narrowing Bollinger Bands indicate that after the sharp drop, the market has entered a narrow-range consolidation phase. Weekend volatility is limited, and weekend trading volume is contracting. For the range-bound market, first watch the first and second take-profit levels, then dynamically observe and analyze the trend on Sunday evening. After determining the overall trend for next week, watch the third take-profit level and the long-term target.
planB
If the entry range is not reached, the stop-loss at 2460 is broken, or the price breaks above 2520, execute the short strategy
Entry range: Wait for a high-level short above 2520 on a pullback; add near 2530
  Stop-loss defense: 2540 (unified stop-loss)
Take-profit levels
  First take-profit: near 2500
  Second take-profit: near 2480 (lower-band support)
Third take-profit: below 2460
Long-term target: below 2430
#Gate亮相TOKEN2049
#Ledger事件损失近9000万
#GateWCTCS9全球交易赛
repost-content-media
ETH+0.97%
Load More

Join 40 M users in our growing community

⚡️ Join 40 M users in the crypto craze discussion

💬 Engage with your favorite top creators

👍 See what interests you

Trending Topics

GateAtTOKEN2049

39.83k Views21.55k Discussing

Gate brought a series of major events to TOKEN2049 Singapore! From the official launch of Gate Money to the F1 Red Bull driver meet-and-greet and the Gate Gala, we witnessed a new chapter of "One Gate, Borderless Finance." Which moment from TOKEN2049 stood out most to you?

LedgerLossesNear90Million

39.08k Views199 Discussing

GateWCTCS9GlobalTradingCompetition

33.61k Views4.9k Discussing

View More