Share your thoughts
placeholder
Article
Everyone’s staring at DOGE’s 0.09087—but the real signal is the 4h timeframe that’s about to snap.

$DOGE /USDT - SHORT

Trade Plan:
Entry: 0.09059 – 0.09115
SL: 0.09351
TP1: 0.08889
TP2: 0.08756
TP3: 0.08558

Why this setup?
Why now? The 1D trend is *range*, not bullish—so any pop is a sell. RSI on 15m sits at 48.63, meaning no momentum to break higher. ATR on 1h (0.001102) shows tight coils—historically, that’s when shorts squeeze hardest. Entry at 0.09087 with a stop at 0.09351 gives you a 1:2.5 risk-to-reward to TP1 (0.08889). The alt setup is a trap—don’t chase 0.09285 when the daily i
post-image
DOGE+4.59%
I originally wanted to cut my losses and sacrifice the position to the heavens, but the ritual failed—the meat roasted itself. While everyone else was running, I noticed $LINK repeatedly being bought up around 11.416, with volume quietly recovering. At this level, there was no hesitation—I went long directly.
The market is waited out, and profits are held out.
It climbed step by step afterward, and I just saw 12.271. My unrealized profit had already reached +531.79%. This position has been a real treat, and the brothers on board should be laughing in their sleep. I’ll take 80% profit first, mo
post-image
LINK+4.16%
DOGE+4.59%
XRP+0.95%
Everyone’s cheering the 1D uptrend, but my 4h chart just whispered a dirty secret about HYPE.

$HYPE /USDT - SHORT

Trade Plan:
Entry: 87.624 – 87.974
SL: 89.980
TP1: 86.164
TP2: 85.073
TP3: 83.438

Why this setup?
- RSI on the 15m is already at 66.74—overheated in a downtrend.
- ATR (1h) at 0.6989 means volatility is ripe for a snap.
- The 1D bullish trend is the bait; the 4h SHORT (84 confidence) is the trap door.
- Entry zone 87.62–87.97, with TP1 at 86.16—that’s a 1.8% drop before the daily bulls even wake up.
- Why now? Because price is stalling right under 88.00, and the inval
HYPE+3.45%
Everyone’s long on $SKHYNIX /USDT while the 4h tape quietly flips—are you holding the wrong side?

$SKHYNIX /USDT - SHORT

Trade Plan:
Entry: 1285.21 – 1287.47
SL: 1300.40
TP1: 1275.80
TP2: 1268.77
TP3: 1258.23

Why this setup?
Why now? The 77.4 confidence short isn’t noise—it’s a range-bound 1D refusing to break higher. Entry sits at 1286.34, but the real tell is TP2 at 1268.77: a 1.36% drop before the 15m RSI (57) even cools off. With ATR at 4.5, momentum is tight, not explosive—this is a grind down, not a dump. The alt long scenario (TP1 1294.45) exists only if 1287.47 fails as resistanc
SKHYNIX+1.06%
after noon updates
live-cover
LIVE689
Why is everyone ignoring $USELESS /USDT right before a 95% confidence setup?

$USELESS /USDT - LONG

Trade Plan:
Entry: 0.22357 – 0.23205
SL: 0.18709
TP1: 0.25835
TP2: 0.27871
TP3: 0.30925

Why this setup?
- 4h bias is LONG with a 95 score—this isn’t a coin flip, it’s a weighted bet.
- 1D trend is bullish, and 15m RSI at 37.42 means we’re buying weakness, not chasing green.
- Entry zone: 0.22357–0.23205. TP1 at 0.25835 is a +13% move from ref. TP3 at 0.30925 is +36%.
- Stop at 0.18709 gives you a 2.4R on TP1—risk is defined, upside is asymmetric.
- The “Waiting” status means the tra
USELESS-9.32%
morning bath
coffee
a little reading
These are the kind of Sundays I like 🧘🏼‍♂️🍃
Can you believe the old-school privacy coin zcash:native actually surged above 1200USDT, breaking into the top ten by crypto market cap?
On the surface, this surge looks like capital lifting an old coin, but fundamentally it is the result of an extremely illiquid short squeeze combined with pressure from the token distribution structure. Most ZEC holdings have long since settled in shielded pools, leaving very little spot supply circulating in the market. Coupled with Grayscale trust products’ continued accumulation, every short position opened was precisely hunted down and blown up by the bul
post-image
ZEC+17.43%
ZEC Zcash. The price has moved above 1,000 into a new high range. The driver is not a meme: Grayscale’s spot ETF (ZCSH) turned positive on August 25 and its assets have continued to grow, compounded by short liquidations. Trading volume is often over $100 million, part of the same privacy-sector move as DASH’s rally yesterday, but ZEC has a larger market cap and stronger institutional participation.
$ZEC
post-image
ZEC+17.31%
I just casually hit refresh, and it went up on its own, leaving me totally caught off guard. $NVDAX Ten minutes of watching the chart is no match for one minute of letting it do its thing.

Don’t think I just got lucky. A few days ago, I was watching the chart after lunch in the afternoon. The price action was still grinding back and forth, but the signs of money quietly entering were already impossible to hide. As buy orders kept piling up during the bottom consolidation, the wicks in both directions showed that someone was making one last probe. A real trend reversal is often just one fina
post-image
NVDAX+0.42%
SOL+4.10%
ETH+1.74%
Only one of these prints in 2026.
$TAO at $1,000
or
$ONDO at $5
One is a supply squeeze on decentralized AI.
The other is a fee switch on tokenized Treasuries.
Both are real. Only one gets there first.
Pick one. Defend it in one line.
post-image
TAO+0.17%
ONDO+1.95%
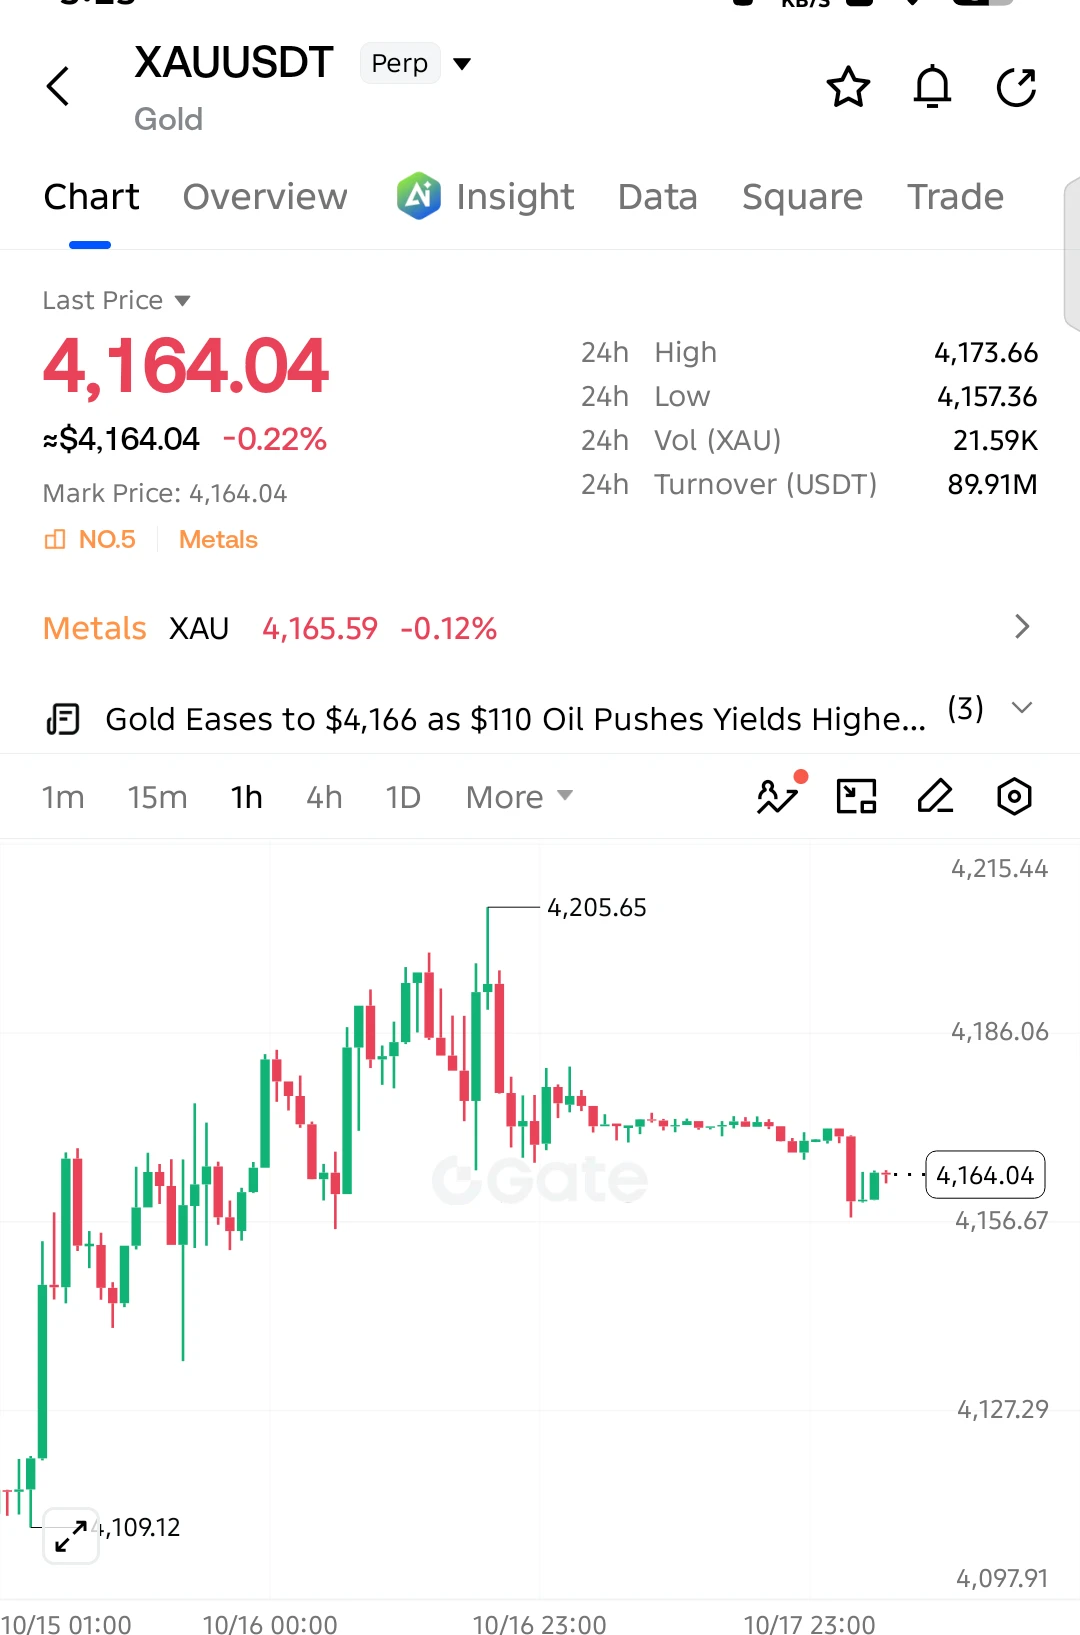
👉 #XAUUSD broke upward out of the descending channel. It retested, and under normal circumstances, this move would be expected to push the price up to $5000. However, the interest rate decision by the US will be important here. If they raise interest rates, this structure will be invalidated, and selling pressure will be observed for #Gold. If interest rates are left unchanged or lowered, the uptrend will technically continue. All eyes will be on the interest rate decision on September 16. Until then, we may see a sideways-to-positive outlook.
⚠️ This is not investment advice. The chart and c
post-image
What is your view on this year’s super El Niño?
post-image
$1000 to $100,000 Crypto Trade Challenge Today
live-cover
LIVE1,444
Brb going to church
post-image
This is referring to Jing Tian, right?
Is this claim actually true or false?
This trend is so clear, I don’t even need to think—the account is dancing on its own.

When I checked the charts after lunch, $BNB still looked half-dead, repeatedly pulling back to the key level without breaking below it. I watched for a few minutes and found that each key level was higher than the last, with a very clear bottoming consolidation pattern. A few nights ago, I was reviewing it before bed and judged that buying pressure was quietly strengthening, so I suggested going long and positioning in advance. No need for too much talk—I placed the orders according to plan.

Then this af
post-image
BNB+0.99%
ZEC+17.31%
SOL+4.10%
  • 1
$USELESS Give me some advice—should I run?
post-image
USELESS-9.33%
SLX/USDT is armed for a short—but 55% confidence means someone’s lying.

$SLX /USDT - SHORT

Trade Plan:
Entry: 0.06925 – 0.06953
SL: 0.07074
TP1: 0.06838
TP2: 0.06771
TP3: 0.06670

Why this setup?
- 1D trend is **range**, not trend—so we’re fading the 4h pop, not chasing momentum.
- RSI 15m at 49 = zero impulse; price is stalling right at the 0.06939 pivot.
- The invalidation is tight at 0.06961—only 22 ticks above entry. That’s a sniper zone, not a swing.
- TP1 at 0.06838 is a 1.5% drop; TP3 at 0.06670 is a 3.9% dump if the range breaks down.
- Why now? ATR 1h is 0.000561—volatili
SLX-0.77%
$BTC Bitcoin Weekly, Recovery Approaches a Key Resistance Zone
Bitcoin has recovered strongly from its recent weekly swing low, but the recovery is now approaching an important resistance zone at 82,850–83,929.
This zone combines the May swing high with the 38.2% Fibonacci retracement of the decline from 126,199.63 to 57,800.19. This confluence makes it an area to watch for confirmation, rather than assuming that the broader downtrend has already reversed.
A weekly close above 83,929, followed by sustained trading above the zone or a successful retest, would strengthen the recovery scenario. T
BTC+0.41%
Load More

Join 40 M users in our growing community

⚡️ Join 40 M users in the crypto craze discussion

💬 Engage with your favorite top creators

👍 See what interests you

View More