Square
Following
Hot
News
Notifications
Profile
Share your thoughts
placeholder
Article
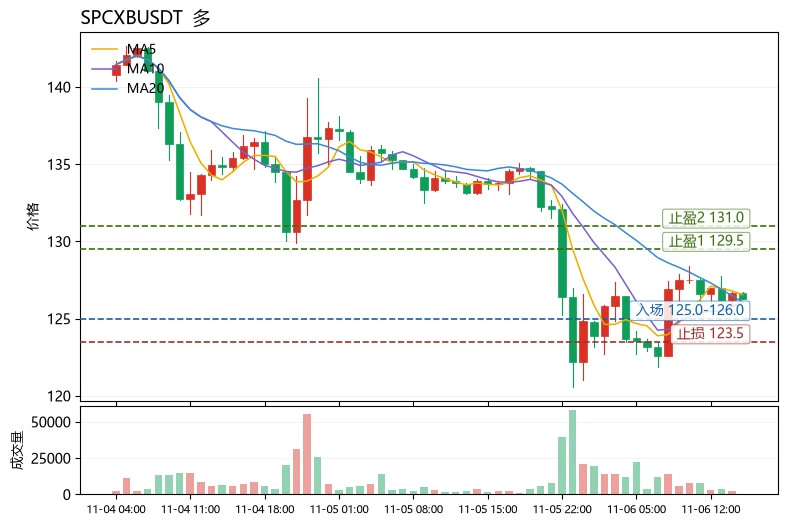
$SPCXB The most unusual detail today is not the drop, but the moving-average structure: the price fell 5.77% in 24 hours, yet MA5 remains above MA20 (126.554 versus 126.081), and the MACD histogram is still positive at +0.4746. This indicates the decline is taking place within a bullish alignment, making it a pullback rather than a trend breakdown—an ideal example for illustrating a reusable method: to judge whether a trend is healthy, first check the relative positions of the moving averages, then see whether momentum indicators are diverging, and finally use the Bollinger Bands to locate the
post-image
SPCXB
SPCXBSpaceX
Four.meme
MC:$3.12KHolders:2
0%
WLFI-0.16%
Picked an Iranian lawmaker
This is too entertaining—now things are about to get interesting.
Trenches
ZIG
Z
bade
b
ZIG
0x8c...1145
Market Cap
$.
Change
.
24h Vol
$.
Holders
.
BTC
B
bade
b
BTC
C5xp...pump
Market Cap
$.
Change
.
24h Vol
$.
Holders
.
STONK
S
bade
b
STONK
6GmA...UNgx
Market Cap
$.
Change
.
24h Vol
$.
Holders
.
DESSA
D
bade
b
DESSA
npz2...pump
Market Cap
$.
Change
.
24h Vol
$.
Holders
Diamond
D
bade
b
Diamond
5VCE...pump
Market Cap
$.
Change
.
24h Vol
$.
Holders
.
Before getting excited about a new crypto project, take a closer look.
Check its website.
Read its documentation.
Understand its tokenomics.
Look into its team and community.
Research the risks.
A little homework can make a big difference. DYOR!
#DYOR #CryptoResearch #Altcoins
post-image
$BIRB I missed out on 20 points by selling too early this time, but I don’t regret it one bit.
I got in at 0.081, watched it for three days, and sold at 0.093. Then today it hit a high of 0.1055, up 22.96% in 24h, with 69.4M in trading volume. You think that stings? It does. But if I could do it over, I’d still sell at 0.093. Why? My entry strategy was to capture the most certain part of the move—the fish’s body. The tail has too many bones, and I don’t have the teeth for it.
Let’s review the trade. I bought at 0.081, when the 24h low was 0.0807, so I was basically buying right at the intraday
BIRB-16.68%
  • 6
  • 1
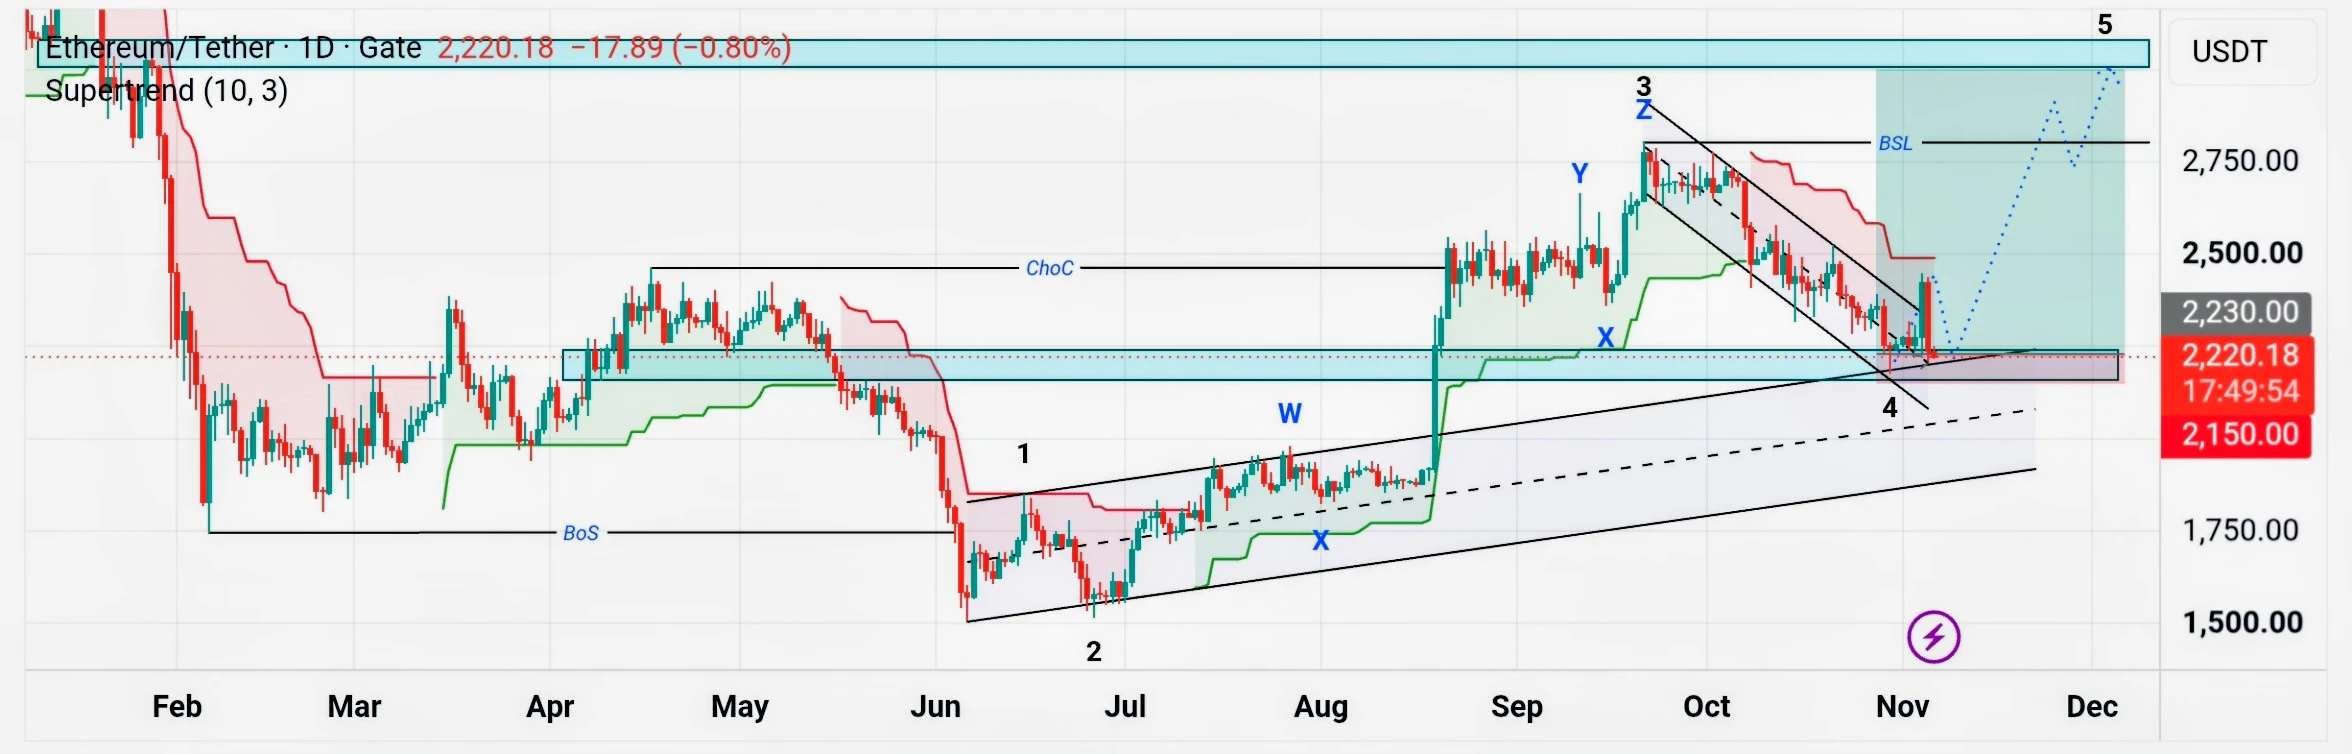
$ETH ‌-After the price broke out of the wave 4 channel shown in the chart, it immediately reversed back inside. Interpreting the price action this way, it could potentially be the formation of a micro wave 2, setting up for a bullish wave 5.
-Those with a bearish outlook might view this as a "false break."
-Therefore, using the most recent low (wave 4) as an invalidation level is a prudent risk management step for any long positions.
post-image
ETH-1.26%
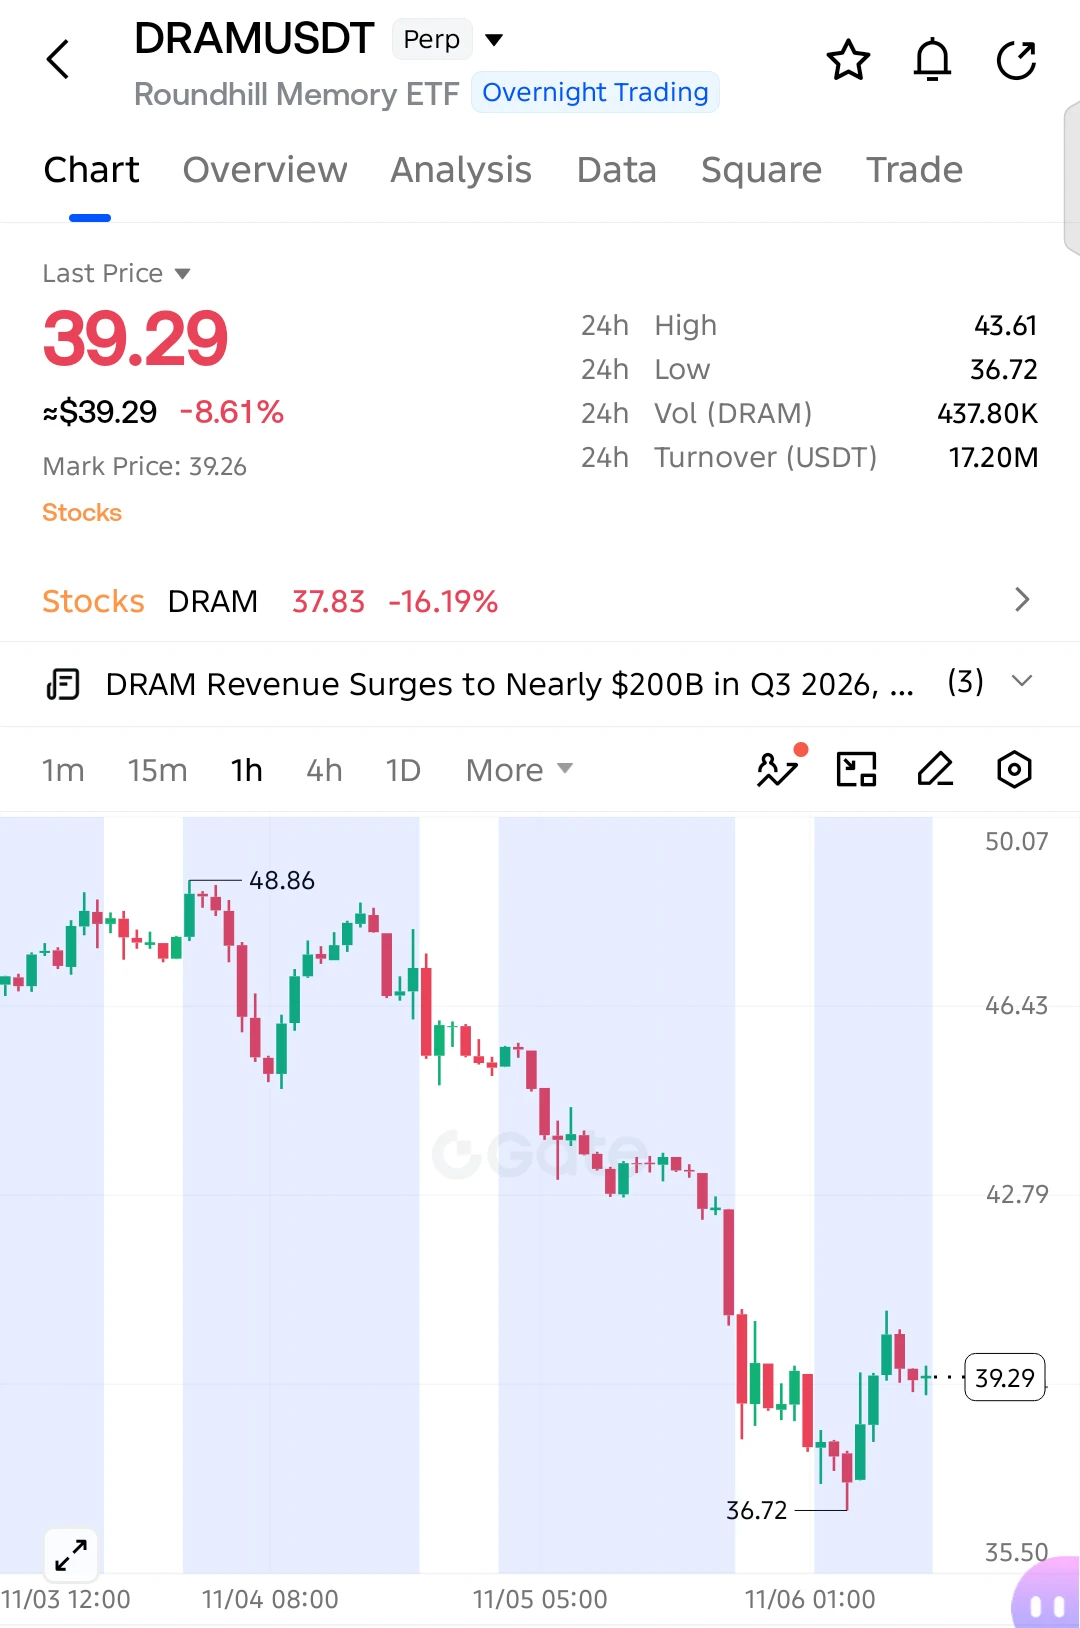
$DRAM SHORT SETUP — BEARS STILL IN CONTROL!

$DRAM is down 8.61%, and sellers continue to dominate despite a small recovery from 36.72. Another downside move could be developing!

Entry: 39.29
SL: 41.10

TP1: 38.20
TP2: 37.30
TP3: 36.72
Final Target: 35.50

The chart shows a clear bearish structure with lower highs and continued selling pressure. The recent rebound is struggling to gain momentum, and another rejection below 40.50 could send price back toward 36.72.

Invalidation: A sustained recovery above 41.10 weakens the bearish setup.
post-image
DRAM+0.02%
  • 3
  • 2
$PI Xiaopaipai took 2 Viagra pills and was relatively erect and firm.
post-image
PI-0.60%
🔹South Koreas KOSPI Plunges 8, Triggering a Trading Halt! Losses Narrow After Trading Resumes. Are
live-cover
LIVE2,274
Friday, how should we respond to continued market pressure?
On the 4-hour chart, after consecutive corrections, the overall trend remains weak, but the decline has failed to extend further. Bollinger Bands are moving sideways; MACD has formed a bullish crossover and is moving up, while the three KDJ lines are diverging downward in a bearish formation, showing clear disagreement between bullish and bearish indicators. The current price is in a low range, with no signs of further downside for now. After a short-term wick rebound, we are temporarily not bearish and expect a slight continued rebo
post-image
BTC-0.67%
$MSTU Down 21.67% in a day—this isn’t a pullback; someone just flipped the table.
Last night, the group was still shouting “to 33”; today, it hit a low of 23.69, with the price now at 25.63 and 24-hour trading volume at $11.1 million. What does that mean? It’s like the entire day’s sales of a medium-sized mall being crammed into this one coin, with everyone rushing for the exits. From a high of 33.02 to a low of 23.69, the range was nearly 40%. Anyone who chased the price higher this morning now has an account that feels like it’s on a drop tower ride.
In plain English: it’s like cabbage going
MSTU-3.61%
  • 6
  • 1
This passage still has a lot of feeling to it.
post-image
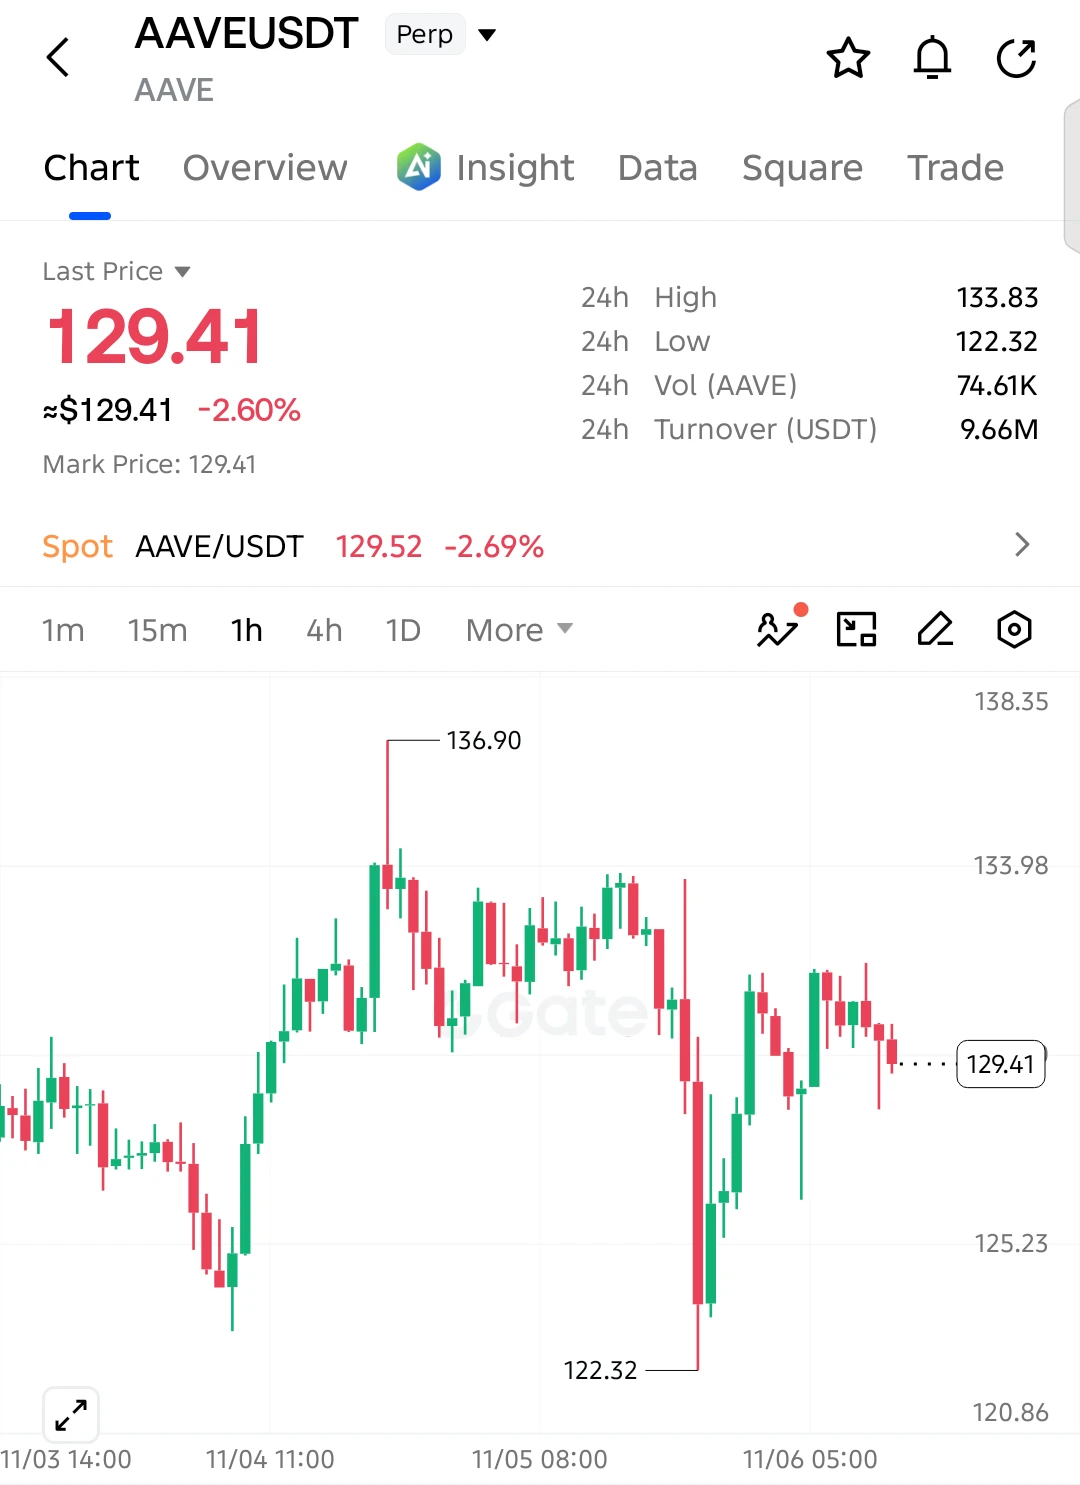
$AAVE SHORT SETUP — BEARS REGAINING CONTROL!

$AAVE is down 2.60%, and buyers are struggling to sustain the recent recovery. Another bearish move could be building!

Entry: 129.41
SL: 132.50

TP1: 127.80
TP2: 125.23
TP3: 123.50
Final Target: 122.32

The recovery from 122.32 is losing strength, with repeated rejection around 131–132. Sellers are gradually regaining control, and a break below 128 could trigger another decline toward the previous low.

Invalidation: A sustained recovery above 132.50 weakens the bearish setup.
post-image
AAVE-1.22%
  • 3
$BCH

$BTC is still churning within its range, refusing to pick a direction, while $BCH has quietly tightened its grip on the reins!
The broader market plunged 5.6%, as retail traders rushed to cut their positions and exit.
$BCH dipped to $270 but was quickly bought back up. Negative funding rates have been pushed to the extreme, with 82,000 short contracts crowded below.
The big players are probably already laughing—this pile of short contracts is ready-made fuel for a rally!
#BCH$BCH
👇
Risk warning: The above is only market observation and personal opinion and does not constitute invest
post-image
BTC-0.67%
Good thing I’m not an indie developer anymore
I’ve now pivoted to being a developer who codes for my own amusement😂
post-image
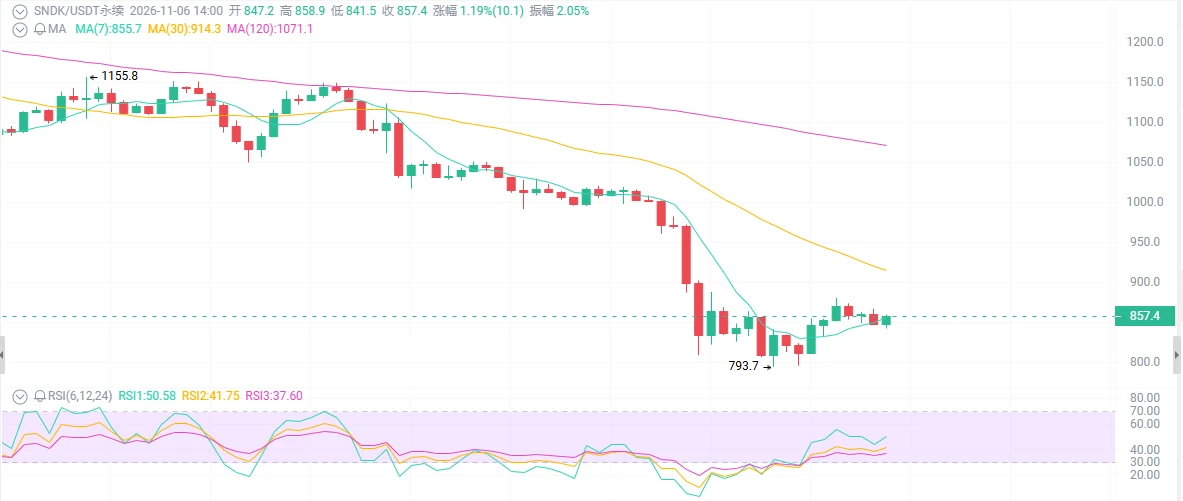
SNDK at $855: Are you buying the dip or catching a falling knife?
Blowout earnings, revenue up 378% year over year, an 85% gross margin, and a P/E of just 8x—but the stock plunged 36% in 6 days, halving again and again from $2,374, with a 24-hour swing of over 20%. Is this the first domino in the AI bubble bursting, or the most deeply undervalued opportunity of 2026?

First, the surface story: every piece of good news is being treated as bad news.

Earnings came out on October 29: revenue of $11.03 billion, up 23% quarter over quarter and 378% year over year, EPS of $49.51, beating expectation
post-image
SNDK-0.18%
MU-0.63%
SKHY+0.86%
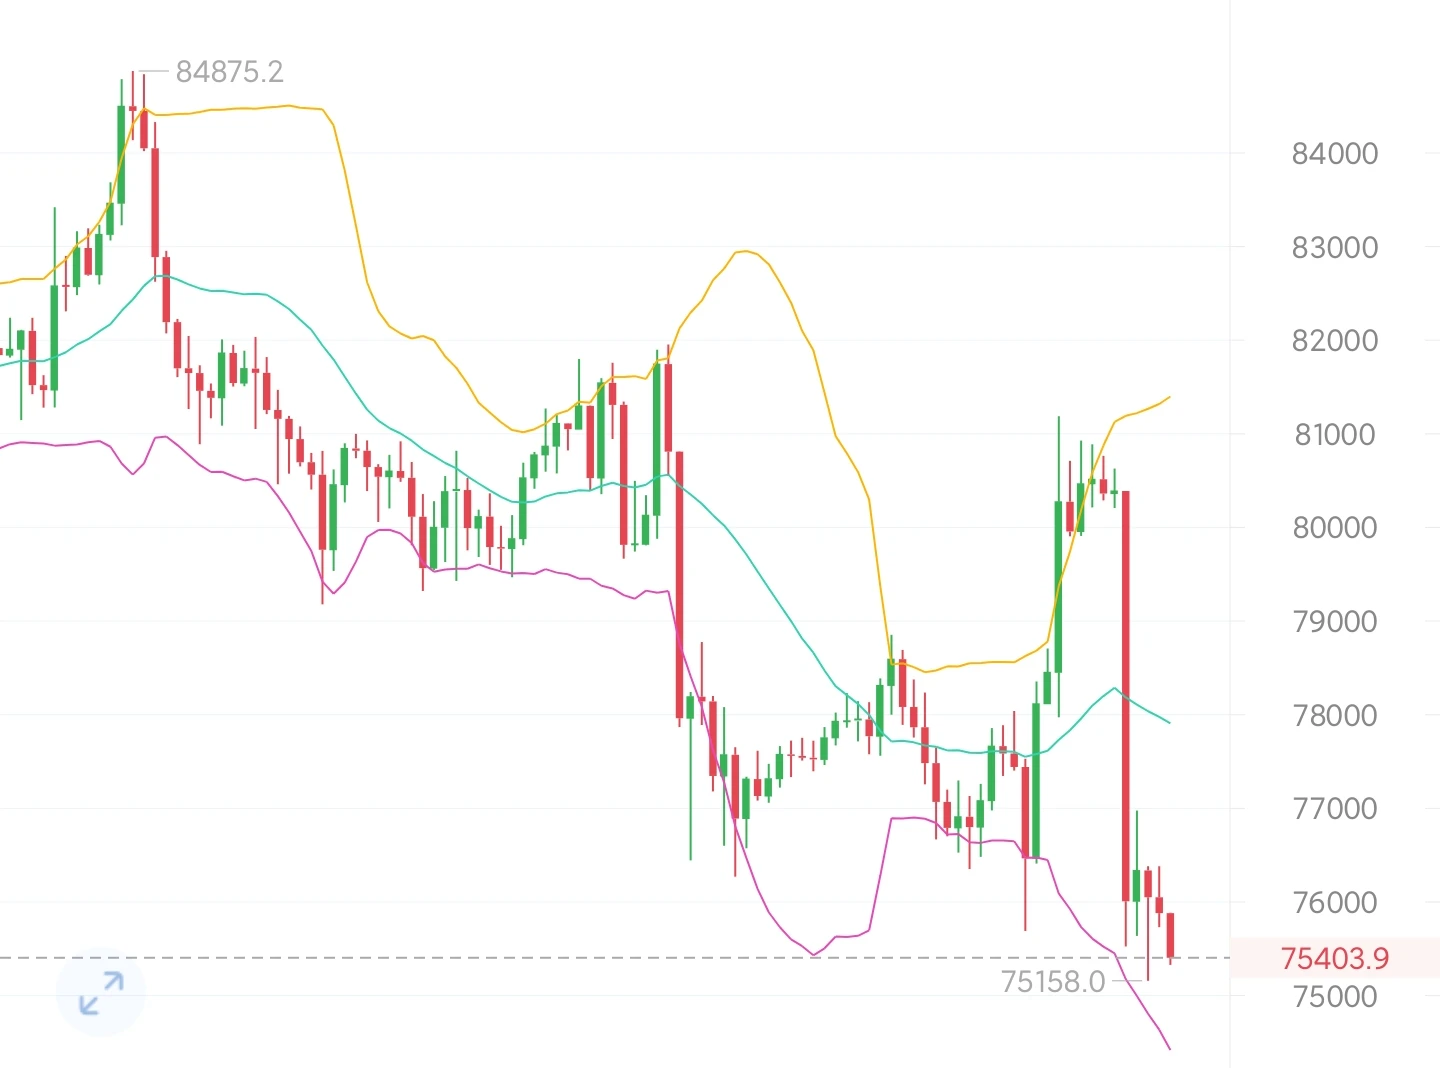
From the four-hour structure, this pullback broke through the short-term consolidation range with a large bearish candle with a full body, directly disrupting the previous short-term bullish uptrend. Profit-taking at higher levels and concentrated selling pressure completely reversed the short-term strength, and the broader market has officially entered a weak correction phase.

After a rapid, deep decline, slight buying support emerged at short-term lows, and prices have temporarily stabilized and moved sideways. However, the overall rebound is extremely weak, with a slow and feeble recovery;
post-image
BTC-0.65%
Guys, market rallies are never smooth sailing. Spikes followed by pullbacks and retests after breakouts are common market rhythms.
Especially now, new developments in the news are causing fresh turbulence.

Some Democratic lawmakers have proposed restrictions on superintelligent AI agents, weighing on sentiment in the AI sector. Tech stocks such as SanDisk came under pressure, and weakness in the Nasdaq also dragged major risk assets lower.
Looking back at the past two days, after the US election results came in on November 4, $BTC briefly climbed back above 81000, and ETH also rebounded to a
post-image
BTC-0.65%
AKE+6.39%
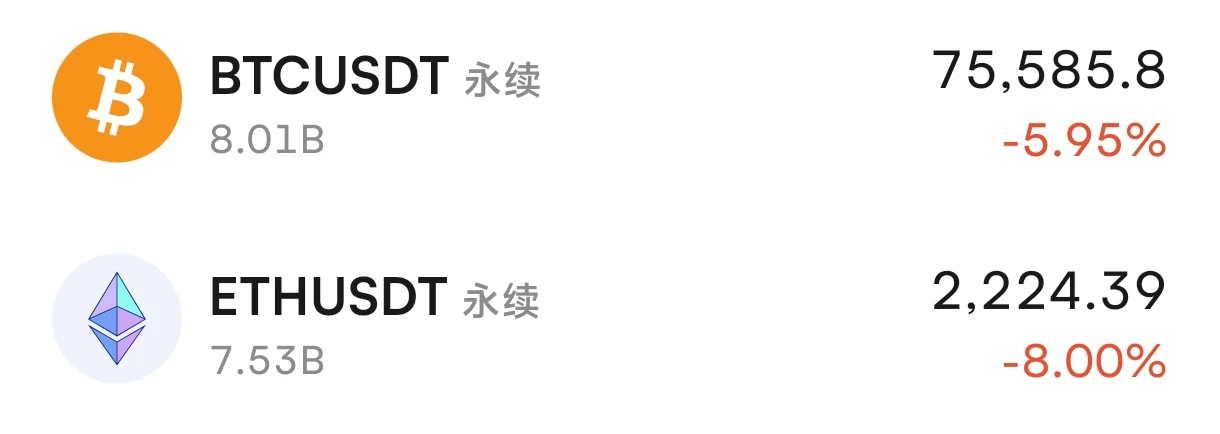
Bitcoin crashed—$ZEC but ZEC didn’t! On a night of macro carnage, who’s secretly shutting off the shorts’ escape route?

A market crash is a true test: weak hands fall with the market, while the major players hold firm.

My take: Macro factors are indeed driving the sell-off. BTC plunged to $75k overnight, wiping out $1.2 billion in long positions as risk appetite shrank across the board. But ZEC held firm today. The reason isn’t in the charts, but on the supply side: the NU7 upgrade just activated, cutting the block subsidy to one-third. 12k ZEC in the Sprout pool were locked up outright, fu
ZEC+1.29%
  • 4
[New Streamer] Market Prediction
live-cover
LIVE1,545
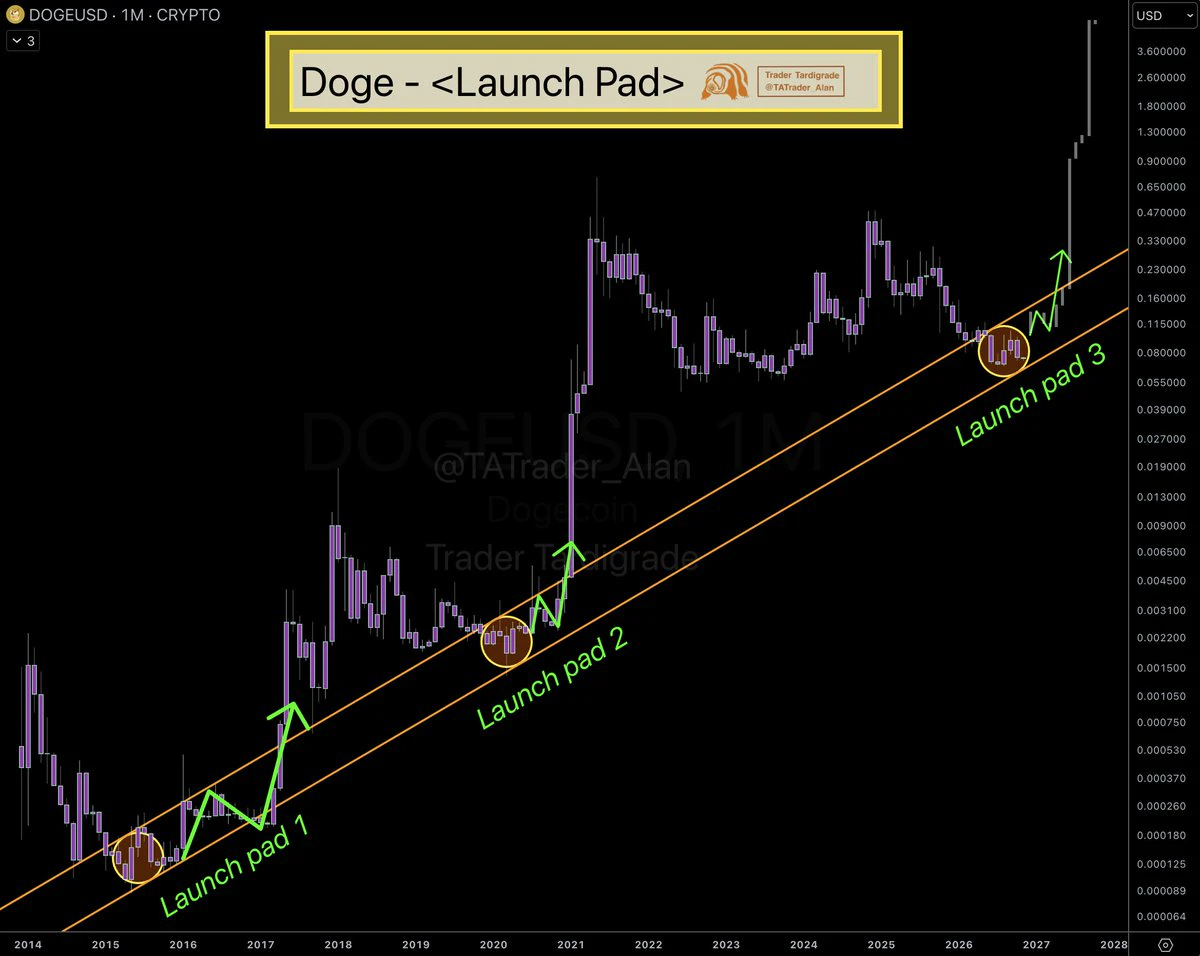
$DOGE /monthly
#Dogecoin is forming the third Launch Pad ❇️
The first two sat inside the same channel, consolidated, then took off.
Price is now back at the same spot in the channel, building the base for the next launch 🚀
post-image
DOGE-0.22%
Load More

Join 40 M users in our growing community

⚡️ Join 40 M users in the crypto craze discussion

💬 Engage with your favorite top creators

👍 See what interests you

Trending Topics

USStocksFaceHistoricSelloff

3.32k Views3.6k Discussing

U.S. stocks suffered a sharp selloff on Thursday, with the Nasdaq closing down more than 5% and the Philadelphia Semiconductor Index falling over 12%. AI and chip stocks including $NVDA and $AMD were hit especially hard. Markets are reassessing AI valuations, data-center spending and future returns. Is this just short-term deleveraging, or the start of a deeper correction in the AI trade? Which sectors are you watching next?

GateLaunchesPoSECProofOfSecurity

13.75k Views580 Discussing

USNonfarmPayrolls

11.98k Views4.03k Discussing

View More