Share your thoughts
placeholder
Article
Which #Memecoin Will Dominat in 2026 🤔💯
$PENGU

$WKC
$DOG
$PONKE
$BARSIK
$TROLL
What I'm Missing ?
post-image
MEME+1.82%
PENGU-2.55%
WKC-6.06%
PONKE+6.83%
BARSIK+2.40%
This trend is so strong I don’t even have to think—the account is dancing on its own. While everyone was still watching from the sidelines, I had already set my sights on $PONS . At the time, volume was gradually building above 0.4775 and funds were quietly entering, so I reminded everyone: don’t wait for the pump to chase; this is the time to get in early.
And the trend didn’t disappoint at all. The price surged to 0.5973, delivering +493.53% in profits—that felt incredible. This move wasn’t about luck; it was about having the patience to enter early.
But let me add one thing: take profit on
post-image
PONS+2.18%
ETH+3.23%
DOGE+0.57%
$EDGE This 14-point surge is a clear sign of market-maker manipulation. Let me review it from the market maker’s perspective: first, they placed hidden buy orders around 0.53 to accumulate, with the 24-hour low of 0.5359 serving as evidence. Then they suddenly pulled the sell wall during the session and used $10.1 million in trading volume to wash-trade the price higher, creating the illusion of a breakout above 0.6282 and luring momentum buyers in. The current price is 0.6180, just 1 point below the high, so the market maker is most likely testing the selling pressure above. Bullish rationale
EDGE+2.56%
#ShareWeekly
ETH/USDT Weekend Outlook and Macro Recap
Current Price: $2,540.65 (+3.13%)
We are heading into the weekend, and the market has just digested critical macro data. Here is the updated landscape and how to approach it.
What Just Happened
The recent PPI print came in hotter than expected on the headline number, while Core PPI was slightly cooler. CPI was mostly in line, though core inflation remains sticky. Because of this mixed but generally firm inflation data, the market is now pricing in roughly an 88% chance of a Fed rate hike at the upcoming September 15-16 meeting.
The immedia
ETH+3.21%
  • 4
I just hit refresh, and it shot up, like I had scared it.

When the screen was glowing green, everyone else was running. $TAG faced obvious overhead resistance, with sell orders stacked layer upon layer. I said to wait for a rebound before adding.

Entered at 0.0010303, now at 0.0006729, +683.78%. The timing was right, and this bite of meat tastes great.

Take profits first: close 80%, and move the remaining 20% to the entry price for protection. Don’t get greedy for the last bite.

Hold as long as the trend remains intact; run if it breaks down. Don’t fall in love with the market. This i
post-image
TAG+11.84%
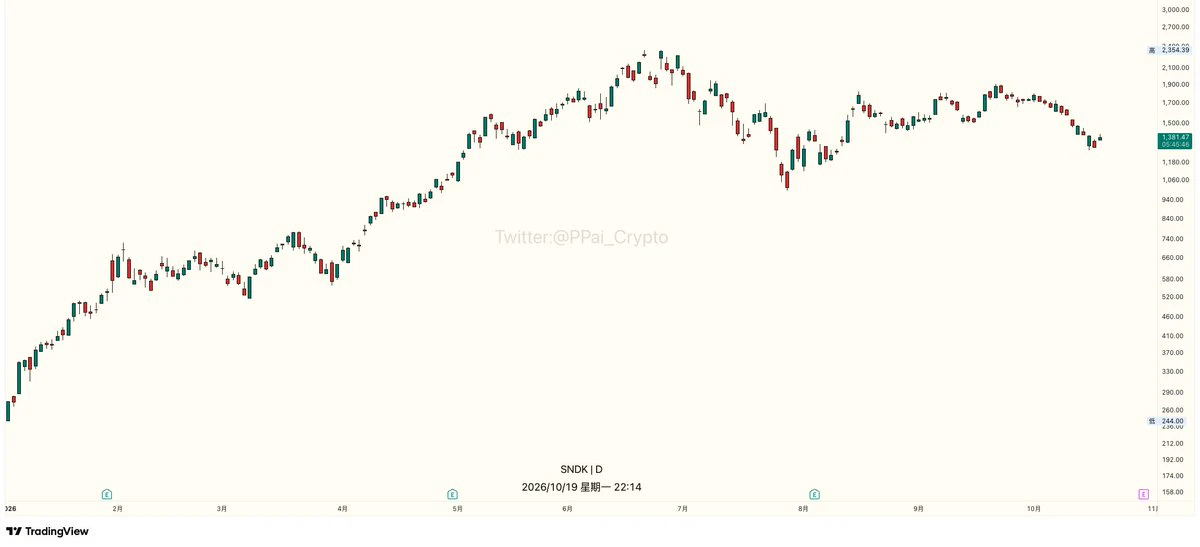
SNDK-3.65%
LAB+63.71%
Insiders are calling $LINK /USDT a trap at these levels, but the data screams otherwise.

$LINK /USDT - LONG

Trade Plan:
Entry: 11.583 – 11.669
SL: 11.217
TP1: 11.932
TP2: 12.137
TP3: 12.443

Why this setup?
Why now? The daily trend is bullish with a 95% confidence score, setting the stage for a continuation. The 1h price is sitting at 11.626, which also serves as our entry reference, while the 15m RSI at 47.85 shows we are not yet overbought. The 1h ATR of 0.17024 confirms there is enough momentum to push toward the first target of 11.932 and potentially the second target of 12.137. The i
LINK+0.44%
Layout for Bitcoin, Ethereum, and Dogecoin
live-cover
LIVE1,683
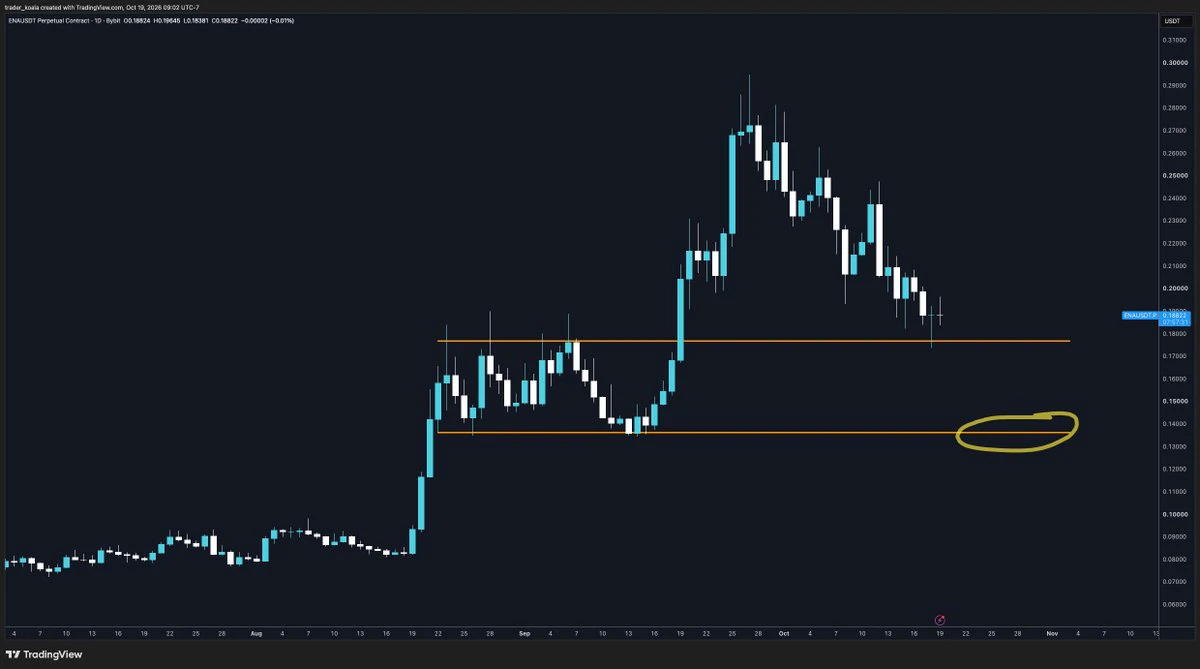
Everyone is sleeping on $ENA /USDT right now while the 1h ATR whispers a massive move is coming.

$ENA /USDT - LONG

Trade Plan:
Entry: 0.14044 – 0.14234
SL: 0.13227
TP1: 0.14823
TP2: 0.15279
TP3: 0.15963

Why this setup?
Why now? The daily trend is bullish, but the 15m RSI is sitting at 38.5, showing the local dip is exhausted just as the higher-timeframe setup aligns. The 1h ATR of 0.003799 confirms that the current consolidation is compressing before an explosive expansion, which justifies an entry at the 0.14139 zone. From there, the first target is 0.14823, with the second target at 0.
ENA-2.33%
CPI Data Could Shift Dollar And Gold Trends, Could Crypto Follow The Move?
live-cover
LIVE399
Most traders will miss $ETH /USDT's next move entirely because they're watching the wrong timeframe.

$ETH /USDT - LONG

Trade Plan:
Entry: 2522.12 – 2538.58
SL: 2451.38
TP1: 2589.58
TP2: 2629.06
TP3: 2688.29

Why this setup?
Why now? The daily trend is firmly bullish, giving the macro setup a clear directional edge. The 15m RSI at 42.46 shows room to run before overbought territory, meaning early entries are not chasing exhaustion. The 1h ATR of 32.90 tells us this market breathes in big swings, so position sizing matters more than timing perfection. The entry zone between 2522.12 and 2538
ETH+3.23%
$ATOM I kept averaging down from 3U all the way to 1.6, losing a full 40,000 U. Yesterday I finally cut half my position to recover some losses. Today it dropped another 8.73%, with a 24h low of 1.6340, just a hair below the current price of 1.6520.
But looking at the data again: trading volume was 27.7M. It was a high-volume decline, but not a crash, and the 1.63–1.65 range is an old support zone from last November. The Cosmos ecosystem has had no hot narrative lately, but the team hasn’t run off, the staking ratio remains above 60%, and there are no signs of a sell-off in the circulating su
ATOM-8.49%
[$Lobster Signal] Long + catch the wick on an elevated 1H pullback
$Lobster 1H RSI 81.37, upper Bollinger band at 0.0671 caps price, current price ranging at 0.0647. 4H MACD histogram expanding at 0.0031, EMA20 at 0.0522 providing support. 1H MACD histogram contracting, momentum for chasing highs weakening. Order book depth -5.79%, bid/ask 0.89, with heavy sell-side orders. Funding rate 0.0781%, OI Stable. Buy the pullback, with a 1.50 risk-reward ratio; position control takes priority.
🎯Direction: Long
⚡Entry/Limit Order: 0.06453182 - 0.06472600
🛑Stop-loss: 0.06407874
🚀Target 1: 0.06569689
post-image
龙虾+70.35%
BTC+0.20%
ETH+3.21%
SOL+2.86%
In a downtrend, many people get the direction right, but few actually hold on. This $ENA short was hit by two rebounds, so I set the protection level farther away to filter out normal fluctuations.
The first rebound erased most of the unrealized profit. I did not rush to act because the price had not reclaimed the key wick level, and the moving averages were still exerting downward pressure. As long as the key level was not reclaimed, the short structure remained intact, and the rebound was temporarily treated as a shakeout.
Later, the price accelerated after breaking below 0.15075. I first to
post-image
ENA-2.33%
ETH+3.23%
SNDK-3.65%
This was purely because the market was in a good mood and casually tossed out some coins, which happened to land right on my head.

I had just finished lunch and was checking the chart when $ETH was still oscillating around 2473.40, but every dip was quickly bought back up. Buying pressure was clearly strengthening, while sellers were losing confidence the harder they dumped. If you don't enter at a time like this, it will be too late to chase after the price rises, so I followed in directly with a long position and set my risk controls first.

The price has now climbed to 2544.29, with a +4
post-image
ETH+3.23%
ZEC+5.01%
DOGE+0.57%
Market Alert

$NEAR /USDT - LONG

Trade Plan:
Entry: 2.456 – 2.494
SL: 2.296
TP1: 2.610
TP2: 2.699
TP3: 2.834

Why this setup?
Technical setup found.

Debate:
Thoughts?

⚠️ Personal market analysis only. NFA — manage risk and DYOR.
Educational content, not investment advice or a recommendation to buy, sell, deposit, or withdraw any asset. No paid promotion or referral/affiliate links.
NEAR-0.93%
$MU /USDT is about to break range and crash 4% in hours

$MU /USDT - SHORT

Trade Plan:
Entry: 973.24 – 977.20
SL: 994.19
TP1: 961.00
TP2: 951.51
TP3: 937.29

Why this setup?
Why now? The 1h price sits at 975.22, a precise entry_ref inside the 973.24 to 977.20 zone, while the daily trend remains range-bound, setting up a sharp move. The 15m RSI at 43.0 confirms bearish momentum is still fresh, not yet oversold. The 1h ATR of 7.902302 means a single candle can cover the distance to TP1 at 961.00, and a second wave targets TP2 at 951.51. The invalidation level at 1005.10 is the line in the sa
MU-0.53%
Everyone's hunting upside on SYMBOL but the smart money is fading this level.

$SAMSUNG /USDT - SHORT

Trade Plan:
Entry: 194.74 – 195.68
SL: 199.68
TP1: 191.86
TP2: 189.62
TP3: 186.27

Why this setup?


Debate:
Are we getting a clean slide to TP2 or will bulls defend this zone?

⚠️ Personal market analysis only. NFA — manage risk and DYOR.
Educational content, not investment advice or a recommendation to buy, sell, deposit, or withdraw any asset. No paid promotion or referral/affiliate links.
SAMSUNG+2.97%
I didn’t fully exit $0G after the rally; I took profit on 80% first and moved the protection level for the remaining position above the entry price. The remaining position was stopped out during the quick pullback just now, locking in the profit smoothly.

The reason for entering was simple: after pulling back to the previous high on the hourly chart, the price did not continue lower but instead reclaimed the area above the moving average with increased volume. This was a typical pullback confirmation. After going long, I kept the stop-loss below the lower boundary of the small range.

After
post-image
0G+3.66%
SNDK-3.65%
ADA-0.91%
#ShareWeekly
XRP/USDT is trading near $1.35–$1.39, consolidating directly around its 200-day Exponential Moving Average (EMA) near $1.355. Following an August expansion toward the $1.45 region, short-term momentum has decelerated into a range-bound structure as traders de risk ahead of key macroeconomic events, including the mid September FOMC decision.
Derivatives open interest currently sits near 2.17 billion XRP, indicating a decline in speculative leverage that reduces short-term cascade risks while market participants wait for a directional trigger.
Key Technical Levels
The 14-day Re
post-image
XRP+0.75%
  • 3
  • 1
$XLM /USDT is about to expose the weak hands hiding in this bullish setup.

$XLM /USDT - SHORT

Trade Plan:
Entry: 0.17840 – 0.17966
SL: 0.18511
TP1: 0.17447
TP2: 0.17143
TP3: 0.16687

Why this setup?
Why now? The daily trend is bearish, the 1h price sits at 0.17903, and the 15m RSI at 46.97 signals bearish momentum without being oversold. The 1h ATR of 0.002533 shows enough volatility to reach TP1 at 0.17447 and TP2 at 0.17143 from the entry zone between 0.17840 and 0.17966. The invalidation level at 0.18447 is the line in the sand that separates a valid short from a failed setup.

Debate
XLM+1.08%
Load More

Join 40 M users in our growing community

⚡️ Join 40 M users in the crypto craze discussion

💬 Engage with your favorite top creators

👍 See what interests you

View More