Share your thoughts
placeholder
Article
Most traders will fade this $SLX /USDT short before the 4h close—here’s why that’s a mistake.

$SLX /USDT - SHORT

Trade Plan:
Entry: 0.06997 – 0.07029
SL: 0.07167
TP1: 0.06898
TP2: 0.06821
TP3: 0.06705

Why this setup?
- RSI 15m at 48.34 = zero momentum to push higher, just dead air.
- ATR 1h (0.000641) shows shrinking volatility—breakouts fail fast in range.
- Entry ref 0.07013 sits below 1D range mid; TP1 0.06898 is only 1.6% away.
- Why now? The “Armed” status means the trap is set before the weekend liquidity hunt.

Debate:
Are you shorting the breakdown to TP2 or waiting for a
SLX+1.02%
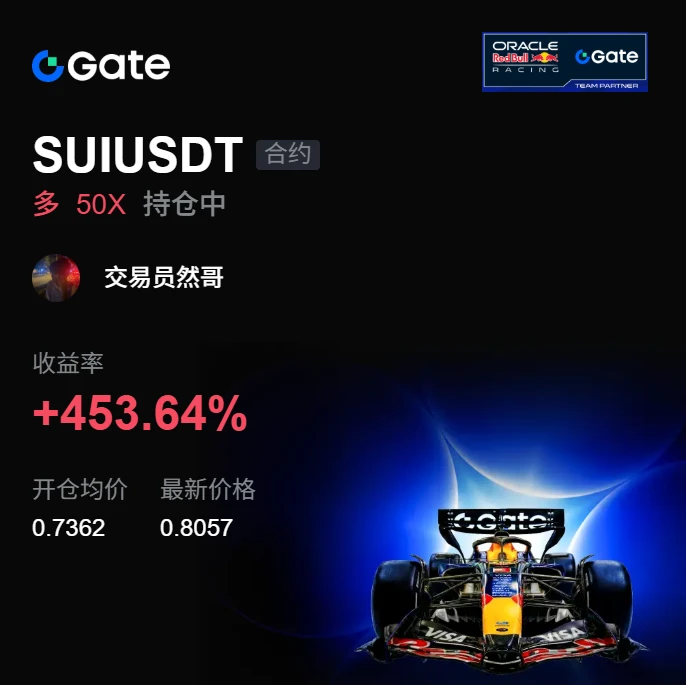
I was just about to go to the forum and start cursing, but then I looked at my balance and thought, never mind—the market is always right. I placed the order before bed a few days ago and thought it would go to waste, but today $SUI gave the answer directly—entered at 0.7362, now at 0.8054, with an unrealized gain of +452.99%. Feels great, guys.
I didn’t use any fancy analysis this time; I just looked at whether the buying support was strong enough. Before the market had fully started moving, every pullback held the level, which meant someone was buying underneath. Since someone was buying, I
post-image
SUI+6.11%
BTC+0.17%
ADA+3.98%
Goldie sends his regards 🚬
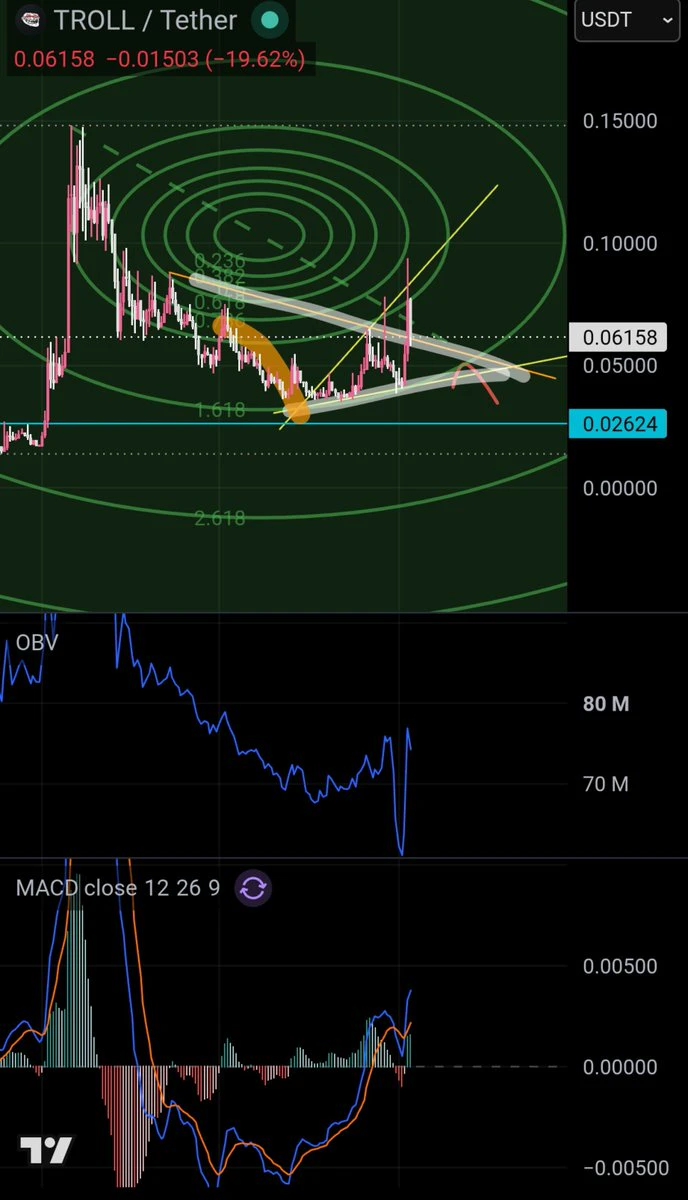
$TROLL WAV
post-image
TROLL-19.19%
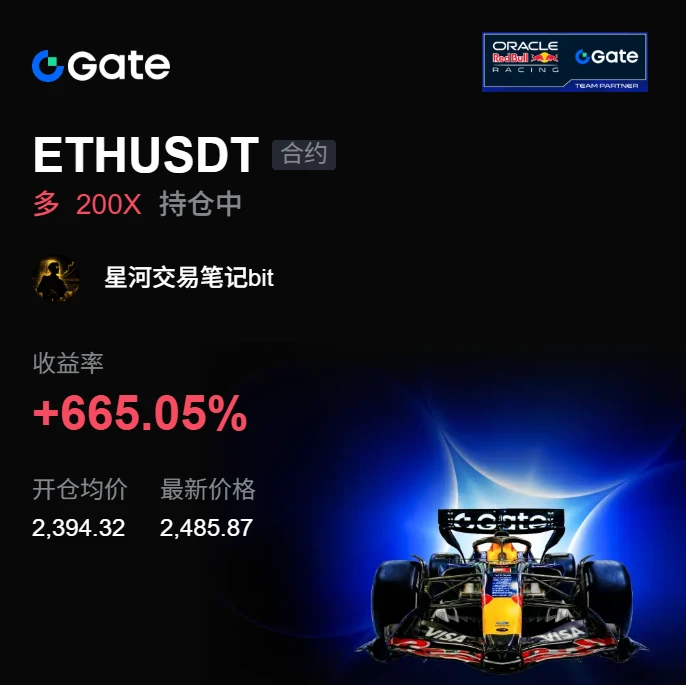
I don’t chase after a volume-backed surge; that’s a rule I set for myself. When $ETH surged to 2485.57, volume did indeed pick up, but such a sudden expansion often means short-term divergence is intensifying, and chasing in makes it easy to get stuck at the top.

I entered my long position earlier, when the price repeatedly tested the key level around 2394.32. The key level held each time, and the rebounds after each pullback kept getting faster. I got the feeling that someone was accumulating at lower levels, so I followed and went long.

After the move played out, I still took profit on
post-image
ETH+1.23%
ZEC-0.66%
ADA+3.98%
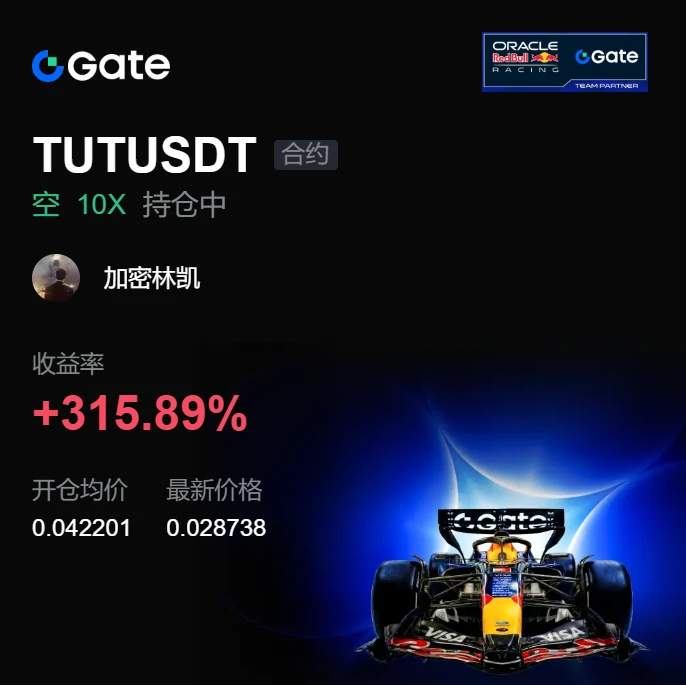
The hand that set the stop-loss a few days ago trembled slightly; this morning, I realized that was unnecessary filial piety. Before bed, I placed the short order for $TUT , and when I woke up, the candlestick had already completed most of the move for me 😏
Watching the market at the time, the rebound had no volume, and every push upward felt weak. The selling pressure above was obvious—someone was rushing to exit every time the price tested a high. This structure was not a breakout, but a bull trap. I set the entry at 0.042201 in advance; when it was time to short, I shorted without hesitati
post-image
TUT+25.17%
SNDK+1.73%
BNB+7.26%
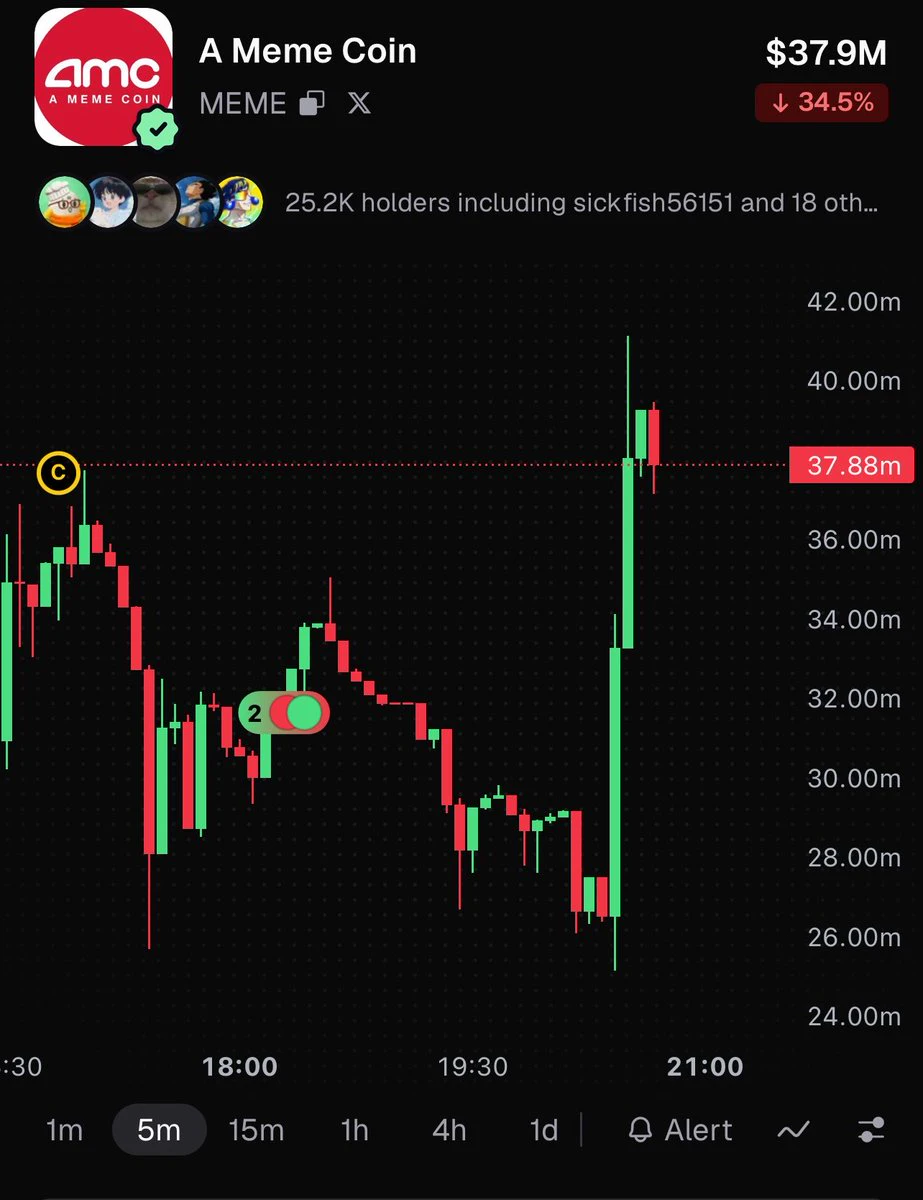
$meme wow 😮
0x385f4f8ae47651ce5f58f5265395a669f8281e18
post-image
MEME+3.87%
Ping Yeh, a software engineering manager at $GOOG Quantum AI, believes useful quantum computing is more than five years away
Hartmut Neven, who heads Google Quantum AI, has said recent results leave him confident that useful applications only quantum computers can handle will arrive within five years
“He is very confident,” Yeh said at the SEMICON forum. “I am a little skeptical. I want to be more conservative.”
post-image
GOOG-1.06%
GOOGL-1.12%
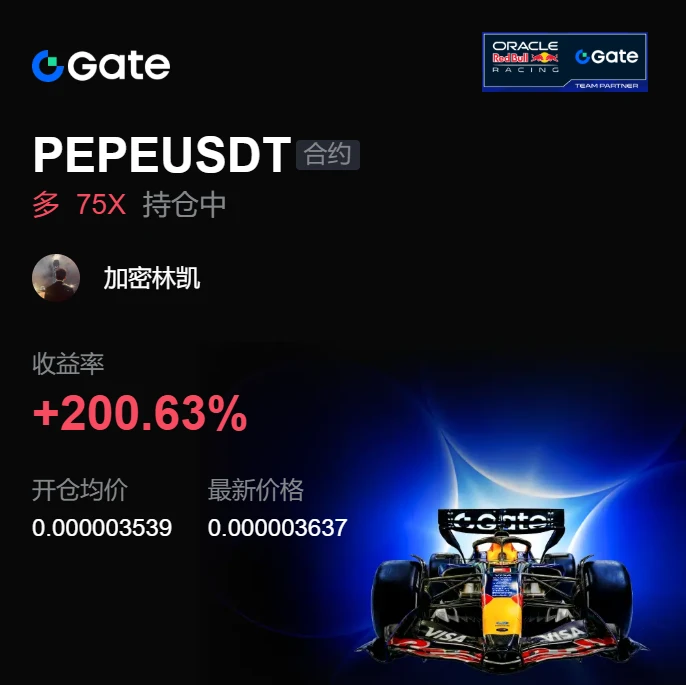
Is this a rebound? This is CPR for the account, isn’t it? I thought today would be another day of taking losses, but while the market was grinding along the bottom intraday, $PEPE held above the key level all afternoon, with buyers stepping in every time it dipped. I’ve seen this kind of move many times: shake out the weak hands, then push higher. I had only one thought at the time: follow along, no nonsense.

Bought in around 0.000003539, now at 0.000003637, with +192.61% secured. Feeling great, brothers. In this kind of market, you don’t need to be especially clever—you just need to be dec
post-image
PEPE+3.53%
ZEC-0.66%
ADA+3.98%
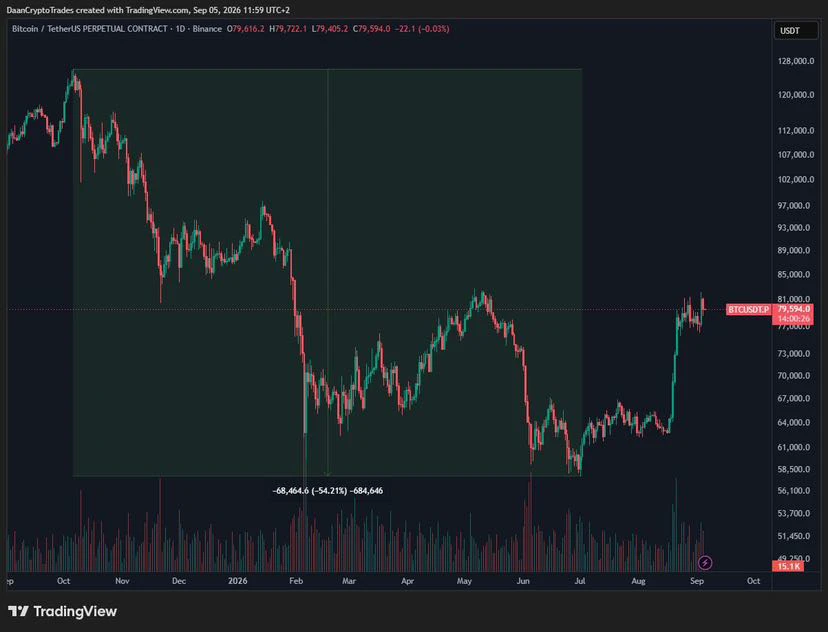
$BTC 's Recent bear market trend has seen a -54% drawdown top to bottom.
This was while all other markets were rallying hard, which is a good argument as to why it was "just" -54% this time around. Arguably, price would see a much larger drawdown if stocks and everything were down a lot too during this time.
This was a very isolated bear trend this time around.
#Gate60MillionUsers #BTCReclaims80K
post-image
BTC+0.17%
  • 6
Gold’s 4h chart is screaming short at 4438—but the daily range says don’t trust it yet.

$XAU /USDT - SHORT

Trade Plan:
Entry: 4436.95 – 4439.87
SL: 4452.40
TP1: 4427.92
TP2: 4420.92
TP3: 4410.43

Why this setup?
- RSI 15m at 52.4 = no momentum fuel, just a lazy drift into resistance.
- ATR 1h at 5.83 means a 10 move is nothing—our TP1 at 4427 is a 0.24% scalp, not a trend.
- Daily range kills the conviction: 55% confidence is a coin flip, so we’re selling the 4h rejection, not the macro.
- Why now? Entry zone 4436.95–4439.87 is a tight 0.07% box—wait for a 15m close below 4438 to tr
XAU+0.09%
Financial News, Crypto Updates, Real-World Strategies
live-cover
LIVE1,325
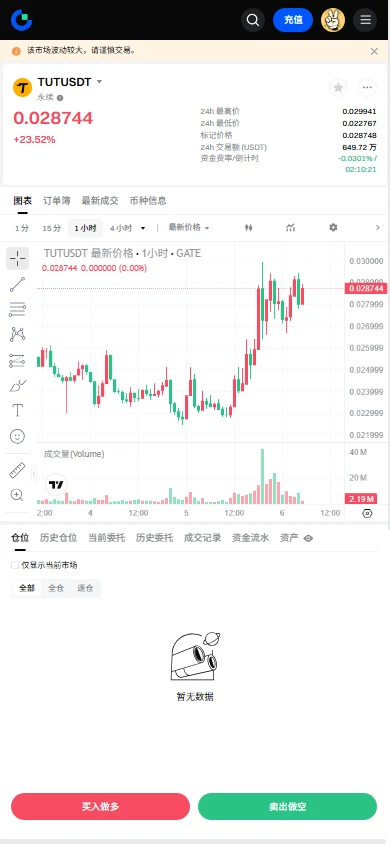
$TUT Signal】1H retest finds support, bulls attack
$TUT The 1H retest of 0.0278 immediately found support, with the order book buy ratio at 1.22, showing a clear floor. The 4H MACD histogram is contracting, and selling pressure is weakening. The funding rate is -0.0172%, with shorts continuing to pay.
🎯Direction: Long
⚡Entry/Limit Order: 0.0279958 - 0.0280800
🛑Stop-loss: 0.0277992
🚀Target 1: 0.0285012
🚀Target 2: 0.0287118
🛡️Trade Management:
- Take 50% off at Target 1 and move the stop-loss up to breakeven. If the price falls back to the entry level, exit automatically to protect the prin
post-image
TUT+25.17%
BTC+0.17%
ETH+1.23%
SOL+1.68%
Nietzsche called it the most genial building ever created.
post-image
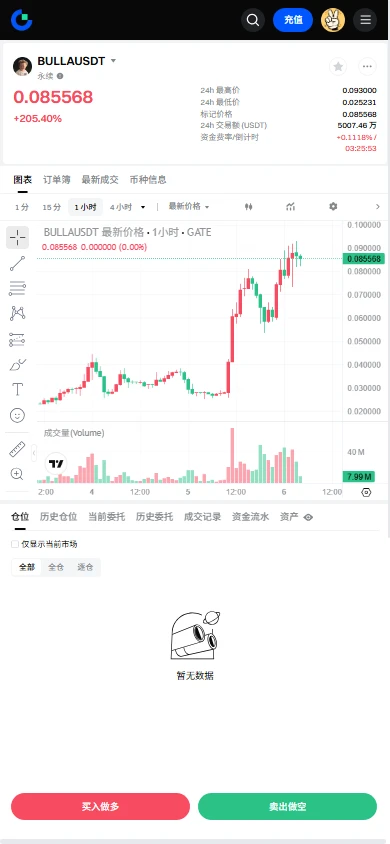
【$BULL Signal】Long|1H middle-band convergence, high funding-rate pressure
$BULL 1H is converging along the middle band, with RSI at 71.54 on 4H and 69.02 on 1H; MACD histogram bars are shortening on both timeframes. Volume plunged from 1.5B to 0.07B, showing a break in buying momentum. The funding rate is 0.1175%, indicating high leverage costs. Order book depth imbalance is -0.51%, with bids and asks nearly balanced.
🎯Direction: Long
⚡Entry/limit order: 0.08422457 - 0.08447800
🛑Stop-loss: 0.08363322
🚀Target 1: 0.08574517
🚀Target 2: 0.08637876
🛡️Trade management:
- Execution strategy: Aft
post-image
BTC+0.17%
ETH+1.23%
SOL+1.68%
#RedBullTradingTourSeason6
Red Bull Trading Tour Season 6 is currently gaining attention among crypto traders as Gate’s latest trading campaign combines cryptocurrency competition with the speed and excitement of Formula 1. The Season 6 competition is scheduled to run from August 31 to September 28, 2026, giving participants several weeks to compete for rewards.
The campaign features a dynamic prize pool that can reach 60,000 GT, depending on overall trading volume. Traders can participate through several products, including futures, spot trading, options, leveraged ETF tokens and Convert. Mu
GT+10.96%
ORCL+3.07%
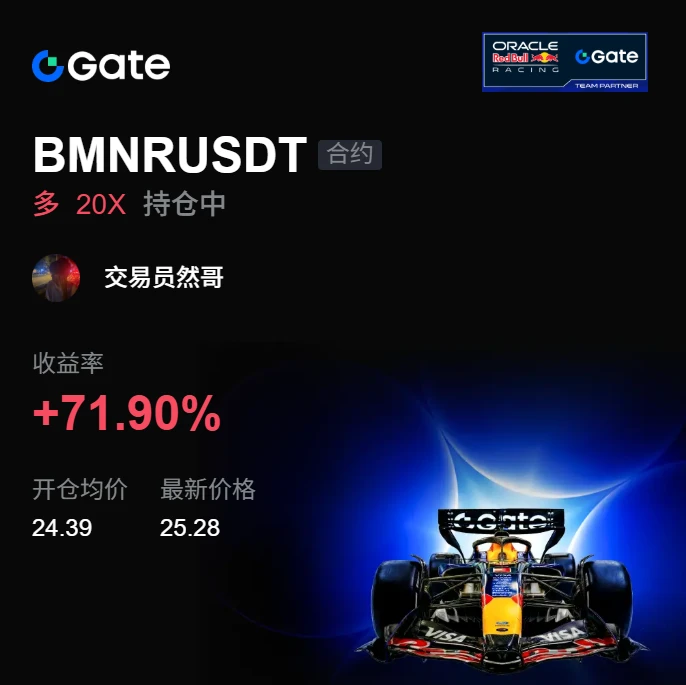
Lacking perspective, I can't hold on; the profit on this trade is as thin as paper, but I love it. A few days ago, the last thing I checked before bed was the market. $BMNR had clearly moved sideways around 24.39 all day, and every time it was pushed down, buyers happily stepped in to catch it. The signs of bottoming consolidation were plain to see. While others were fearful, I was greedy. I figured there wasn't much room to fall further from that level, so I opened a long position and got in early.
When I opened the app this morning, wow—it had been pushed straight up to 25.26, and at the key
post-image
BMNR+1.00%
SNDK+1.73%
LAB+2.03%
Nobody's watching ONDO at 0.3699—but the 4h chart is about to force a decision.

ONDO/USDT - LONG

Trade Plan:
Entry: 0.3690 – 0.3708
SL: 0.3616
TP1: 0.3761
TP2: 0.3803
TP3: 0.3865

Why this setup?
Why now? The 1D trend is bullish, and price is holding just above the 0.3690 support floor with a 95% long confidence. RSI on the 15m is at 52.93—room to run, not overheated. ATR shows tight volatility, so the breakout from this coil could snap fast toward TP1 at 0.3761. This is the calm before the expansion.

Debate:
Are you scaling in at 0.3699, or waiting for a retest of 0.3690 to add size?
ONDO+4.26%
Everyone’s long XLM, but the 4H clock just ticked against the crowd.

$XLM /USDT - SHORT

Trade Plan:
Entry: 0.18373 – 0.18449
SL: 0.18771
TP1: 0.18141
TP2: 0.17960
TP3: 0.17690

Why this setup?
Why now? The range-bound 1D trend is your tell—no momentum to break higher.
- RSI (15m) at 48.2: neutral, giving sellers room to push without overbought friction.
- ATR (1h) at 0.0015: tight volatility—perfect for a clean slide to TP1 (0.18141) and TP2 (0.17960).
- Entry at 0.18411 is armed; invalidation sits at 0.18203, so the risk is defined and tight.

Debate:
Is XLM faking the dip below 0
XLM+3.05%
Everyone’s long CL/USDT while the 4h tape is quietly screaming lower highs.

CL/USDT - SHORT

Trade Plan:
Entry: 91.72 – 91.90
SL: 92.70
TP1: 91.14
TP2: 90.70
TP3: 90.03

Why this setup?
Why now?
- 1D range, but the 4h bias flips SHORT (Conf 55) – that’s the first crack in the bull story.
- RSI 15m at 56.76 suggests a dead-cat bounce, not a breakout.
- Entry 91.81 with TP1 91.14, TP2 90.70 – that’s a 1.2% drop just to first target, while SL sits tight at 92.70.
- ATR 1h at 0.37 means volatility is low – shorts get room to breathe before the trap springs.

Debate:
Are you fading thi
CL+0.88%
Crypto Signals and Trding Insights
live-cover
LIVE1,277
Load More

Join 40 M users in our growing community

⚡️ Join 40 M users in the crypto craze discussion

💬 Engage with your favorite top creators

👍 See what interests you

View More