
Square
Following
Hot
News
Profile
Share your thoughts
placeholder
Article
$PTB is finally starting to move away from the entry area; this trade looks good now.
Hope some of you caught this move. The results look good so far. Keep an eye on the price action of $ZE and $MAGMA today.
post-image
MAGMA+56.54%
Earnings season is the real “big test”—the divergence between AI and crypto is only just beginning
The overnight rebound looked good, but over the next few weeks, the market will switch to a different set of criteria: from “sentiment pricing” to “earnings pricing.”
Of the 47 S&P 500 companies that have reported third-quarter earnings so far, 85% beat expectations, and the index’s overall earnings growth rate is expected to reach 29%. But the key is that most tech companies have yet to report, and expectations for them are extremely high. LNW’s chief investment officer put it precisely: the mar
MU-6.19%
Trenches
Kimchi
K
bade
b
Kimchi
CSoc...pump
Market Cap
$.
Change
.
24h Vol
$.
Holders
.
kimchi
k
bade
b
kimchi
B1Y2...pump
Market Cap
$.
Change
.
24h Vol
$.
Holders
.
STONK
S
bade
b
STONK
6GmA...UNgx
Market Cap
$.
Change
.
24h Vol
$.
Holders
.
AGT
A
bade
b
AGT
0x5d...e274
Market Cap
$.
Change
.
24h Vol
$.
Holders
.
ZIG
Z
bade
b
ZIG
0x8c...1145
Market Cap
$.
Change
.
24h Vol
$.
Holders
.
Is Staggered Entry Really Safer? It Depends on These Three Key Conditions
In cryptocurrency trading, many people are reluctant to buy all at once, so they choose to enter in batches.
They buy a little the first time, buy a little more if the price pulls back, and add more if the market continues to fall.
It sounds reasonable: if you can't accurately identify the bottom, buying in batches should help reduce risk.
But the problem is:
Staggered entry can change the distribution of your purchase prices, but it doesn't necessarily reduce your overall risk.
Without a clear trading plan, staggered en
post-image
BTC-3.40%
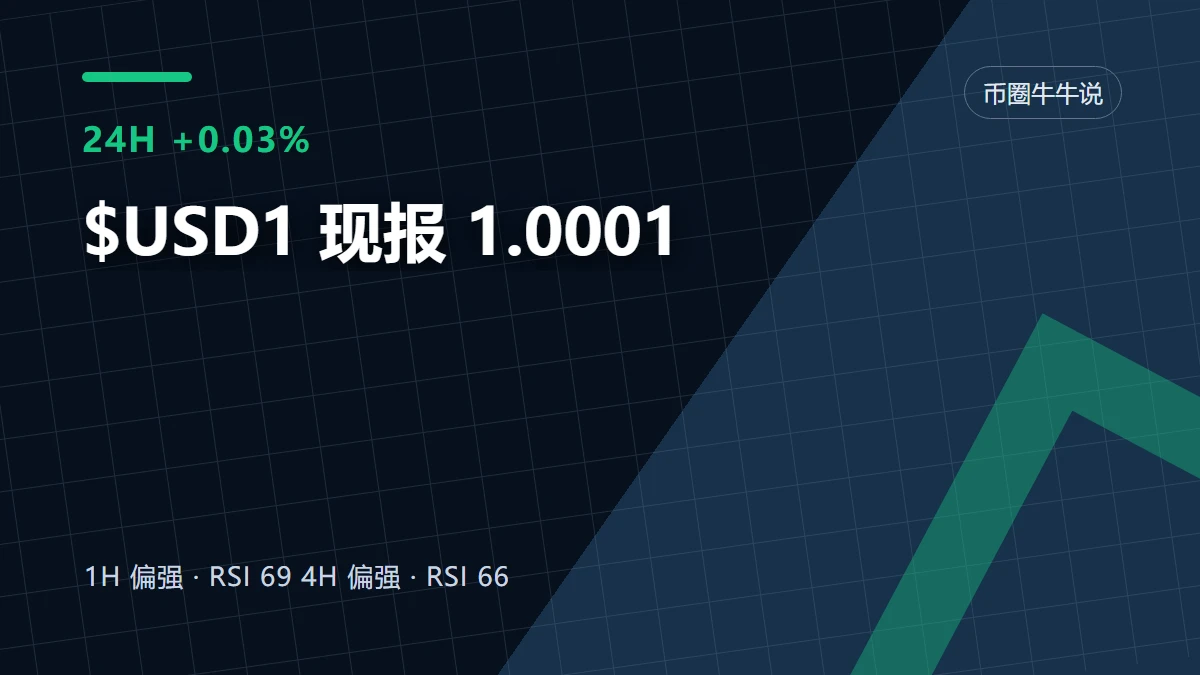
Treat $USD1 as a question to be tested: current price 1.0001, 24-hour change +0.03%, participation 0.23x. What we know is clear; the key unknown is whether real buying will show up once key levels are reached. One simple rule: price shows direction, while volume shows participation. When price has moved but volume is clearly below average, the follow-through on either a breakout or a drop should be taken with a grain of salt. Just looking at candle colors is easy, but price moving and most people being willing to follow are two different things.
One verifiable update: Gate’s official announce
post-image
USD1-0.16%
🚨 THEY'RE NOT JUST DRAINING YOUR WALLETS.
THEY'RE DESTROYING THE FUTURE OF CRYPTO.
How much more of this fcking bullshit are we supposed to take?
@kimchi1x deploys a new $KIMCHI.
It shows up in the QR code of his post. PumpFun co founder Alon reposts it.
Within seconds, it rockets past $10M MC.
Then, after an alleged 6–7 figure cash grab, the token disappears from the QR code. The repost is gone.
And now the excuse is: "THE ACCOUNT WAS HACKED."
Seriously? I am not buying it.
We just watched $KIMCHI hit $40M+ MC, with millions extracted.
And apparently, that's still not enough?
How many times
post-image
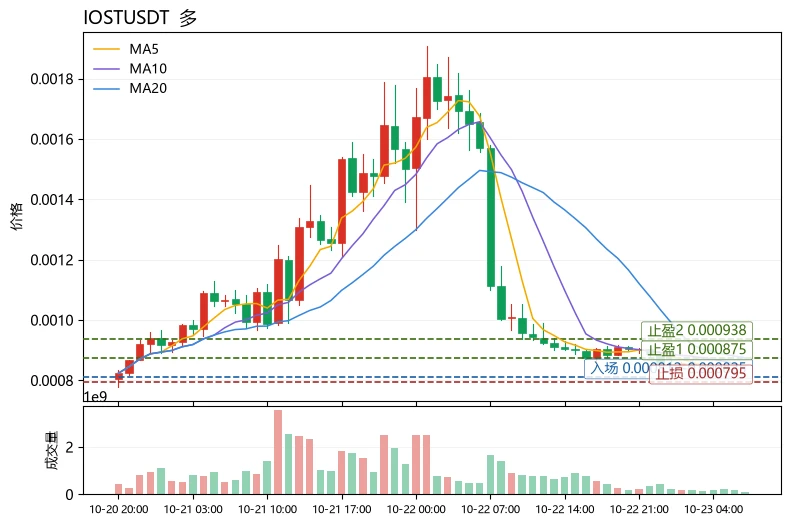
$IOST After a 35% plunge, with the Greed Index at 68, is it still worth buying the dip? The answer is yes: you can try a small long position, but this is a countertrend rebound play, not a trend reversal—the Fear & Greed Index remains in the greed zone, indicating that overall market risk appetite has not collapsed. BTC is down just 3.56%, and MA5 is close to MA20, suggesting high-level consolidation rather than a breakdown. IOST’s single-day drop of 35.81% is clearly an isolated sell-off within its sector. The funding rate of -0.0497% shows shorts are crowded, creating conditions for a short
post-image
BTC-3.40%
#GateSquareNewCreatorProgram
Gate Square New Creator Program: Turn Your Market Knowledge Into Meaningful Content
In crypto, everyone has an opinion about the next big move. Some predict breakouts, others expect corrections, and many simply repeat whatever is trending. But what truly separates a valuable creator from an ordinary poster? The ability to explain market movements, share independent thinking, and help readers understand both opportunities and risks.
That is what makes Gate Square's New Creator Program worth exploring. Running from October 15 to October 31, 2026, at 16:00 UTC, this
BTC-3.40%
ETH-3.55%
SOL-3.04%
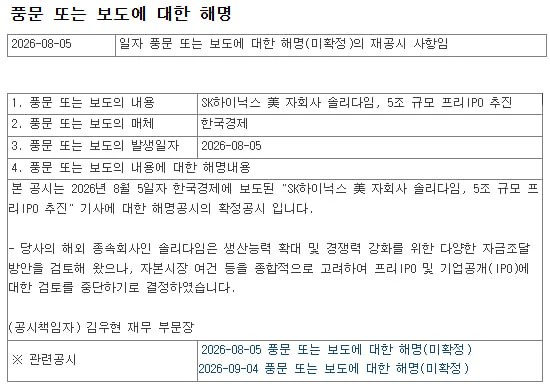
SK hynix (official statement): “Our overseas subsidiary, Solidigm, has been exploring various financing options to expand its production capacity and strengthen its competitiveness. However, after taking capital market conditions and other factors into consideration, it has decided to discontinue its evaluation of pre-IPO financing and an initial public offering (IPO).”
post-image
SK Hynix-5.48%
SKHY-8.04%
SKHYV-0.98%
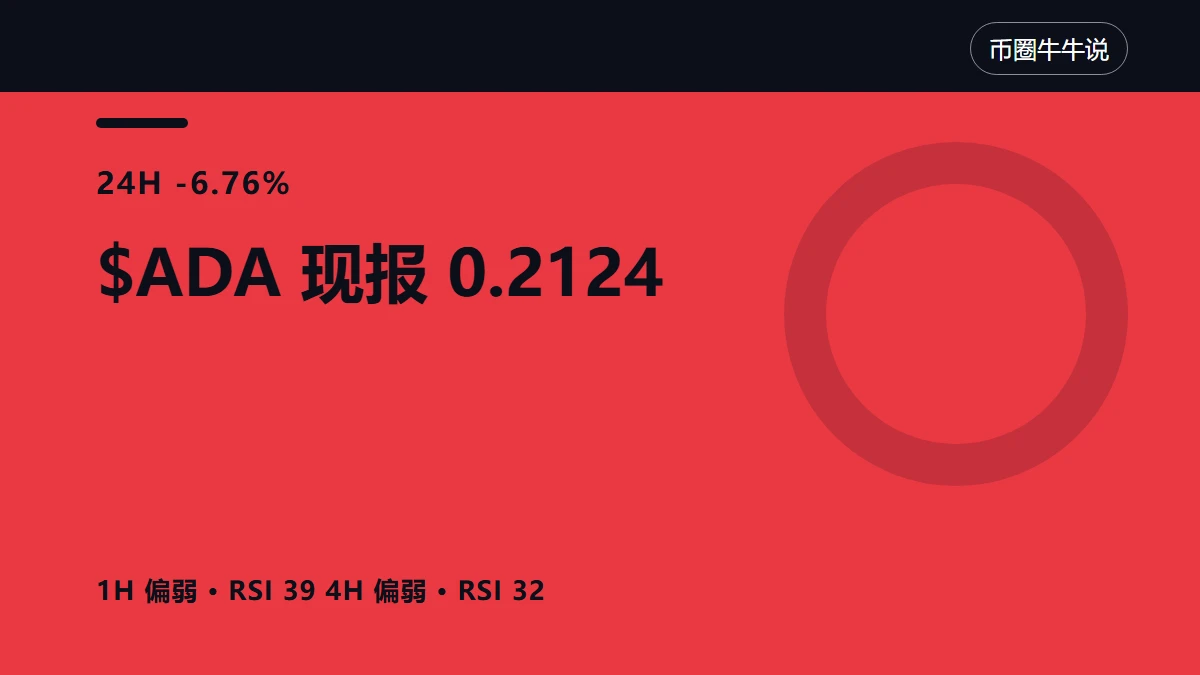
$ADA 24-hour -6.76%, now at 0.2124. The 1-hour chart is weak, and so is the 4-hour chart. Whether the two charts are telling the same story matters more than the gainers and losers list. Price-volume alignment is key here. Price sets the direction; volume shows participation. When the price has already moved but volume is clearly below average, the follow-through on either a breakout or a decline should be discounted. Looking only at candlestick colors is easy, but a moving price and most people being willing to follow are two different things.
The levels on the chart are clear: the 1-hour ran
post-image
ADA-6.01%
Risk appetite has “rebounded,” but 5.15% Treasury yields are still there

The Nasdaq rose 1.05% yesterday, with AI and crypto-related stocks gaining in tandem. Many people attributed the move to a “rebound in risk appetite.” That’s not wrong, but it’s only half the story. The other half is that none of the key factors weighing on risk appetite have gone away.

The 10-year Treasury yield is still around 5.15%. At this level, returns on risk-free assets are high enough that the opportunity cost of holding high-valuation tech stocks and crypto assets is very real. Last week’s sharp sell-off in
NVDA-4.31%
Market update BTC
live-cover
LIVE907
Musk explores merging SpaceX and Tesla! If the two giants join forces, what kind of business landsca
live-cover
LIVE953
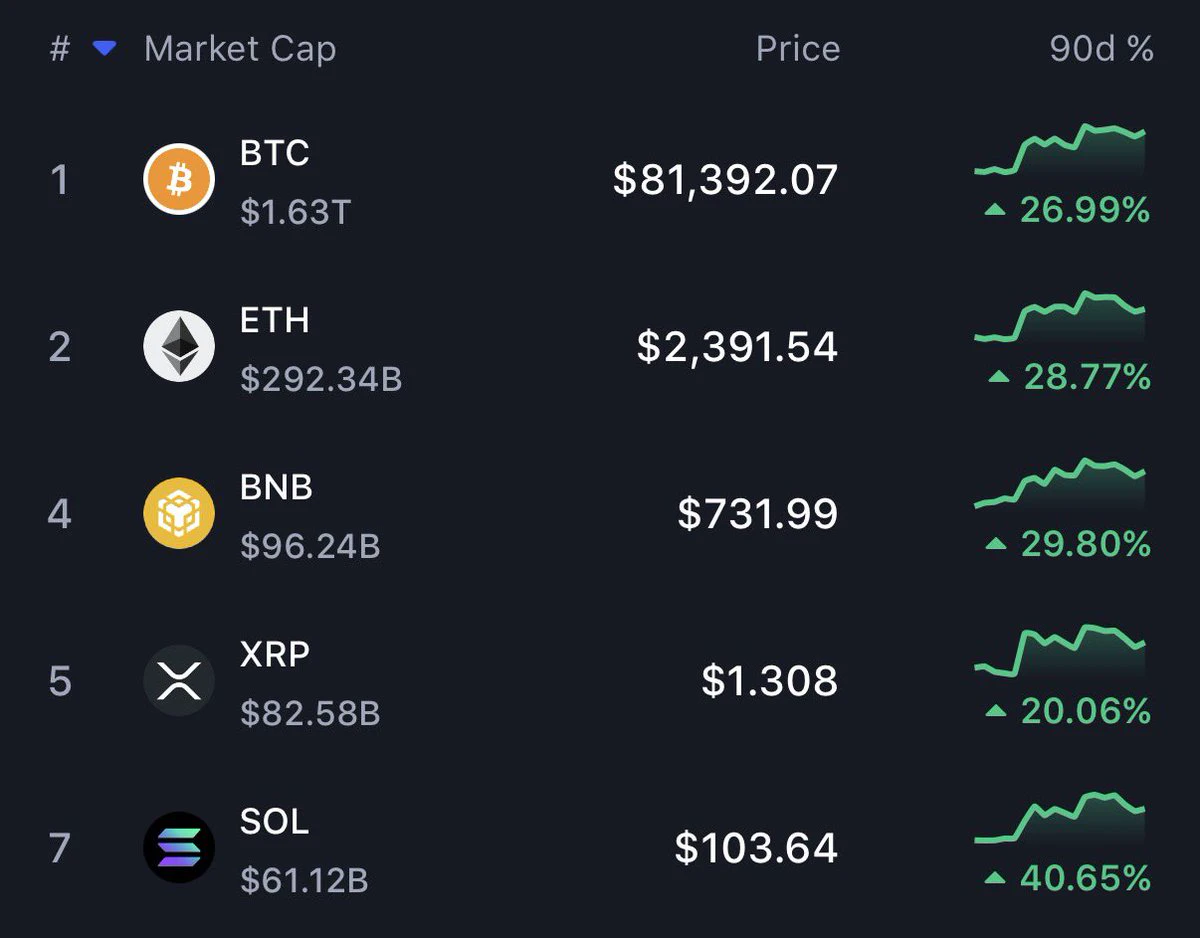
Crypto is still UP HUGE the past 3 months
Bitcoin is up 27%
ETH is up 29%
SOL is up OVER 40%
Gold is literally down 1% during that same time
The S&P 500 is only up 3.4%
Crypto is doing MUCH BETTER than you think
I am extremely bullish on 2027!!
post-image
BTC-3.40%
ETH-3.55%
SOL-3.04%
XAU-2.36%
SPX500-0.66%
Why did account returns differ so much when the price barely changed?
In cryptocurrency trading, many people focus on how much BTC has risen or fallen, but overlook a more important question:
With the same price movement, why do some people make more, some make less, and others lose money outright?
The answer lies not only in market movements, but also in leverage, position size, and trading costs.
Let’s look at a simple example.
Suppose your trading account has 1,000 USDT.
Case one: using 2x leverage
You use 1,000 USDT as margin to open a position worth 2,000 USDT.
If the price rises 1% in th
post-image
BTC-3.42%
extremely volatile year of fire horse and political turmoil.
let’s wait and see what happens
post-image
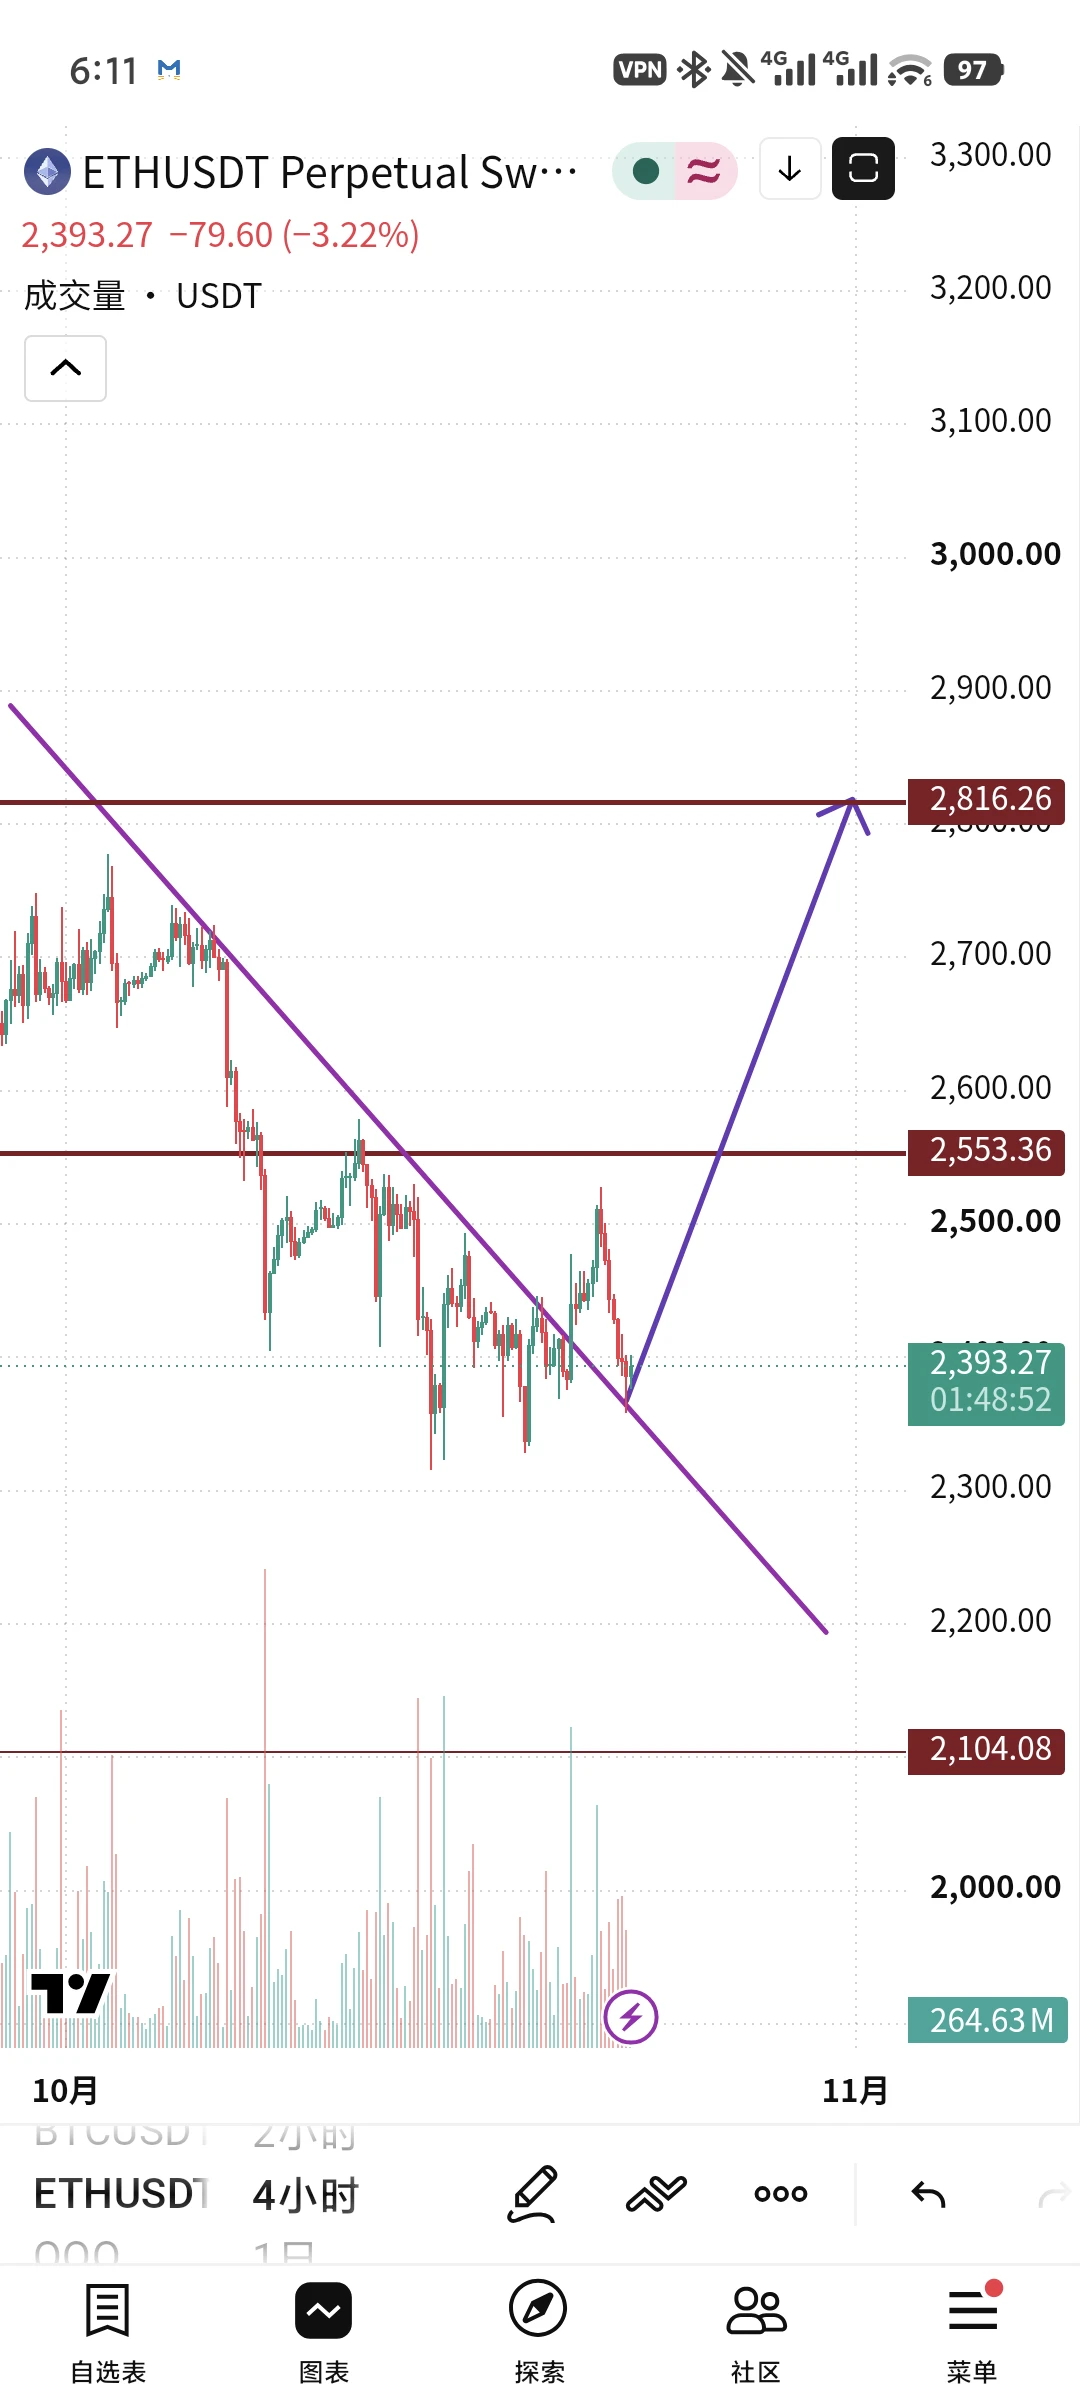
Stop shorting!! Stop shorting!! Pattern and indicator confluence!
4-hour bullish divergence + daily golden cross imminent + a successful retest after breaking out of the 4-hour downtrend channel!
Based on the bullish divergence rule, the upside target is the high where the downtrend began and downside momentum was strongest; based on the trend-channel breakout rule, the target is 100% of the downtrend channel's height!
Going long below 2400 offers the best risk/reward!
Overall, the range is 2724——2816!!
$ETH
post-image
Anyone keeping up!
Follow me into a long position!
You think I'm crazy!
9 Participants
Ends In 6 Day
ETH-3.58%
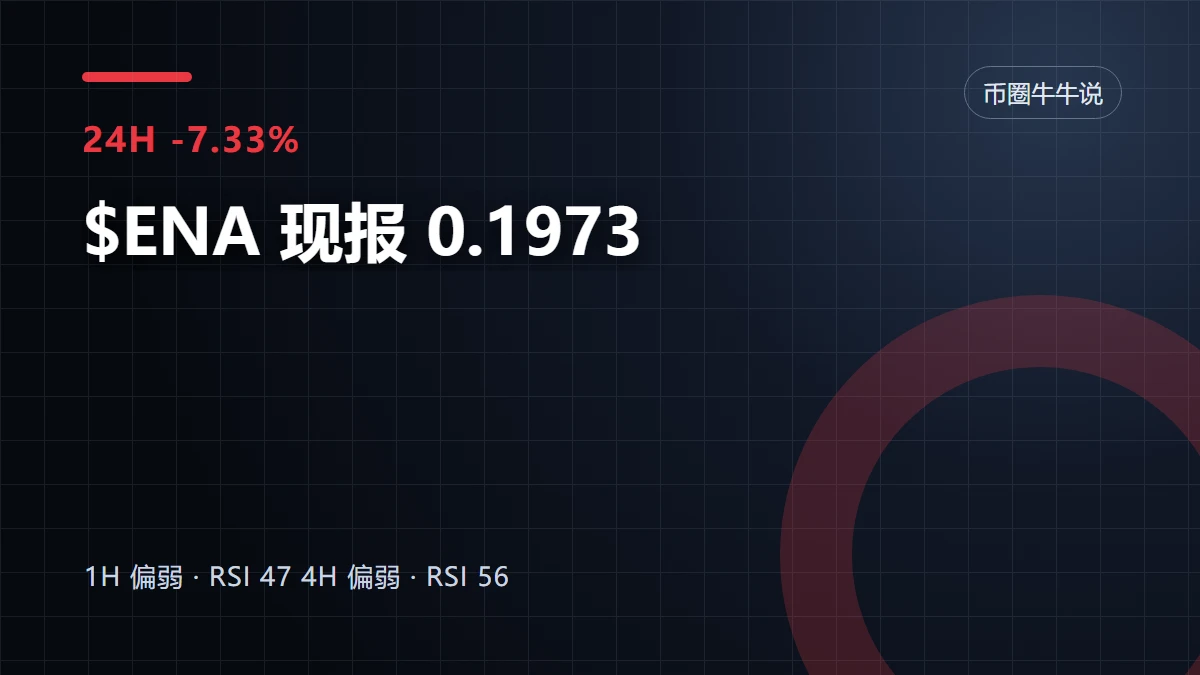
$ENA price has already moved—why hasn’t trading volume followed?
The key thing to watch on this $ENA chart isn’t the 7.33% drop over 24 hours itself, but that the 1-hour and 4-hour charts are both weak, yet haven’t given the same answer.
My view: a directional bias exists for now, but low participation makes this move less credible.
$ENA The current price is 0.1973 USDT, down 7.33% over 24 hours, with a high of 0.2156 and a low of 0.1947. The 1-hour support is at 0.1947, with resistance at 0.2156; the two more distant 4-hour boundaries are 0.1839 and 0.226. Price has moved, but trading activit
post-image
ENA-7.09%
Almost gone...
The price is fluctuating so much 😂...
The information that a male student was taken to another world is false.
post-image
Everyone is watching $SUI 's price.
But they're missing the bigger move.
Sui's Hashi initiative is targeting over $500 MILLION in committed capital to bring Bitcoin-backed finance onchain.
And Anchorage Digital is part of the institutional coalition.
This isn't another memecoin narrative.
It's a battle over where Bitcoin liquidity goes next.
The question is whether Sui can turn that institutional interest into real onchain demand.
post-image
SUI-5.38%
BTC-3.40%
Load More

Join 40 M users in our growing community

⚡️ Join 40 M users in the crypto craze discussion

💬 Engage with your favorite top creators

👍 See what interests you

Trending Topics

GateQ3ReportReleased

9.92k Views3.63k Discussing

Gate released its Q3 2026 report, with September derivatives trading volume reaching $396 billion, up 38.2% MoM, while spot trading volume reached $48.8 billion. The platform now covers more than 12,800 global stocks and ETFs. With trading and broader financial services expanding together, what could drive Gate’s next phase of growth? [👉 Full report](https://www.gate.com/announcements/article/102375)

MetaEarningsBeatExpectations

9.84k Views588 Discussing

USAIAndCryptoStocksRise

38.24k Views8.53k Discussing

View More