Share crypto content and earn up to 60% commissions through content mining.
placeholder
gatefun
$ETH I wasn’t surprised at all that this drop unfolded. At first it looked like it was ranging, but the rhythm inside had already changed—especially when price repeatedly couldn’t break through from the high.
My short entry was based on 2079.09, not because I wanted to gamble on the direction. It was because the feedback at that level was very direct: strong resistance overhead, no volume on the pullback, and the lower area was still being tested repeatedly. A lot of people hesitate because the price didn’t immediately dump. But sometimes trading is exactly about these details of weakness sho
ETH-3.10%
BTC-1.60%
SOL-2.93%
View Original
post-image
  • Reward
  • Comment
  • Repost
  • Share
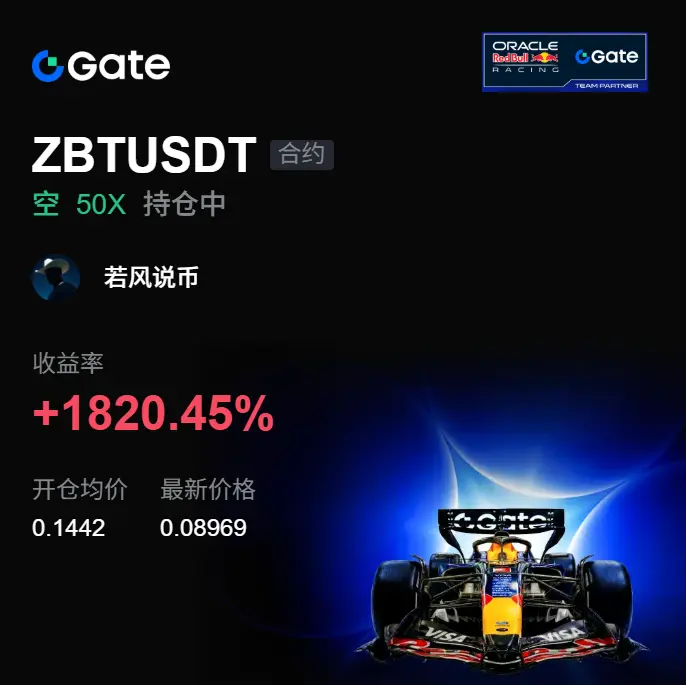
Hard-headed talk is useless; the chart speaks.👄 This morning when I opened the chart, I saw $ZBT this rebound still lacks strength—there’s nobody buying at the top, and volume isn’t cooperating. The pressure at higher levels feels too heavy📉

Before the chart fully kicked off, I had been watching the 0.14420 area. When I saw that the spike-and-retrace kept happening, I judged the shorts still had more room. Back then, I directly signaled to go long—no need to force a fight with fake toughness📌

If you’ve understood it, execute. Don’t hesitate at the last step before entering.

Now the p
ZBT-0.98%
BTC-1.60%
ETH-3.10%
View Original
post-image
  • Reward
  • Comment
  • Repost
  • Share
Many people were just chanting that IN was about to rebound, but the market directly slapped them in the face in the opposite direction. $IN This drop wasn’t sudden—weakness was already written into the order book beforehand.

What I was watching at the time was the 0.09609 level. After price surged up, it didn’t get consistent follow-through; instead, every time it bounced back, it was pushed down again. The real issue isn’t how much it fell, but that the rebound is getting weaker and weaker. The people who chased longs start to hesitate, while the shorts’ rhythm is actually clearer.

Now
IN0.06%
BTC-1.60%
ETH-3.10%
View Original
post-image
  • Reward
  • Comment
  • Repost
  • Share
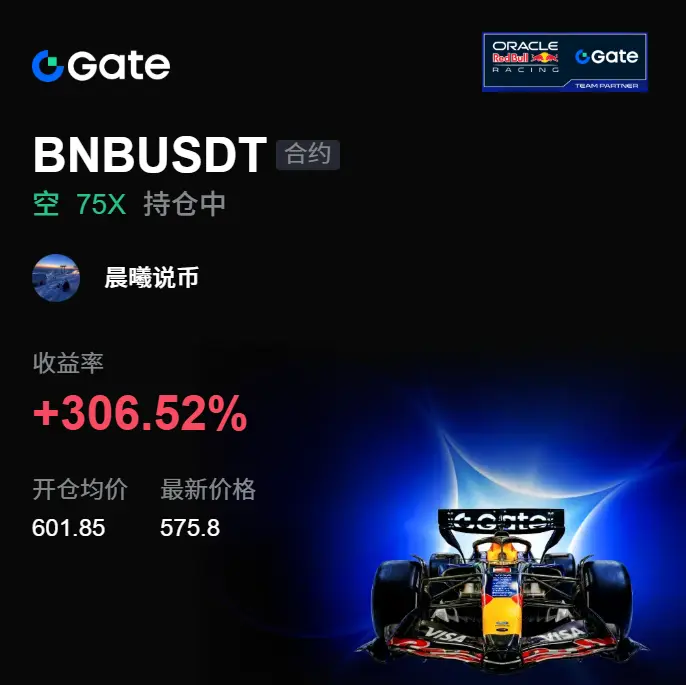
It looks like a fairly ordinary pullback, but it actually breaks that stubborn, strong-support state that $BNB had been in. Once the price loses a key level, the trend can easily turn more decisive.

My observation is that the previous few rebounds did not form an effective recovery; instead, they made the upper key level even more apparent. The entry price was 601.85, and the current price afterward has come to 575.9, with the downside room gradually being released.

In this position, the +305.93% feedback is still in line with expectations. The more profit appears, the more you need to pro
BNB-1.47%
BTC-1.60%
ETH-3.10%
View Original
post-image
  • Reward
  • Comment
  • Repost
  • Share
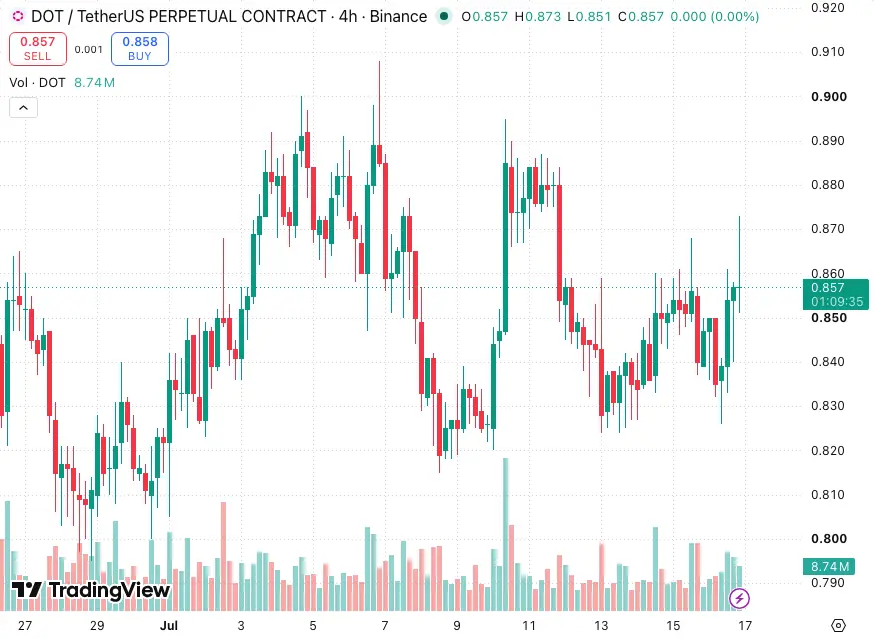
$DOT Ready to go long! After this surge, it’s cooling down now—I think it’s a good opportunity to catch the next move by getting in again.
Entry positions you can watch are in the range of 0.8395 to 0.861. The first upside target is 0.882; if it breaks through, it may run to 0.907. Put the defensive level at 0.814.
But keep in mind the risks: if 0.855 can’t hold, there could be a deeper shakeout to test the 1-hour MA25. Everyone, don’t get too excited and go all-in—control your position size based on your own account. Also, you can pay attention to the buy orders below as well for $SNDK and
DOT0.71%
View Original
post-image
  • Reward
  • Comment
  • Repost
  • Share
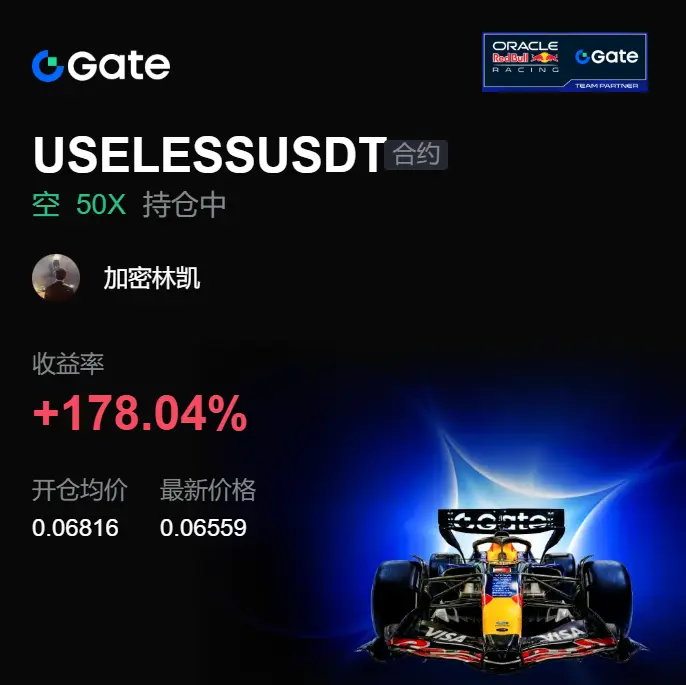
I’m not surprised at all that these shorts moved the way they did. Before $USELESS reached the high area, it kept failing to break through. The rally never got follow-through, but the pullback became smoother and smoother. From that moment on, the chart was already off; many people were still entertaining long-side fantasies. What I care about more is the continuous weakening after the pressure.

A short opened around 0.06816 is already down to 0.06537 now, +189.35% in profit. During the drop, the most genuine signal wasn’t simply talking bearish—it was that every rebound was weaker than the
USELESS-19.28%
BTC-1.60%
ETH-3.10%
View Original
post-image
  • Reward
  • Comment
  • Repost
  • Share
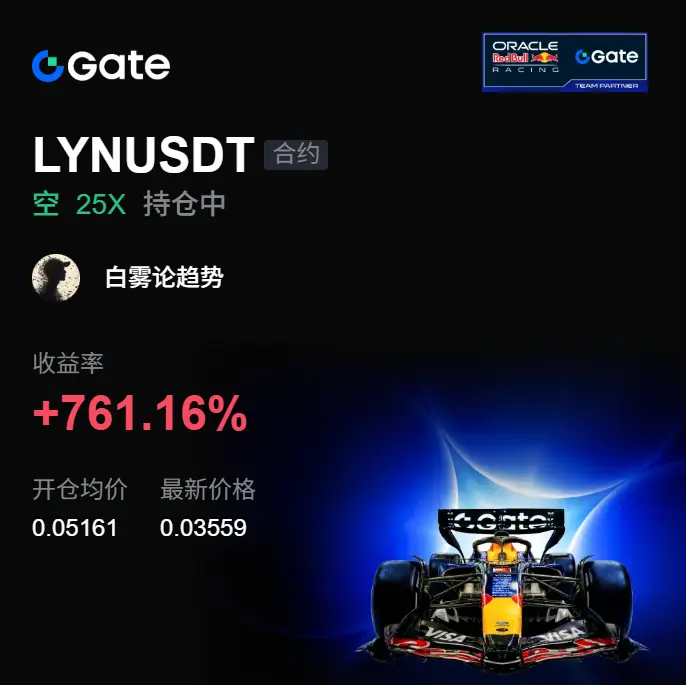
That just dumped it cleanly—$LYN ’s “fake strength” at the high end finally got torn open by the market.
My short entry is at 0.05161. Now the price is at 0.03559, and the return is +761.16%. The best part of this trade isn’t that it dropped and only then I went short—it was already off when it first started pumping: once price hit resistance above, it rolled over. Trading looked lively, but the price just couldn’t move up.
Many people got dragged in by the final push higher, thinking it could break through again. But the main force flipped and pressed down instead—turning the momentum-chasing
LYN-1.56%
BTC-1.60%
ETH-3.10%
View Original
post-image
  • Reward
  • Comment
  • Repost
  • Share
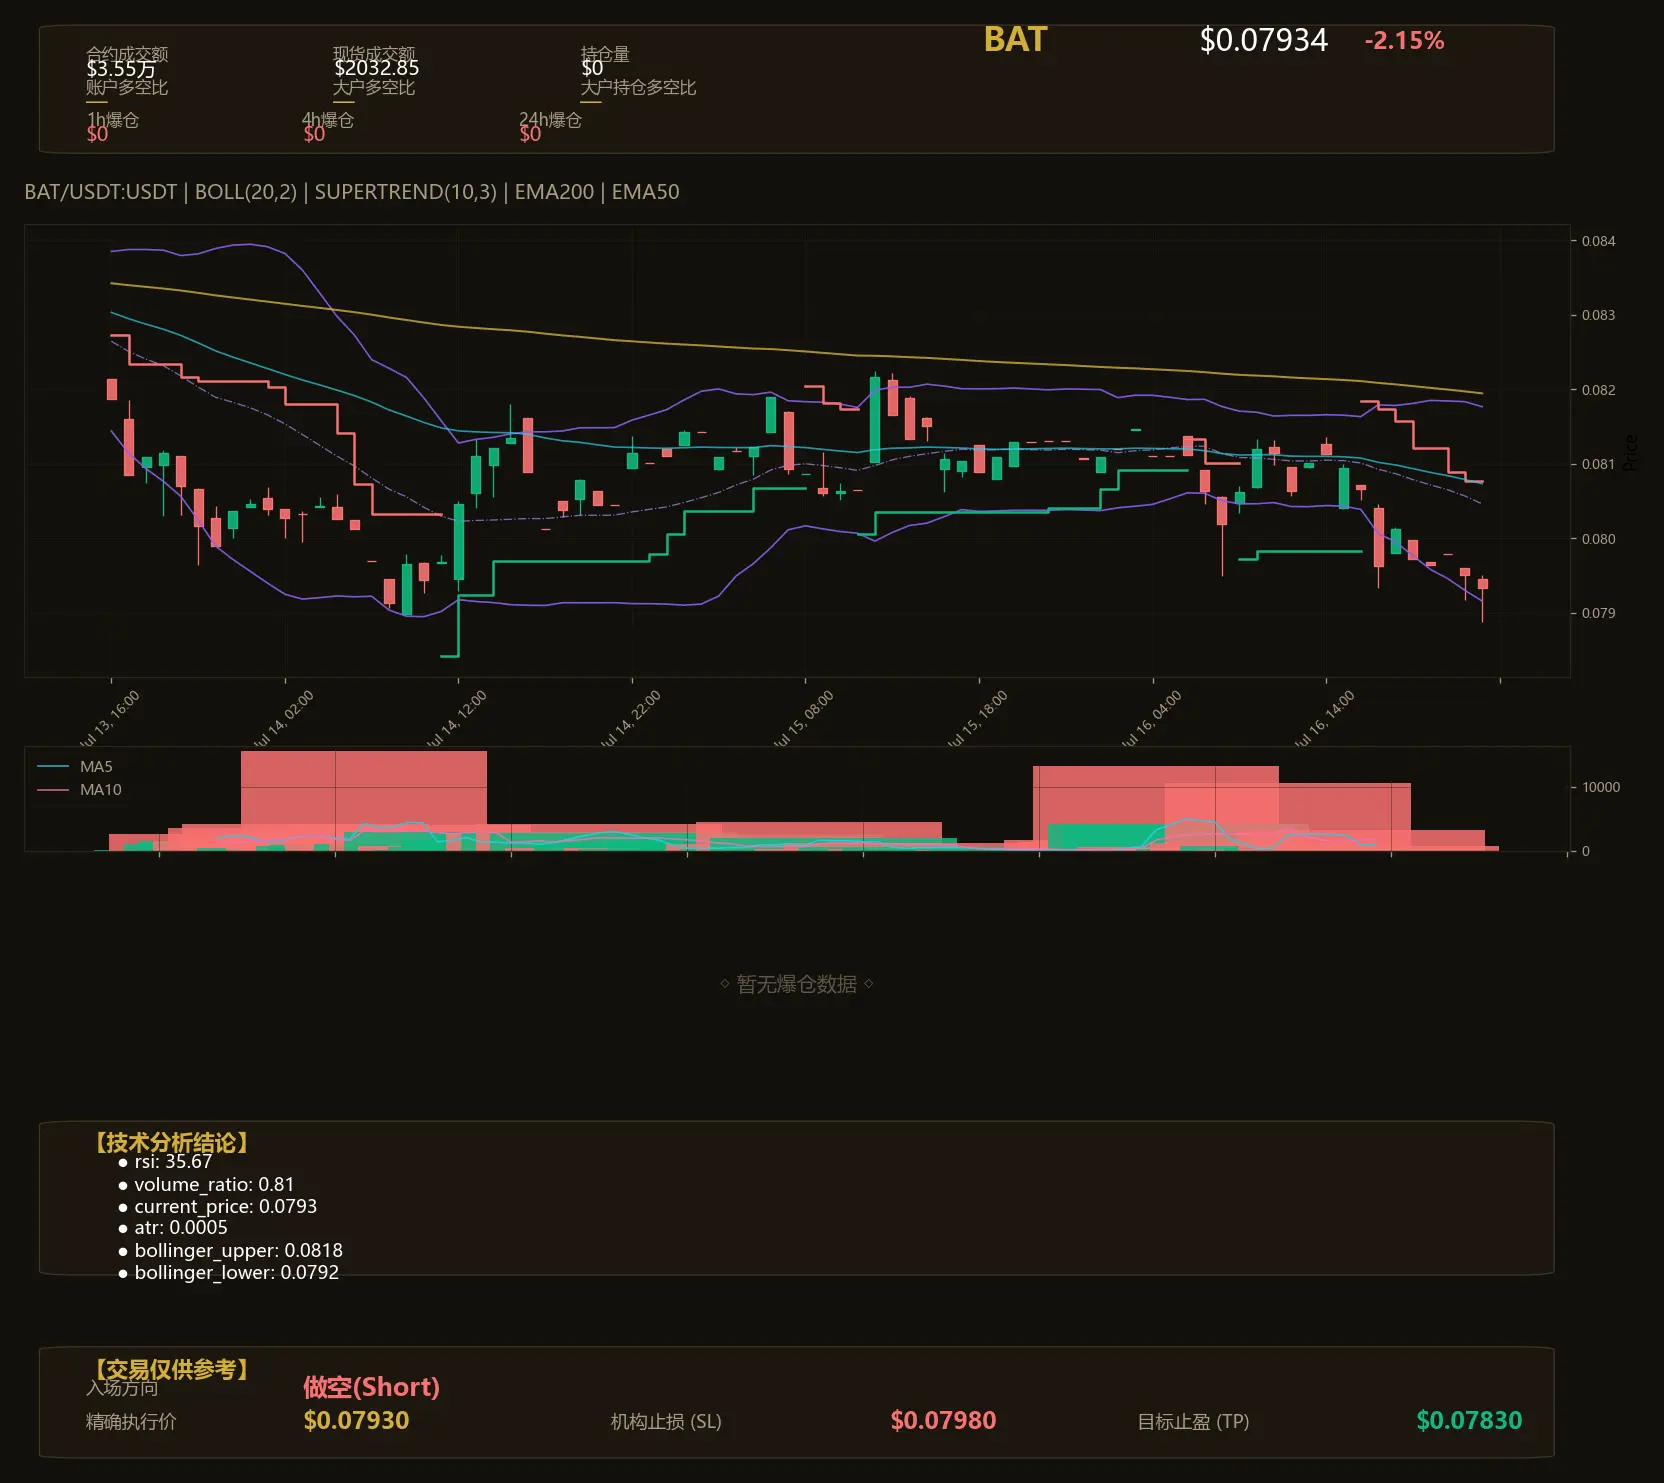
This BAT chart is so ugly it makes me want to curse. The fund flows are all dog-operator trades fighting each other, and retail investors can’t even get a mouthful of soup before getting chopped and running for the exit. This move is purely internal gamesmanship, with zero fundamental support. The K-line shows clear abnormal movement—market makers are just waiting to catch the panic sell orders.
My indicators show that around 0.0793 is an excellent position to lay a trap. Don’t just stand there waiting for a rebound—this level is basically handing out money.
If you want to secretly take a
BAT-1.93%
View Original
post-image
  • Reward
  • Comment
  • Repost
  • Share
BREAKING: Bitmine generated $45.7M staking revenue Q1 2026 with 4.9M ETH earning at $284M annual rate.
BMNR-2.15%
ETH-3.14%
post-image
post-image
  • Reward
  • Comment
  • Repost
  • Share
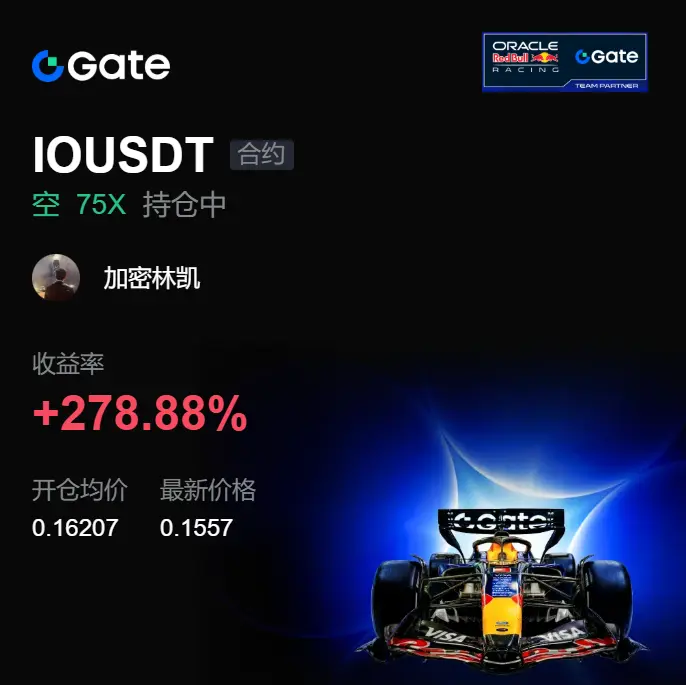
This drop just now is crucial. It’s not a sudden single bearish candle, but the result of repeated failed attempts under pressure in a high zone. For $IO , I’ve been watching whether it can regain control from above. In the end, every time it rallies up, it gets pushed back down. The structure has clearly changed.
I had already been watching this area. After shorting around 0.16207, the chart didn’t give much hesitation time. The real confirmation came when it broke down and failed to reclaim on the rebound. A lot of people were still waiting for it to pull back, but the price had already slid
IO-4.10%
BTC-1.60%
ETH-3.10%
View Original
post-image
  • Reward
  • Comment
  • Repost
  • Share
100,000 minutes later roughly 70 days no sleep
6 days ago I wake up to a validated edge ⭐️ after building 250+ bots on @claudeai
It was a never ending journey but I knew I would reach this day just don’t give up you’ll make it twin
Up over $30k from $200 🤣
  • Reward
  • Comment
  • Repost
  • Share
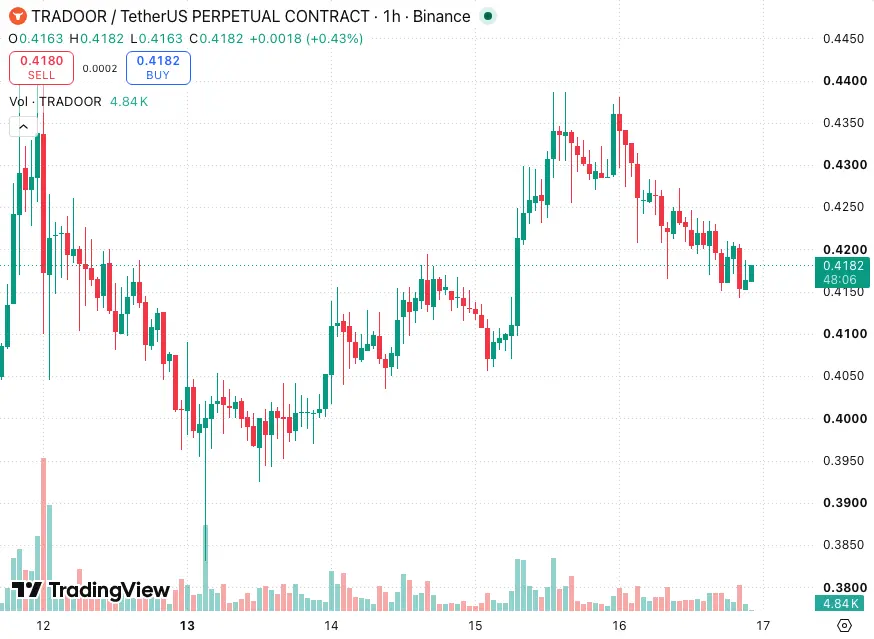
$TRADOOR Watch for short opportunities. The current price is stuck in the range 0.41600 to 0.41720, and the seller momentum may be building. From a higher-level perspective, the short structure remains intact, and at the daily level this area still looks bearish. The 15-minute RSI is currently around 43; there seems to be room for further downside, and the volume data also confirms genuine seller participation. On the downside, watch for levels around 0.41240 and even 0.40530, with a defense around 0.42230. Be mindful of risk when trading contracts—set a stop-loss and don’t go in too aggressi
TRADOOR-4.40%
View Original
post-image
  • Reward
  • Comment
  • Repost
  • Share
TODAY MARKET UPDATES
gate liveLIVE
83
  • Reward
  • Comment
  • Repost
  • Share
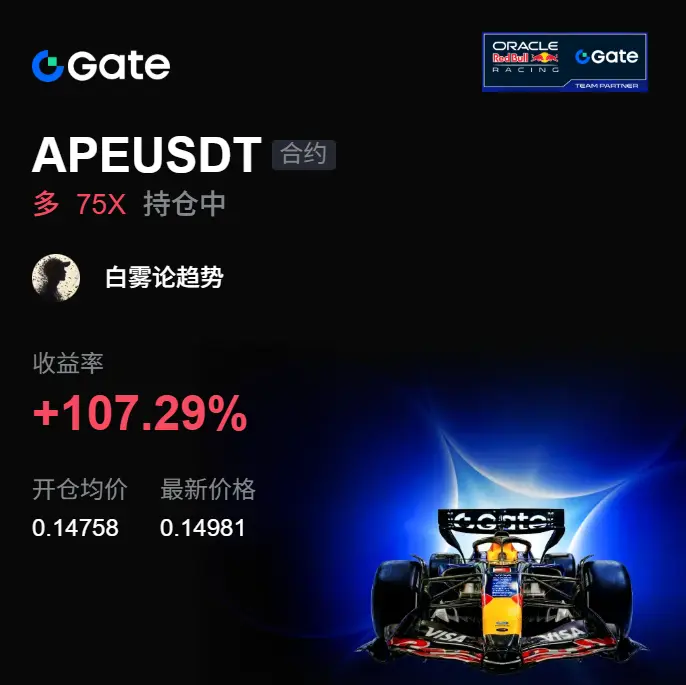
Many people were just doubting whether $APE was a fake breakout, but the price has already moved from 0.14758 to 0.14981, with +107.29% sitting right there—the feedback from the order book is very direct.

The level I was watching earlier was, in fact, the follow-up support after that pullback. What really caught my attention is that when sell orders came down hard, they didn’t continue to increase in volume; instead, they were quickly absorbed, and the structure clearly changed. To put it plainly, this isn’t a normal rebound—bulls are starting to take back the tempo.

Holding this long posi
APE-2.68%
BTC-1.60%
ETH-3.10%
View Original
post-image
  • Reward
  • Comment
  • Repost
  • Share
Investment Reflections — From “All-in Youth” to “Prudent Player,” I Took Three Years
Three years ago, when I first entered the crypto world, I was an absolute “all-in youth.” Back then, I thought the crypto market was a place to get rich overnight. Seeing others post trades showing gains of dozens of times or even hundreds of times made me feel like I could do it too. So every time, I went all-in on a single coin, dreaming of leaving once it doubled. As you can imagine, after a few major pullbacks, most of my principal was gone. During that period, I spent every day anxiously checking the char
BTC-1.62%
View Original
post-image
post-image
  • Reward
  • 1
  • Repost
  • Share
StrideTowardMoney:
That’s a bull market for you; just look at the bear shit.
market prices updates
gate liveLIVE
24
  • Reward
  • Comment
  • Repost
  • Share
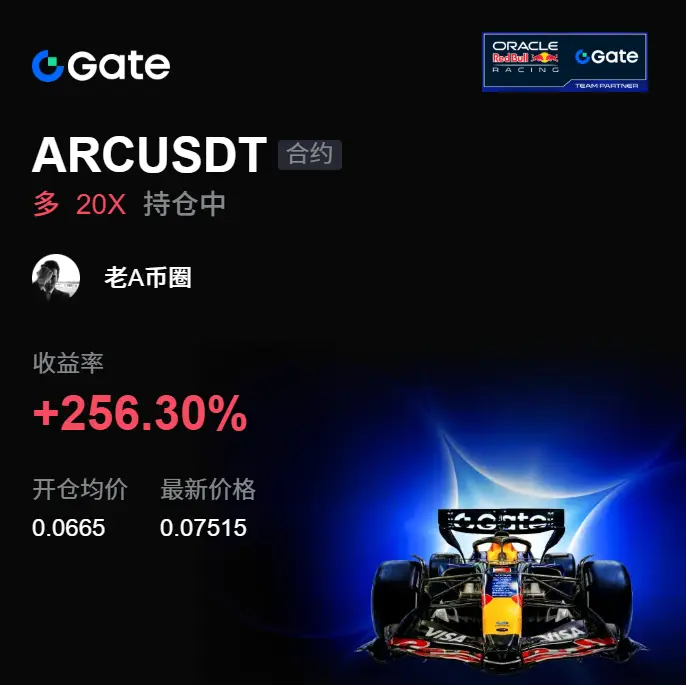
Did I just sleep one night and the account starts doing work on its own? 😂 This morning when I opened the charts, $ARC directly filled back all the noise from days ago. A few days back, when the price kept whipping around during the session, I saw the pullback hold steady and the buy pressure start to strengthen, so I reminded everyone not to panic-sell recklessly—only if you can hold the structure do you get to eat.
Entry reference: 0.06650. Now it’s already run up to 0.07527, +256.3%—profit in hand. The timing on this move seems to be spot on; everyone in the car should be smiling wide awa
ARC-1.61%
BTC-1.60%
ETH-3.10%
View Original
post-image
  • Reward
  • Comment
  • Repost
  • Share
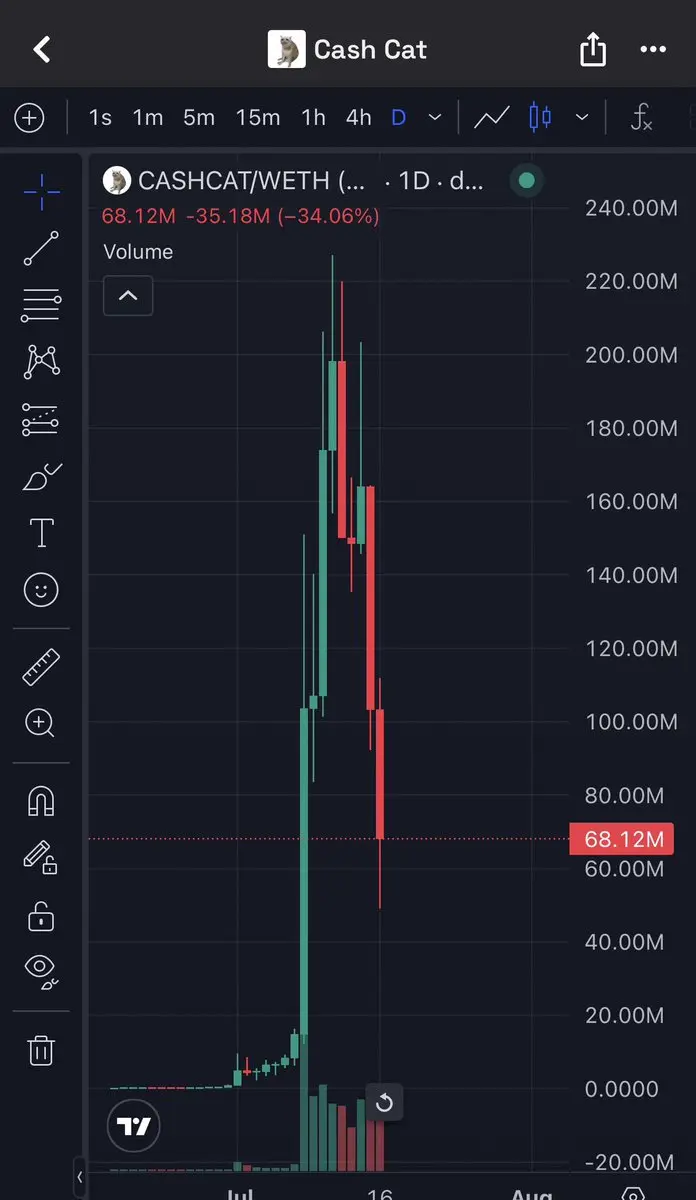
What happened to cash-cat:native 🥲
post-image
  • Reward
  • Comment
  • Repost
  • Share
Polymarket's pUSD stablecoin on Polygon surpasses $600 million in market cap.
post-image
post-image
  • Reward
  • Comment
  • Repost
  • Share
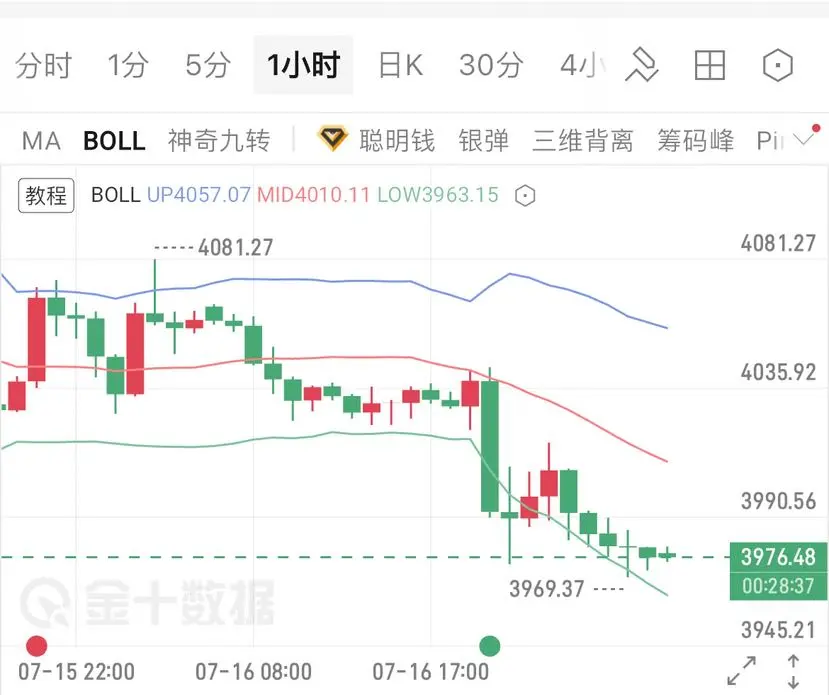
July 17 Fundraising Lady - Yellow Fish Early News
The data-driven momentum continues the downward trend, with the head trend fully opening
1. From a review of the order book, due to a favorable impact from late-night U.S. economic data on the dollar, gold has continued to weaken, dipping to the low of 3969. The current price is 3976. On the hourly chart, price has been continuously trading near the lower Bollinger Band around 3963, bearing below the Bollinger middle band at 4010. In the short term, resistance lies at 4010 and 4057 above; support near term lies at 3963 below. The overall downtr
XAUT-1.72%
View Original
post-image
  • Reward
  • 2
  • Repost
  • Share
OusdSleeper:
This drop is indeed severe. Data is broadly bullish for the US dollar, and the gold bulls are routed. However, the technicals are already close to the lower Bollinger Band, so there may be a short-term technical rebound. It’s best not to chase too deeply; it’s safer to short only after the rebound moves back above 4,000.
View More
Load More

Join 40 M users in our growing community

⚡️ Join 40 M users in the crypto craze discussion
💬 Engage with your favorite top creators
👍 See what interests you
  • Pinned