

Share your thoughts
placeholder
Article
Smart money is quietly pressing short on TAO while retail chases the range.

$TAO /USDT - SHORT

Trade Plan:
Entry: 249.9 – 251.9
SL: 262.8
TP1: 242.0
TP2: 236.0
TP3: 227.1

Why this setup?
Why now? The daily trend is range-bound, but the 4h setup is screaming short with 77.4 confidence. The 1h RSI at 55.16 shows neutral momentum, not overbought exhaustion, so the move down is still clean. The 1h ATR of 3.82 means the entry zone near 250.9 gives a tight stop without noise. From there, the first target of 242.0 and the second target of 236.0 stack the odds for a quick R:R, while the invalida
TAO+9.23%
CPU Stocks Explode Higher! Intel jumps 10 and AMD gains over 7. Can chip stocks keep pushing higher?
live-cover
LIVE1,851
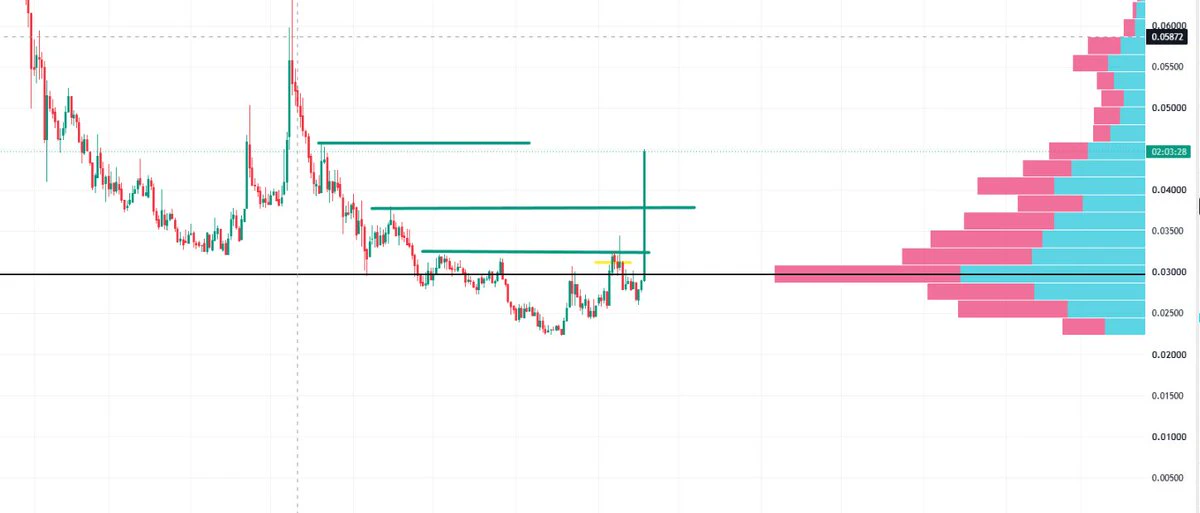
Guys ‼️ $MEGA
is building pressure after the breakout .!!! If momentum remains strong, the next leg could send it to the moon....!!Entry ...! 0.0422 .!!Stop loss ...! 0.0395.!!TP ..!! 0.0450 & 0.0480 Long $MEGA 👇BTCBreaks80K
post-image
MEGA+18.53%
🧑‍🍳 Cooking with…………….🔜bring more deals
Insiders are calling $ZEC /USDT the next breakout, but the real move hides in the 1h RSI.

$ZEC /USDT - LONG

Trade Plan:
Entry: 1497.91 – 1514.51
SL: 1426.57
TP1: 1565.94
TP2: 1605.76
TP3: 1665.49

Why this setup?
Why now? The daily trend is bullish, the 4h bias is LONG, and the 1h RSI at 65.82 shows momentum is building without being overbought. The 1h ATR of 33.182459 means the next candle could push the 1h price past the entry zone of 1506.21, targeting TP1 at 1565.94 and TP2 at 1605.76. This setup only holds as long as the 1h price stays above the invalidation level of 1222.76, which i
ZEC+3.09%
$UNI There isn't much time left to hesitate at the $9 level.
It surged 16.5% in 24 hours, with trading volume reaching $1.15 billion. That's not volume retail traders can generate. From a low of 7.51 to a high of 9.45, the intraday range exceeded 25%. Volatility like this only appears a few times a month. The current price is 9.06, sitting slightly above the midpoint—neither rising nor falling, which is exactly the point to act.
The scenarios are simple. First, if it pulls back to the 8.6–8.8 range and stabilizes on declining volume, that's an entry window. Set the stop-loss at 8.2; if it brea
UNI+16.01%
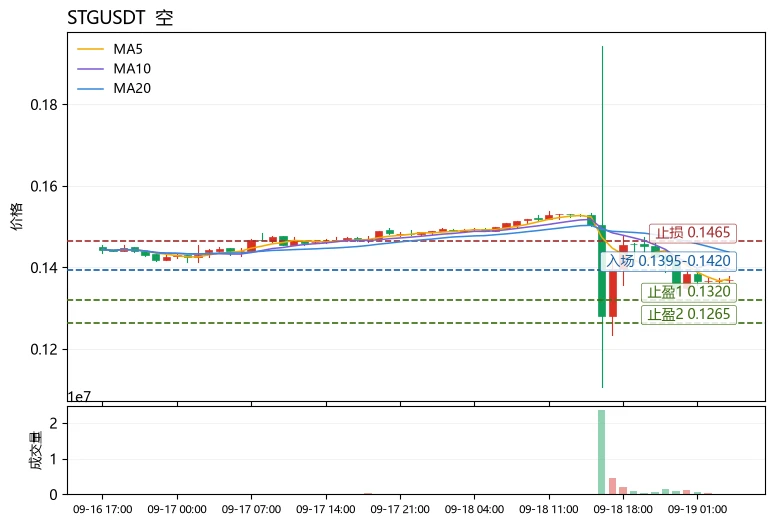
Many people rush to buy the dip when RSI falls below 40, while ignoring that the moving-average structure and MACD are still weakening in sync—oversold does not mean a bottom has formed, which is the most common source of losses in left-side trading.
Returning to $STG ’s chart. The current price is 0.137, and MA5=0.13712 has fallen below MA20=0.14374. The short- and medium-term moving averages are arranged bearishly, while the price is moving along the lower Bollinger Band at 0.128938, indicating that downside momentum has not yet been fully released. The MACD histogram is -0.0008019 and remai
post-image
STG-5.36%
ZK+21.66%
$VVV ‌ Perp — 1H Chart Read 📊
VVV is showing a clean recovery back toward the local high. After the rejection from $27.70, buyers absorbed the pullback and the price has climbed back to $27.62.
That’s constructive, but the price is now basically sitting at resistance, so I wouldn’t chase this candle.
Current price: $27.62
Supertrend: $25.155 🟢
24H high: $27.699
Resistance: $27.70 → $27.96
Support: $27.00 → $26.60 → $25.15
Order book: 80.12% bids vs 19.88% asks
Long setup
Preferred entry: $26.90–$27.20
SL: $26.50
TP1: $27.70
TP2: $28.00
TP3: $28.80–$29.50
The cleaner momentum setup is a 1H
VVV+8.99%
NVDA+1.23%
  • 3
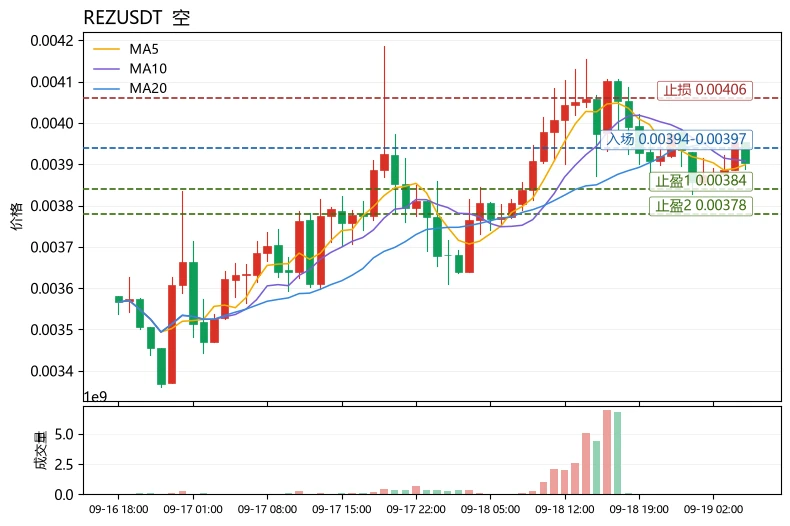
$REZ Current price 0.003903, 24h +3.83%, trading volume 128.2M USDT; however, the moving average structure is not healthy: MA5=0.0038988 remains below MA20=0.0039636, the MACD histogram is -1.559e-05, maintaining bearish momentum, RSI is only 50.2, and the price is stuck between the Bollinger lower band at 0.003824 and the middle band, with a 13.91% amplitude over 30 candlesticks. The funding rate is +0.0050%, and the Fear & Greed Index is 56, indicating greed-leaning sentiment, but bullish momentum has not been confirmed.
Here is a reusable method for analyzing charts: to determine whether a
post-image
REZ+3.22%
ETH+7.67%
Lets 10x this real quick haha
$AKE broke to a new high, yet there was no short squeeze or rapid surge with a long upper wick, showing that retail traders have gotten smarter—the liquidation price wasn’t at 0.04. Such smart retail traders.
post-image
AKE+113.38%
$MAGMA ... Buyers firmly defend key support
The 4-hour structure shows signs of a possible rebound from the $0.20–$0.22 support zone. If it can successfully reclaim $0.24–$0.25 with strong trading volume support, this could reinforce a bullish breakout structure and drive the price toward higher resistance levels. Long trade setup Entry: $0.220 – $0.230TP1: $0.270TP2: $0.347TP3: $0.397Stop-loss: $0.184Buy and trade$B
ZEC.
post-image
MAGMA+33.85%
ZEC+3.07%
The AI Rally Is Bigger Than One Stock
What if the most important AI signal isn't the biggest stock—but the number of companies moving together?
This rebound spread across chips, servers, connectivity and AI applications.
Does broader participation make the rally more meaningful?
Part 1 established the headline: Nasdaq gained 1.69%.
Now comes the more interesting question—how broad was the AI move?
The latest session showed strong participation across multiple layers of the technology ecosystem. Tempus AI rose 14.85%, Supermicro 9.50%, Astera Labs 9.06% and Arm 8.57%. Semiconductor names also a
post-image
xxx40xxx
AI Rebound: New Cycle or Relief Rally?
The AI trade just came roaring back—but the bigger story may be what happens next.
Nasdaq jumped 1.69% while several AI names gained nearly double-digit percentages.
Is this the beginning of another AI expansion, or simply a powerful relief rally?
September has already reminded investors how quickly the market can change direction.
After a volatile week dominated by inflation concerns, oil prices, Treasury yields and the Federal Reserve's first rate hike since 2023, U.S. equities suddenly regained momentum. The Nasdaq closed 1.69% higher, the S&P 500 added 1.14%, and the Dow gained 0.61%. The VIX also dropped 10.23%, showing a clear reduction in near-term market fear.
But the most interesting part was inside the technology sector.
Tempus AI surged 14.85%, Supermicro gained 9.50%, Astera Labs rose 9.06%, and Arm climbed 8.57%. Semiconductor stocks were particularly strong, with the Philadelphia Semiconductor Index gaining 3.14%.
That creates an important distinction.
The market did not simply buy “technology.” It aggressively repriced companies connected to the AI infrastructure chain.
For Web3 and crypto traders, this is a familiar pattern. Narratives can move first, but sustainable trends require liquidity, participation and fundamental confirmation.
AI now faces the same test.
One strong session proves momentum—not a new market regime.
Over the next four parts, we will examine breadth, liquidity, infrastructure and valuation to determine what this rebound is actually telling us.
The first signal is bullish momentum. The next question is much harder: can the AI trade keep attracting capital after the initial excitement fades?
This content is not investment advice. Always perform your own research before making financial decisions.
$BTC $GT $ETH
#USAIConceptStocksReboundAcrossTheBoard #Gate广场中秋团圆局 #美股AI概念股全线反弹 #GateSquareMidAutumnReunion #JapanRealEstatePowerChipStocksRise

repost-content-media
BTC+6.52%
GT+7.17%
ETH+7.67%
  • 11
  • 1
yeah we were in this PRE launch $STRK
Join us if you like to ride BEFORE the breakout.
OR... do you just buy FOMO... that's the wrong way.
post-image
STRK+53.17%
#NEARSurgesOver21Breaking3
🚀 NEAR Protocol Market Analysis — Strong Breakout Momentum
NEAR Protocol has delivered a powerful 24-hour surge, with live market data showing NEAR around $3.66, up roughly 21.6%, while another live market source reports a 24-hour gain of about 24.05% and a weekly gain of 46%. The intraday range has been approximately $2.99–$3.82, showing that buyers have aggressively stepped in after the recent consolidation.
What makes this move interesting is that NEAR is not only moving higher on a one-day basis. The broader momentum has accelerated significantly, with one cur
  • 9
  • 1
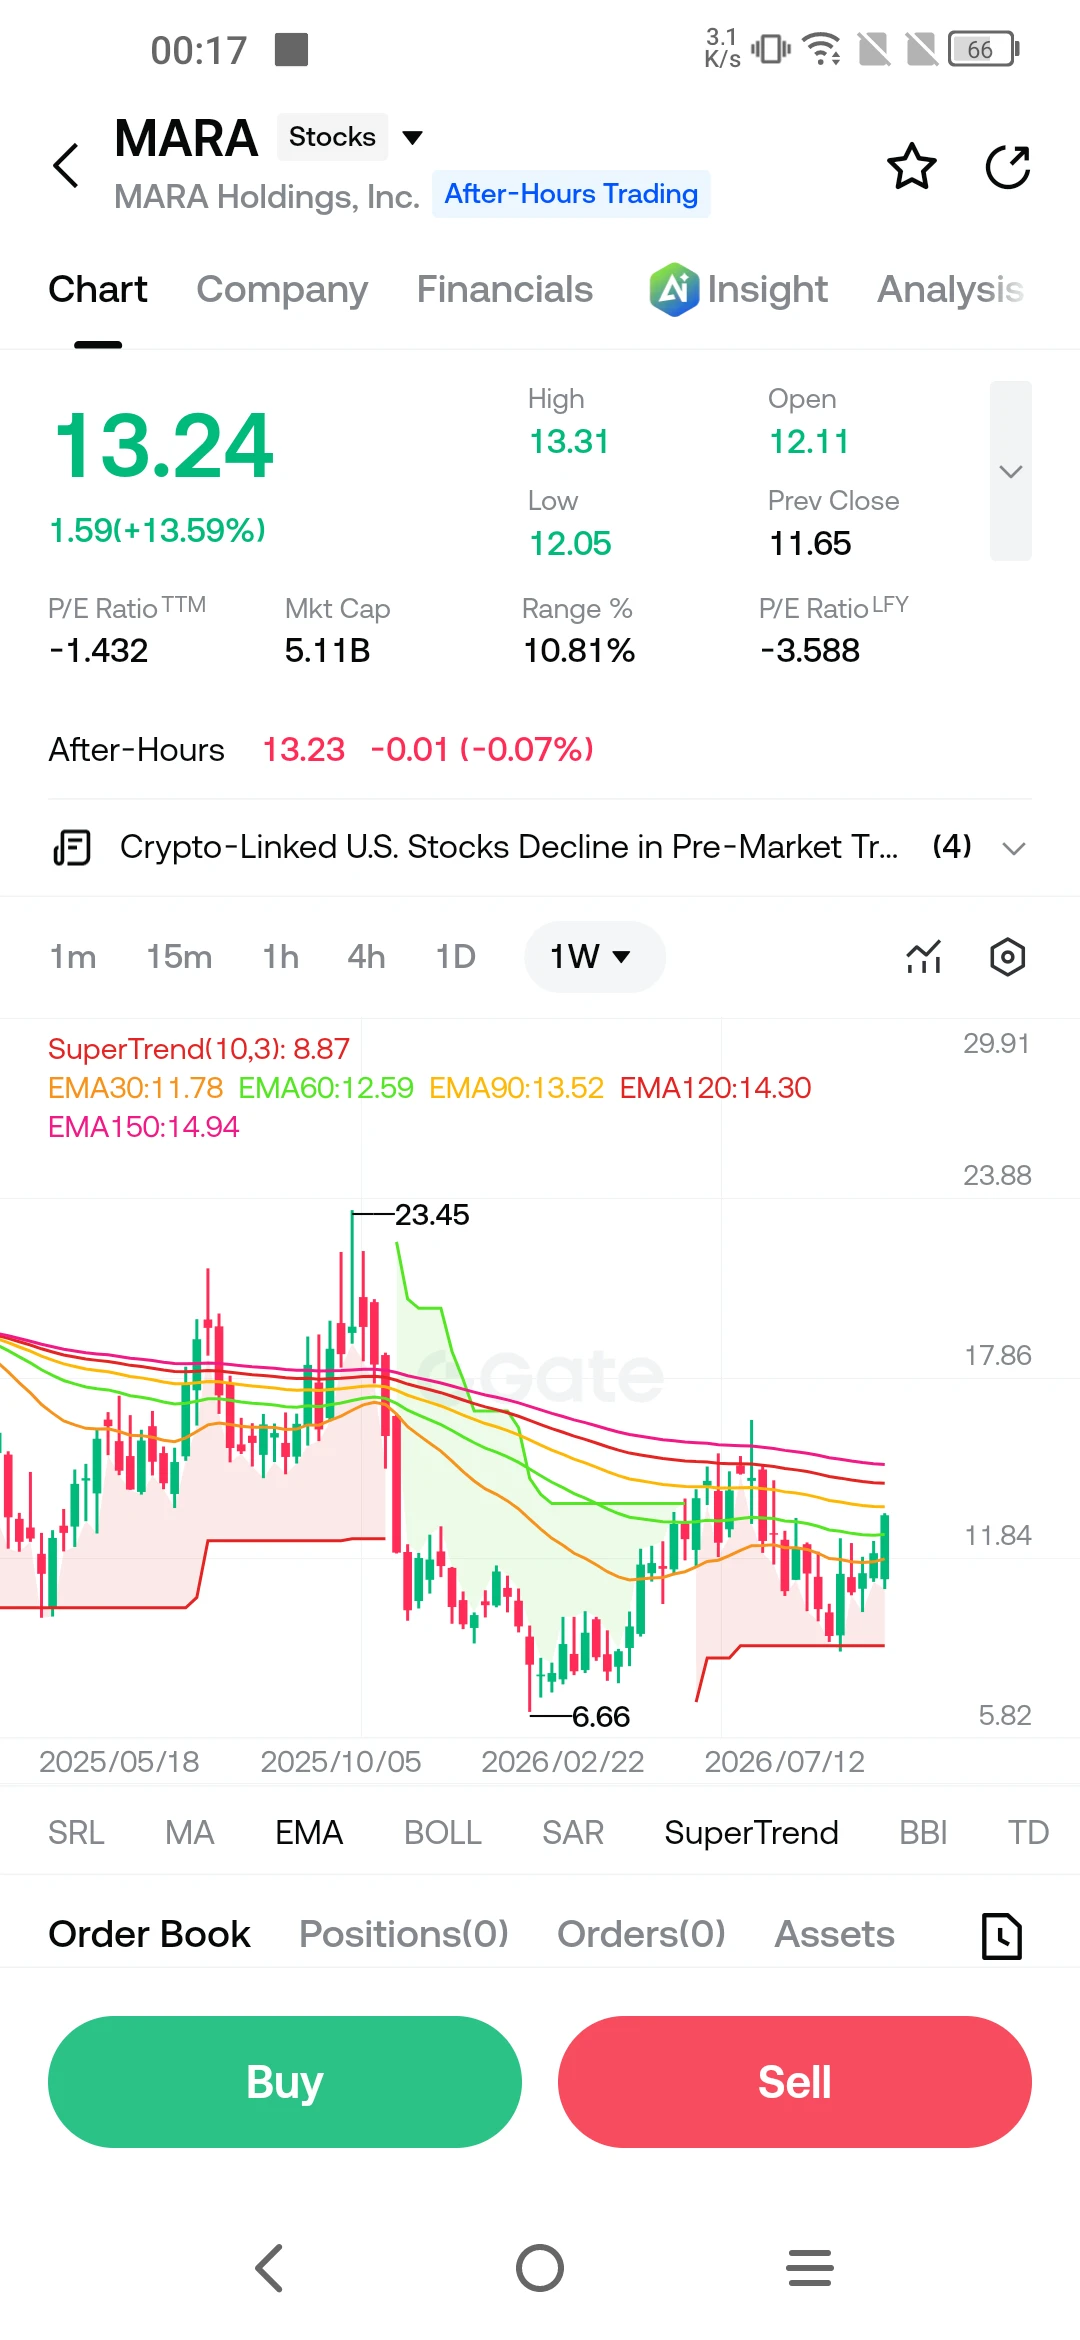
$MARA Bitcoin rallied above $80,000 on Friday, gaining roughly 5.5% over 24 hours and recovering from a slide toward $75,000 earlier in the week. The recovery followed the Federal Reserve's first rate hike since July 2023 and the SEC's approval of a five-year exemption for tokenized stock trading, developments that broadly lifted crypto-linked equities.
MARA Holdings (MARA) traded at $13.24, up 13.59% on the day. The company holds a large bitcoin position and trades as a high-beta proxy for the asset, so its move tracked the broader crypto rally. No fresh company-specific disclosure was repo
post-image
MARA+13.59%
  • 3
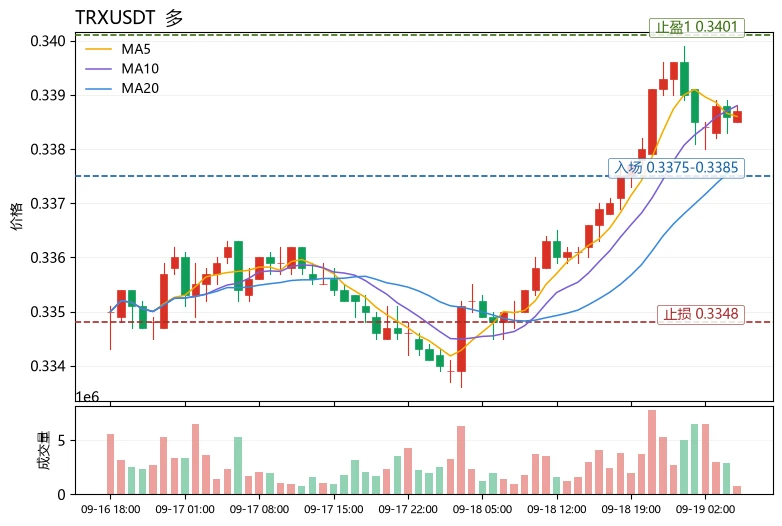
$TRX Current price 0.3387, 24h +1.04%, trading volume 26.4M USDT. MA5=0.3386 has crossed above MA20=0.3377, with the moving averages beginning to form a bullish alignment; the MACD histogram at +1.094e-05 remains positive, while RSI 65.9 is in the strong zone but has not reached overbought; Bollinger Bands [0.33525, 0.34015] are tightening, with the price trading near the upper band. The amplitude over 30 candles is only 1.86%, forming a low-volatility accumulation structure. The Fear and Greed Index is 56, indicating mildly greedy sentiment, while the +0.0091% funding rate shows longs paying
post-image
DASH+1.68%
$BZ $XTIUSD $XBRUSD
US Strategic Petroleum Reserve Hits a 44-Year Low
There is a number that has quietly moved into territory not seen since the early 1980s, and it deserves attention. The United States Strategic Petroleum Reserve now holds approximately 285 million barrels of crude oil, its lowest level since November 1982. That figure represents less than half of the reserve's historical peak of roughly 700 million barrels, and it is only about 33 million barrels above the congressionally mandated minimum of 252.4 million.
The decline is the product of years of releases, first under the pre
post-image
BZ-0.89%
XTIUSD-0.98%
XBRUSD-0.62%
  • 8
  • 1
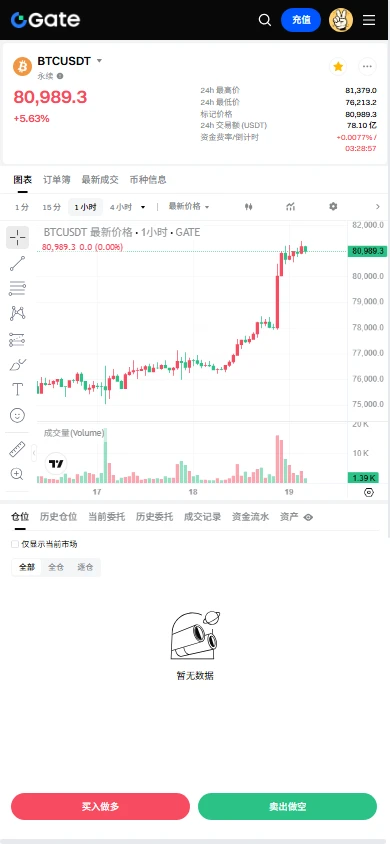
$BTC Signal】Long + 1H momentum continuation
$BTC 1H momentum continuation, 4H above the upper Bollinger Band at 80575. Order book depth imbalance -82.21%, bid/ask 0.10, with a thick sell wall. 1H RSI 80.66, 4H RSI 76.95. 4H MACD histogram expanding at 589.29, 1H histogram contracting at 218.39. OI is flat, funding rate 0.0060%. Chasing longs directly offers mediocre risk/reward; buying on a pullback is more comfortable.
🎯Direction: Long
⚡Entry/limit order: 80754.607 - 80997.600
🛑Stop loss: 80187.624
🚀Target 1: 82212.564
🚀Target 2: 82820.046
🛡️Trade management:
- Execution strategy: After
post-image
BTC+6.52%
Load More

Join 40 M users in our growing community

⚡️ Join 40 M users in the crypto craze discussion

💬 Engage with your favorite top creators

👍 See what interests you

Trending Topics

JapanRealEstatePowerChipStocksRise

58.7k Views3.63k Discussing

Japan's Nikkei extended gains on Sept 18, with real estate, power, and semiconductor sectors leading. Gate covers over 12,800 global stocks and ETFs, offering one-stop USDT trading across US, HK, Korean, and Japanese markets. [👉 Read more](https://www.odaily.news/en/newsflash/518749)

USAIConceptStocksRally

33.47k Views536 Discussing

GateTopsStockPerpetualCoverage

37.62k Views2.32k Discussing

View More